. 2024 Dec;19(12):3750-3776.
doi: 10.1038/s41596-024-01033-8. Epub 2024 Aug 8.

Massively parallel sample preparation for multiplexed single-cell proteomics using nPOP

Affiliations

Massively parallel sample preparation for multiplexed single-cell proteomics using nPOP

Andrew Leduc et al. Nat Protoc. 2024 Dec.

Abstract

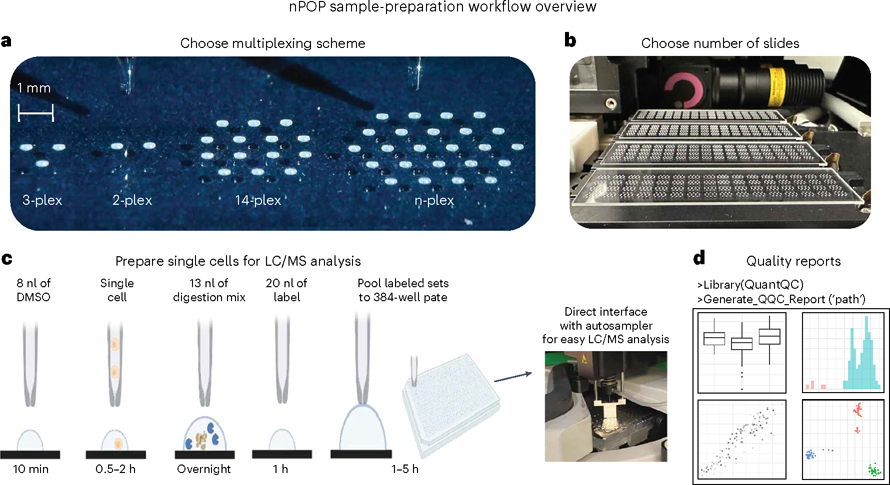
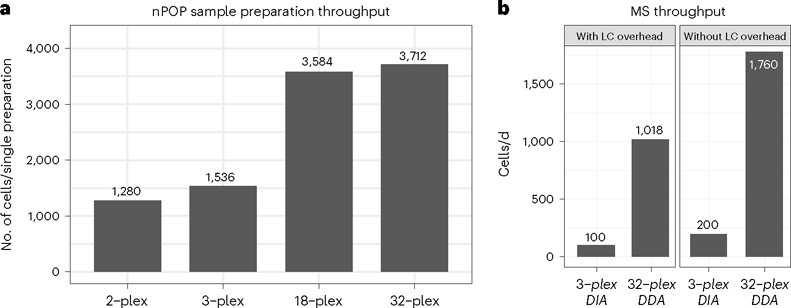
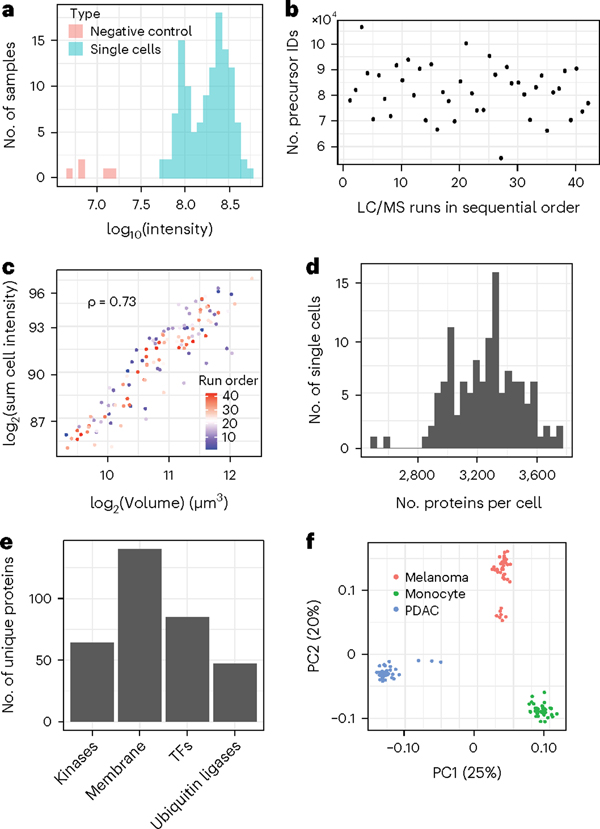
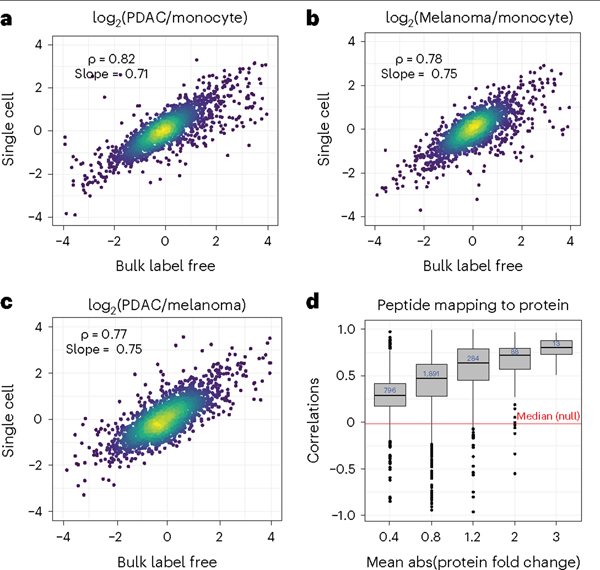
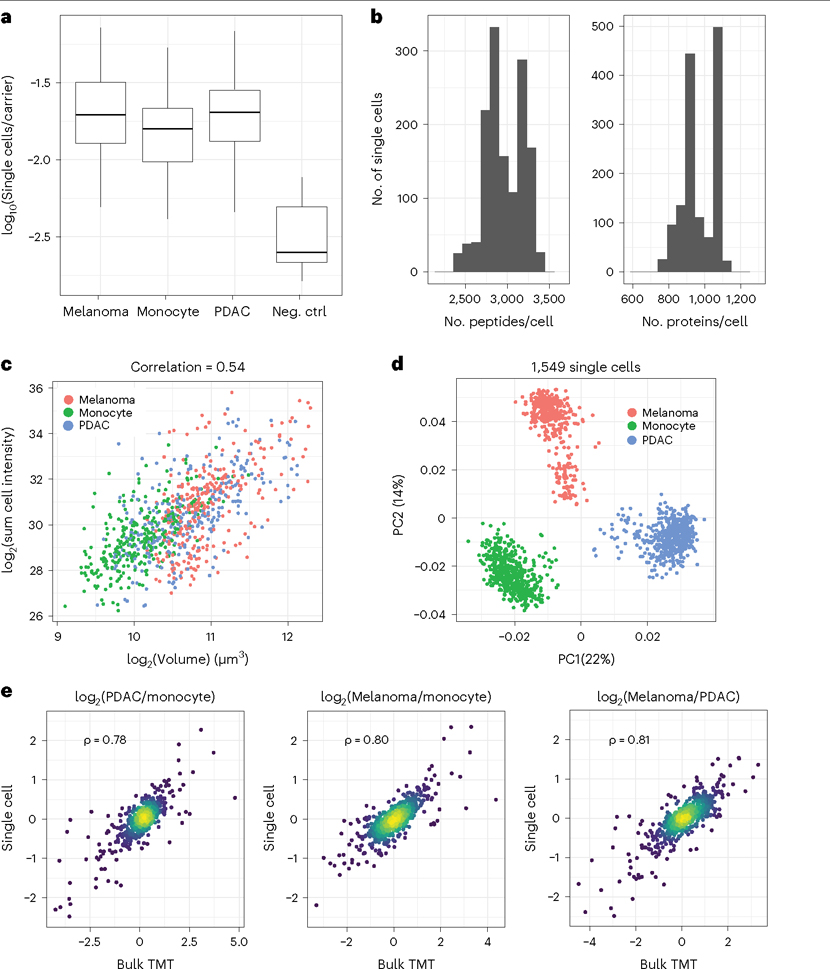
Single-cell proteomics by mass spectrometry (MS) allows the quantification of proteins with high specificity and sensitivity. To increase its throughput, we developed nano-proteomic sample preparation (nPOP), a method for parallel preparation of thousands of single cells in nanoliter-volume droplets deposited on glass slides. Here, we describe its protocol with emphasis on its flexibility to prepare samples for different multiplexed MS methods. An implementation using the plexDIA MS multiplexing method, which uses non-isobaric mass tags to barcode peptides from different samples for data-independent acquisition, demonstrates accurate quantification of ~3,000-3,700 proteins per human cell. A separate implementation with isobaric mass tags and prioritized data acquisition demonstrates analysis of 1,827 single cells at a rate of >1,000 single cells per day at a depth of 800-1,200 proteins per human cell. The protocol is implemented by using a cell-dispensing and liquid-handling robot-the CellenONE instrument-and uses readily available consumables, which should facilitate broad adoption. nPOP can be applied to all samples that can be processed to a single-cell suspension. It takes 1 or 2 d to prepare >3,000 single cells. We provide metrics and software (the QuantQC R package) for quality control and data exploration. QuantQC supports the robust scaling of nPOP to higher plex reagents for achieving reliable and scalable single-cell proteomics.


Conflict of interest statement

Competing interests: N.S. is a founding director and CEO of Parallel Squared Technology Institute, which is a nonprofit research institute. J.C. is an employee of SCIENION US Inc.

Figures

Fig. 1 |
Fig. 1 |. nPOP workflow.
a, nPOP is a proteomic sample-preparation method that prepares single cells in droplets on the surface of fluorocarbon-coated glass slides. This allows for flexible design that can fit any desired multiplexing scheme as reflected by the number of droplets per cluster. b, A picture of a workflow using four glass slides and the 14-plex design allowing simultaneous preparation of 3,584 single cells for prioritized proteomic analysis. c, A schematic of the nPOP method illustrates the steps of cell lysis, protein digestion, peptide labeling, quenching of labeling reaction, sample pooling and transfer of the pooled samples to an autosampler plate. These steps are performed for each single cell (corresponding to a single droplet). d, To analyze data generated from an nPOP sample preparation, the QuantQC R package can be used to map all metadata and generate quality reports for quick evaluation of the experiment. DMSO, dimethyl sulfoxide.
Fig. 2 |
Fig. 2 |. Sample preparation and MS throughput.
a, Depending on the multiplexed scheme selected, the user can prepare between 1,280 and 3,712 cells for analysis in a single sample preparation. The number of cells that is possible in practice depends on the spacing on the slide. At lower levels of multiplexing, there are more multiplexed sets to pick up; at some point, the pickup takes too long to be practical. b, The number of single cells analyzed per day by LC-MS/MS for 3-plexDIA (100 cells/d) and by pSCoPE (1,018 cells/d). LC-MS/MS throughput could be further increased by methods that obviate sample loading and column washing overheads such as the use of trapping columns or EvoSep.
Fig. 3 |
Fig. 3 |. Droplet camera assessment of droplet stability.
a, Acceptable stable droplet of an aqueous solution including cell suspensions, digestion mix, TEAB buffer and HA. b, Acceptable stable droplet of DMSO solution including label mixtures. c, Possible poor droplet of DMSO showing satellite droplet requiring adjustment of voltage or pulse width or cleaning of the nozzle to obtain acceptable droplet.
Fig. 4 |
Fig. 4 |. Evaluating head camera images of slides.
a, A head camera image taken of a single field. Each slide contains four replicate fields. Each field contains a quality spot (1. DMSO, 2. cell, 3. digestion mix) that indicates if a reagent-dispensing issue occurred mid-run. b, The user may also be able to identify failed dispensing if the reagent misses the droplets. c, A successful dispensing is often indicated by a consistent increase in the size of the reaction droplet from pre-dispensing images to post-dispensing images and should not show smaller droplets to the side of primary spots. d, An after-image of failed pickup shows significant residue left behind on the slide. e, An after-image of a successful pickup shows little to no residue left on the slide.
Fig. 5 |
Fig. 5 |. Summary of plexDIA 3-plex data prepared by nPOP.
a, Distribution of the total signal (estimated as summed intensity from all peptides) for both single cells and negative controls, which have received trypsin and label but no cell. b, Number of identified precursors over the course of the LC-MS/MS runs. The numbers remained stable, indicating stable data acquisition. The amount of protein injected depends on the size of the cells in the set; cell size can vary substantially. c, Cell volume has strong positive correlation with summed peptide signal as a proxy for total protein content, indicating consistency of sample preparation. d, Distribution of the number of proteins quantified per cell. e, Number of kinases, membrane proteins, transcription factors (TFs) and ubiquitin ligases identified in the plexDIA data set. f, Principal component analysis shows that cells discretely cluster by cell type. The two clusters of melanoma cells correspond to previously characterized subpopulations in this cell line7.
Fig. 6 |
Fig. 6 |. Evaluating the quantitative accuracy of plexDIA samples.
All pairwise protein fold changes between the three cell types were estimated from single-cell plexDIA measurements by using nPOP and from bulk samples analyzed by label-free DIA. The corresponding estimates were compared on a log2 scale. a, Pancreatic ductal adenocarcinoma (PDAC)/monocyte. b, Melanoma/monocyte. c, PDAC/melanoma. For each pair of cell types, single-cell fold changes were averaged in silico. d, Consistency of protein quantification was estimated by the correlations between peptides mapping to (and thus probably originating from) the same protein. The distributions of these correlations were binned by the absolute (abs) fold change variation of the proteins. Proteins varying more across the single cells have higher correlations. The red line represents the median of the null distribution of correlations computed between peptides from different proteins. This plot is generated by QuantQC.
Fig. 7 |
Fig. 7 |. Single-cell proteomics at >1,000 single-cell samples/d.
a, The average over all peptides of single-cell reporter ion intensities divided by the carrier reporter ion intensity for all single cells and negative controls (Neg ctrl). b, Distributions of peptide and protein numbers quantified per single cell. c, Cell volume correlates positively with summed peptide signal, which is a proxy for total protein content. This strong correlation indicates consistency of sample preparation. d, Principal component analysis shows that cells discretely cluster by cell type. The two clusters of melanoma cells correspond to previously characterized subpopulations in this cell line. e, All pairwise protein fold changes between the three cell types were estimated from single-cell pSCoPE measurements by using nPOP and from bulk samples analyzed by using mPOP. The corresponding estimates were compared on a log2 scale. For each pair of cell types, single-cell fold changes were averaged in silico.

Update of

References

    1. Gatto L et al. Initial recommendations for performing, benchmarking and reporting single-cell proteomics experiments. Nat. Methods 20, 375–386 (2023). - PMC - PubMed
    1. Slavov N Unpicking the proteome in single cells. Science 367, 512–513 (2020). - PMC - PubMed
    1. Vistain LF & Tay S Single-cell proteomics. Trends Biochem. Sci. 46, 661–672 (2021). - PMC - PubMed
    1. Budnik B, Levy E, Harmange G & Slavov N SCoPE-MS: mass-spectrometry of single mammalian cells quantifies proteome heterogeneity during cell differentiation. Genome Biol. 19, 161 (2017). - PMC - PubMed
    1. Zhu Y et al. Proteomic analysis of single mammalian cells enabled by microfluidic nanodroplet sample preparation and ultrasensitive NanoLC-MS. Angew. Chem. Int. Ed. Engl. 57, 12370–12374 (2018). - PMC - PubMed

Publication types

LinkOut - more resources