Understanding spatial inequalities and stratification in transportation accessibility to social infrastructures in South Korea: multi-dimensional planning insights
- PMID: 39117776
- PMCID: PMC11310190
- DOI: 10.1038/s41598-024-68536-y
Understanding spatial inequalities and stratification in transportation accessibility to social infrastructures in South Korea: multi-dimensional planning insights
Abstract
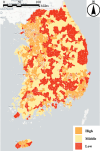
This research investigated spatial inequalities in transportation accessibility to social infrastructures (SIs) in South Korea, using a multi-dimensional methodological approach, including descriptive/bivariate analysis, explanatory factor analysis (EFA), K-Mean cluster analysis, and multinomial logit model (MNL). Our study confirmed pronounced spatial disparities in transportation accessibility to SIs, highlighting significantly lower access in rural and remote regions compared to urban centers and densely populated areas, consistent with existing literature. Building on prior findings, several additional findings were identified. First, we uncovered significant positive correlations among accessibility to different types of SIs in four critical categories: green and recreation spaces, health and aged care facilities, educational institutions, and justice and emergency services, revealing prevalent spatial inequality patterns. Second, we identified three distinct accessibility clusters (High, Middle, and Low) across the critical SI categories. Specifically, residents within the High cluster benefited from the closest average network distances to all SIs, while those in the Low cluster faced significant accessibility burdens (e.g., 22.9 km for welfare facilities, 20.1 km for hospitals, and 19.2 km for elderly care facilities). Third, MNL identified factors such as population density and housing prices as pivotal in spatial stratification of accessibility. Specifically, areas with lower SI accessibility tended to have a higher proportion of elderly residents. Also, decreased accessibility correlated with diminished traffic volumes across all transportation modes, particularly public transportation. This research contributes to enhancing our understanding of spatial inequalities in transportation accessibility to SIs and offers insights crucial for transportation and urban planning.
Keywords: Nationwide spatial analysis; Social infrastructures; Spatial inequality; Transportation accessibility; Transportation and urban planning.
© 2024. The Author(s).
Conflict of interest statement
The authors declare no competing interests.
Figures


References
-
- Frolova, E. V., Vinichenko, M. V., Kirillov, A. V., Rogach, O. V. & Kabanova, E. E. Development of social infrastructure in the management practices of local authorities: Trends and factors. Int. J. Environ. Sci. Educ.11, 7421–7430 (2016).
-
- Israel, E. & Frenkel, A. Social justice and spatial inequality: Toward a conceptual framework. Prog. Hum. Geogr.42, 030913251770296 (2017).
MeSH terms
Grants and funding
LinkOut - more resources
Full Text Sources

