. 2024 Sep;26(9):1571-1584.
doi: 10.1038/s41556-024-01468-x. Epub 2024 Aug 8.

Spermidine is essential for fasting-mediated autophagy and longevity

Sebastian J Hofer  1   2   3   4   5 Ioanna Daskalaki  6   7 Martina Bergmann  1 Jasna Friščić  8   9 Andreas Zimmermann  1   2   3 Melanie I Mueller  1 Mahmoud Abdellatif  3   4   5   10 Raffaele Nicastro  11 Sarah Masser  3   12 Sylvère Durand  4   5 Alexander Nartey  1 Mara Waltenstorfer  1 Sarah Enzenhofer  1 Isabella Faimann  1 Verena Gschiel  1 Thomas Bajaj  13 Christine Niemeyer  13 Ilias Gkikas  6   7 Lukas Pein  1 Giulia Cerrato  4   5 Hui Pan  4   5 YongTian Liang  14   15 Jelena Tadic  1   2   3 Andrea Jerkovic  1 Fanny Aprahamian  4   5 Christine E Robbins  16 Nitharsshini Nirmalathasan  4   5 Hansjörg Habisch  17 Elisabeth Annerer  12 Frederik Dethloff  18 Michael Stumpe  11 Franziska Grundler  19 Françoise Wilhelmi de Toledo  19 Daniel E Heinz  13 Daniela A Koppold  20   21   22 Anika Rajput Khokhar  20   23 Andreas Michalsen  20   22 Norbert J Tripolt  24   25 Harald Sourij  24   25 Thomas R Pieber  3   24   25   26 Rafael de Cabo  27 Mark A McCormick  16 Christoph Magnes  26 Oliver Kepp  4   5 Joern Dengjel  11 Stephan J Sigrist  14   15 Nils C Gassen  13 Simon Sedej  3   10   28 Tobias Madl  3   17 Claudio De Virgilio  11 Ulrich Stelzl  2   3   12 Markus H Hoffmann  8   9 Tobias Eisenberg  1   2   3 Nektarios Tavernarakis #  29   30 Guido Kroemer #  31   32   33 Frank Madeo #  34   35   36
Affiliations

Spermidine is essential for fasting-mediated autophagy and longevity

Sebastian J Hofer et al. Nat Cell Biol. 2024 Sep.

Abstract

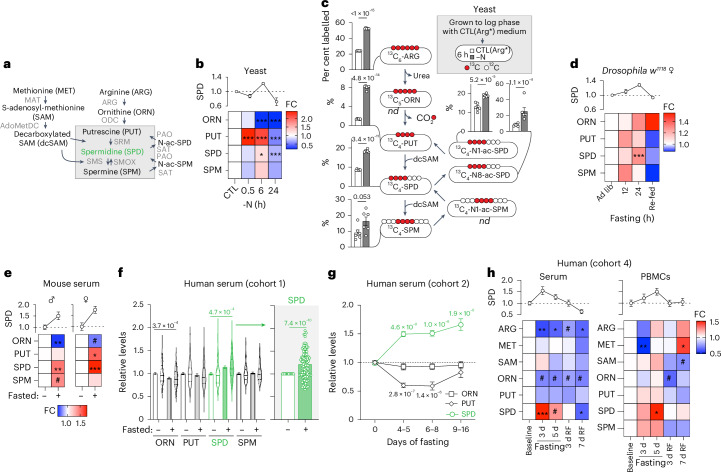
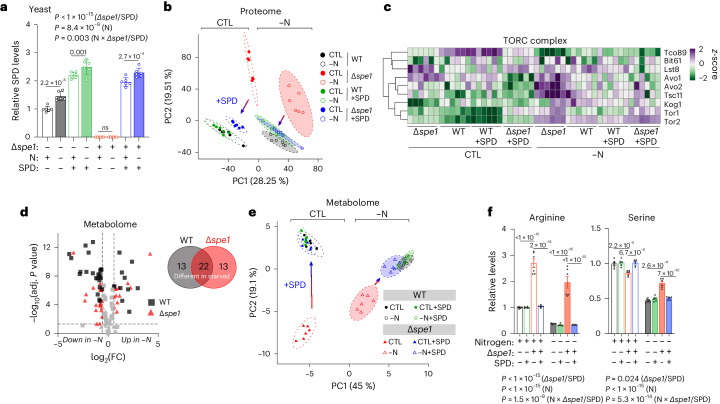
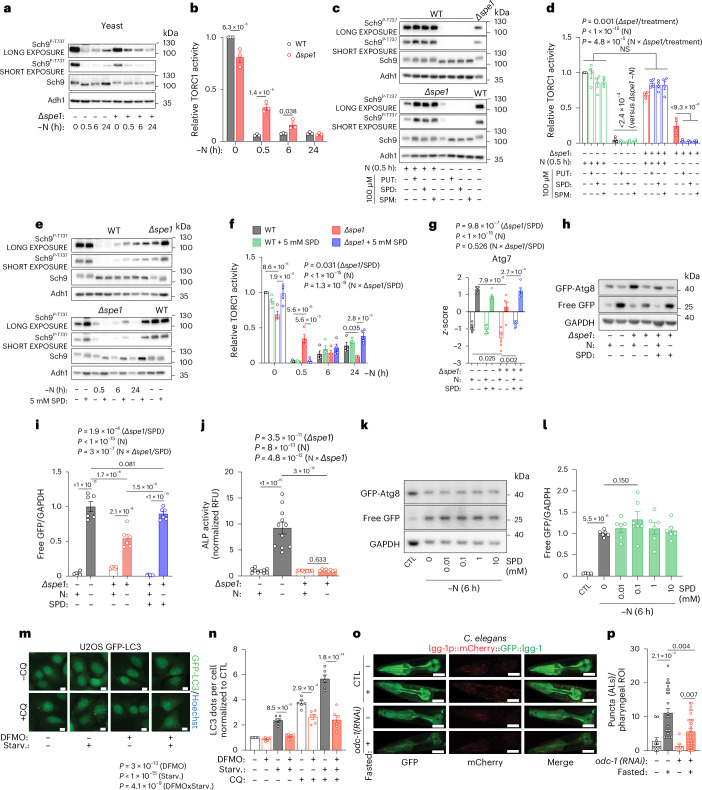
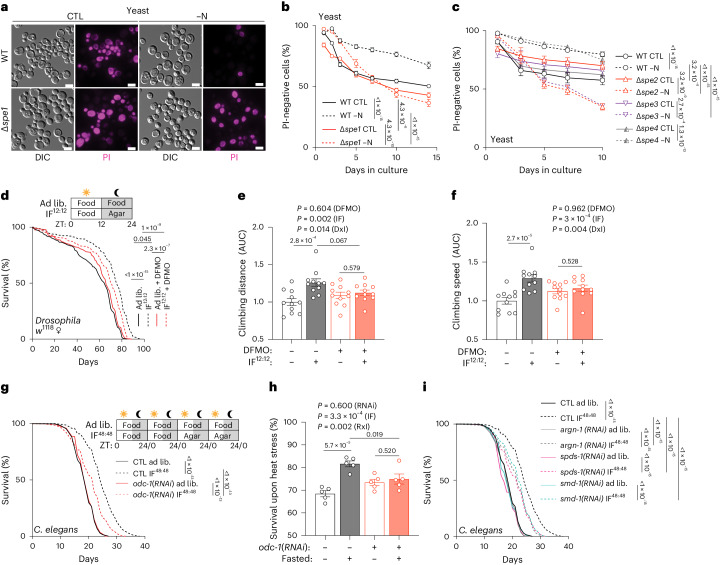
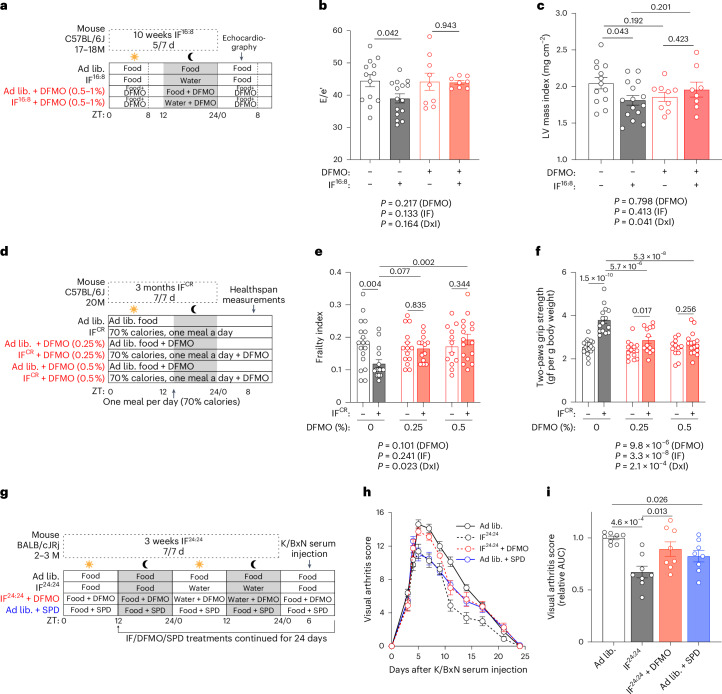
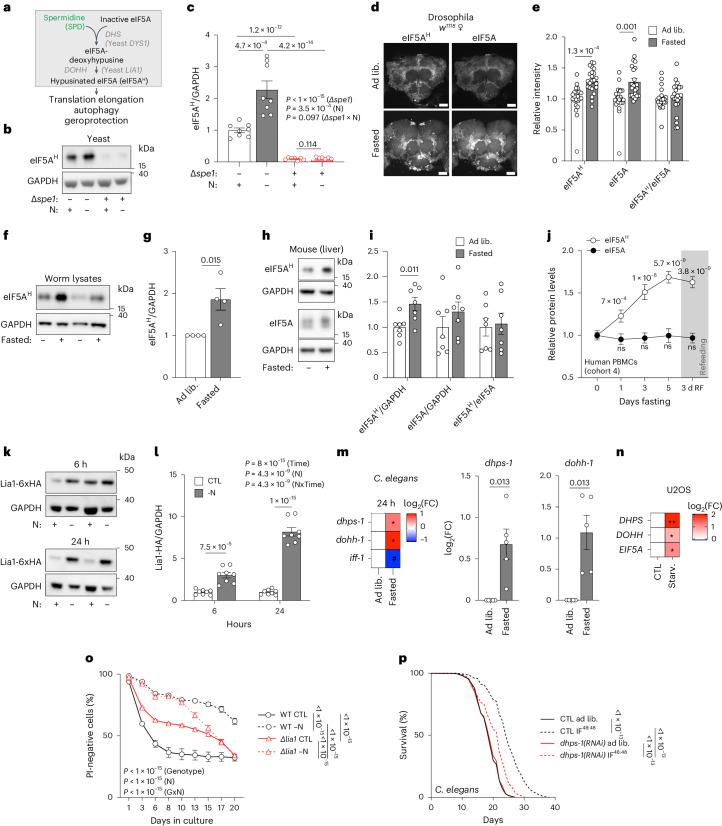
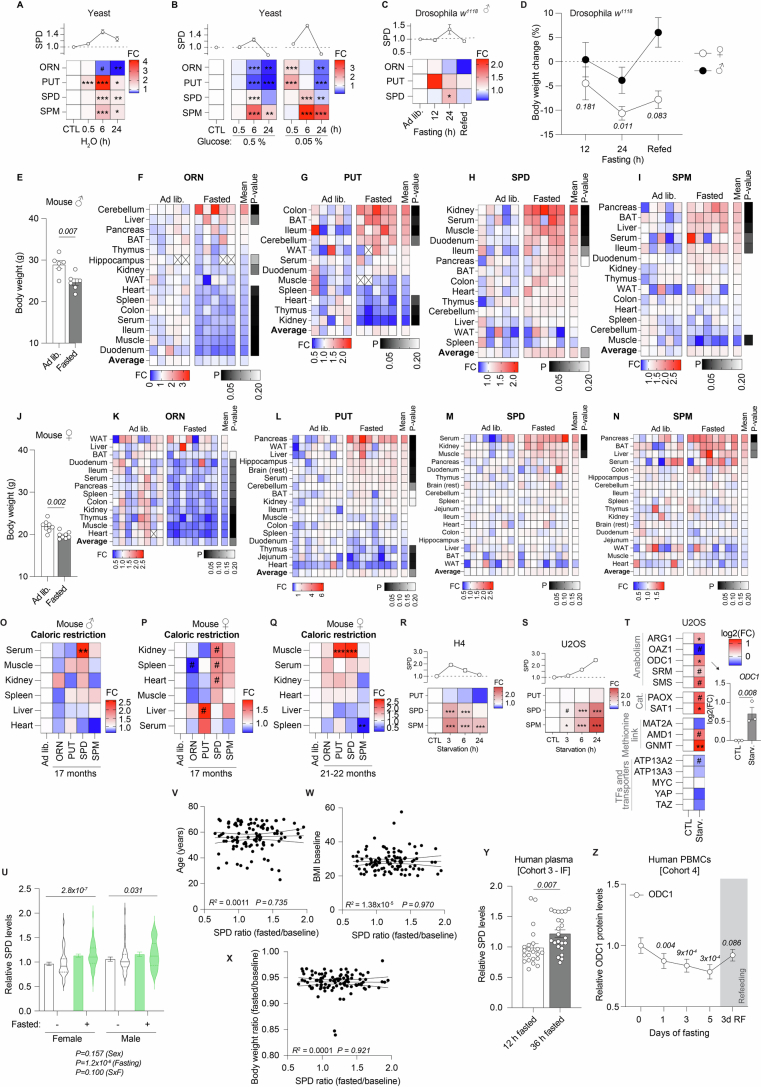
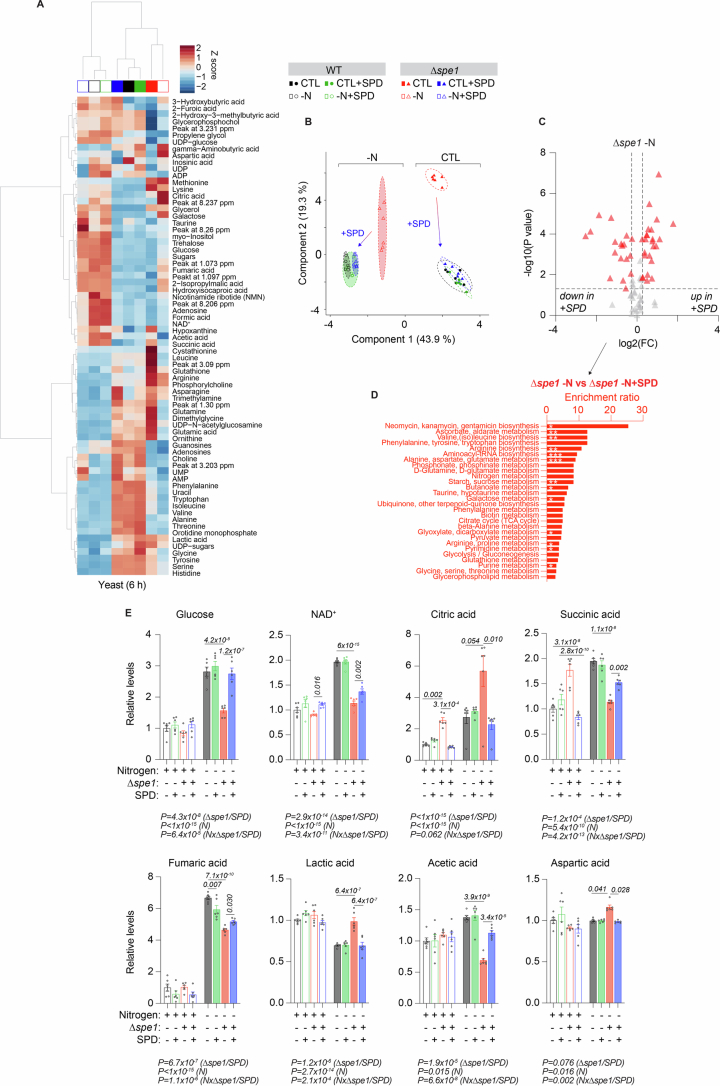
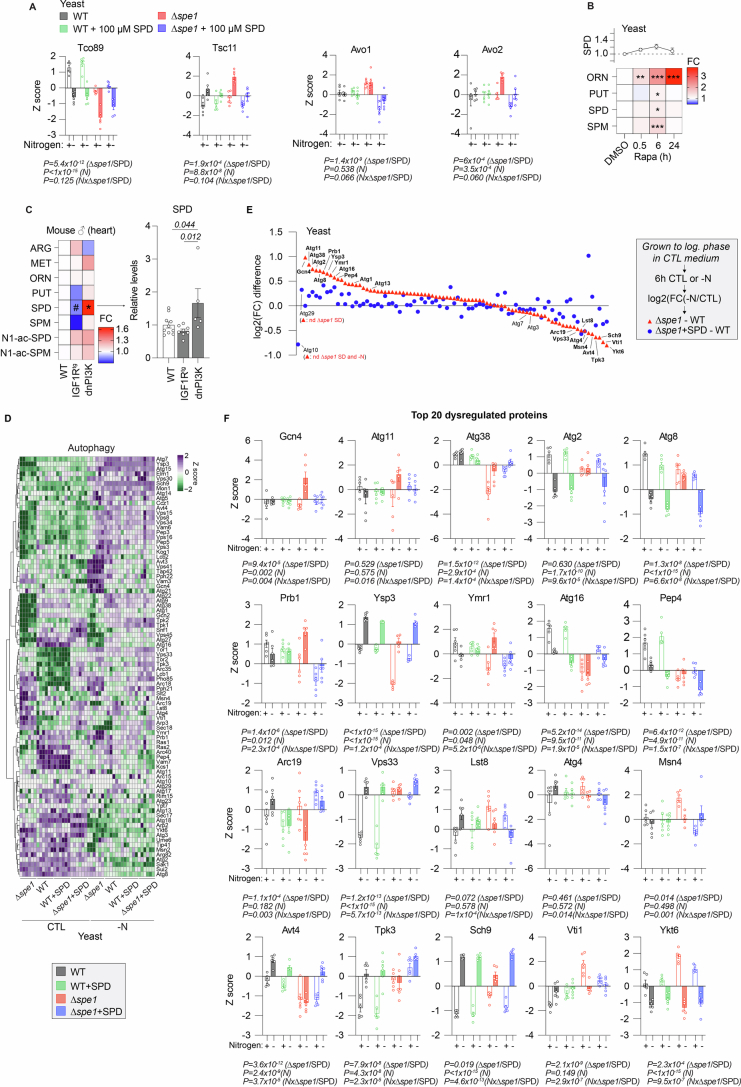
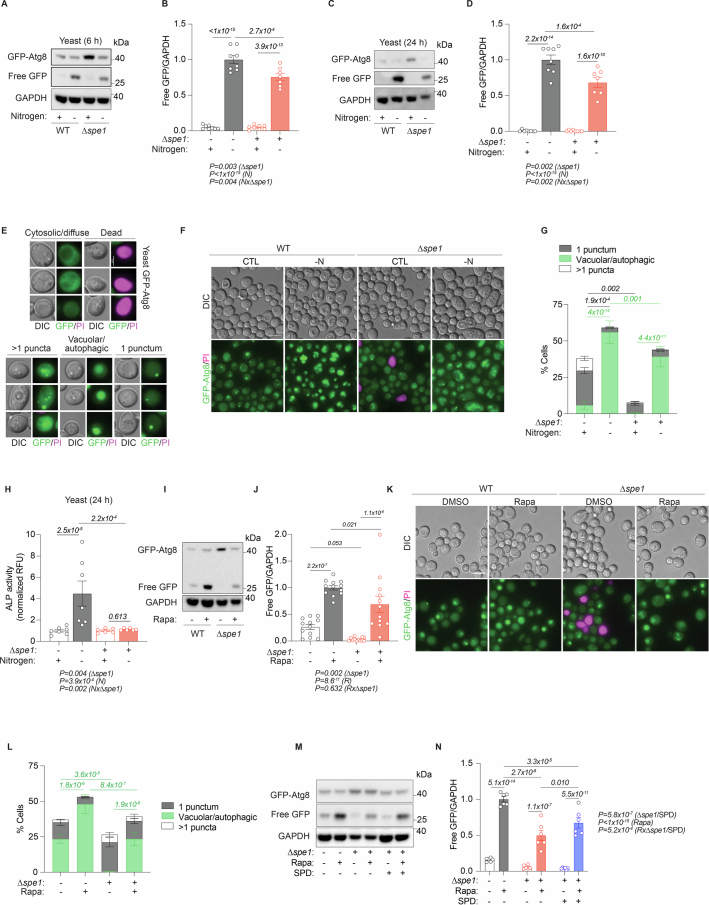
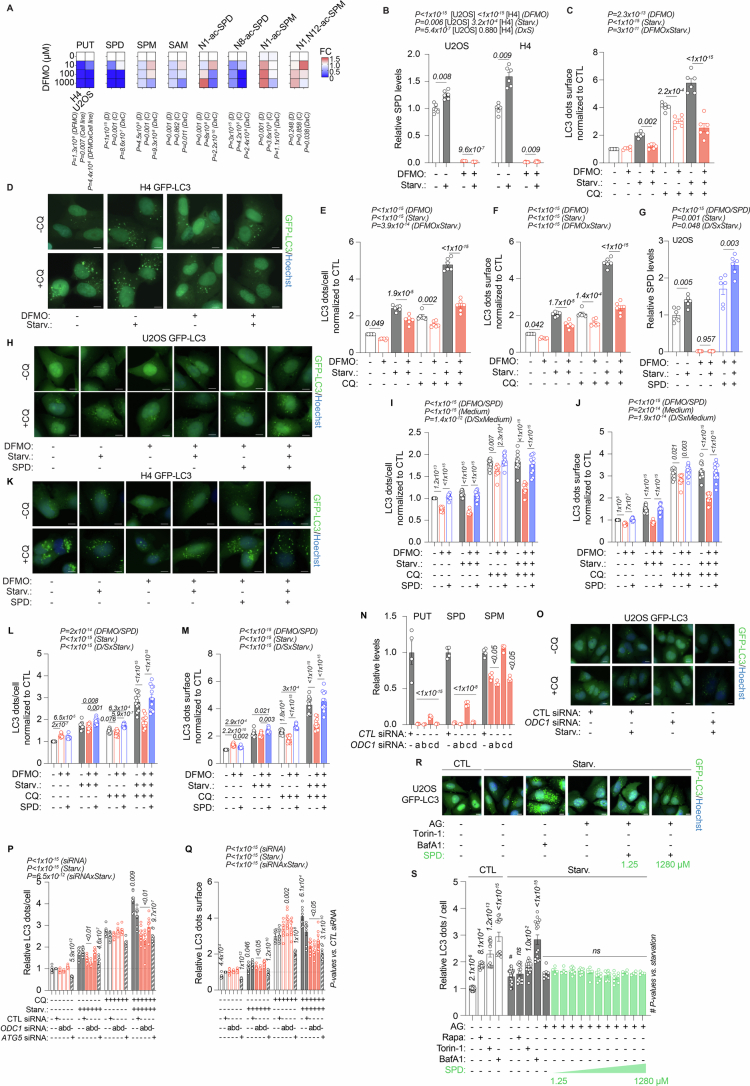
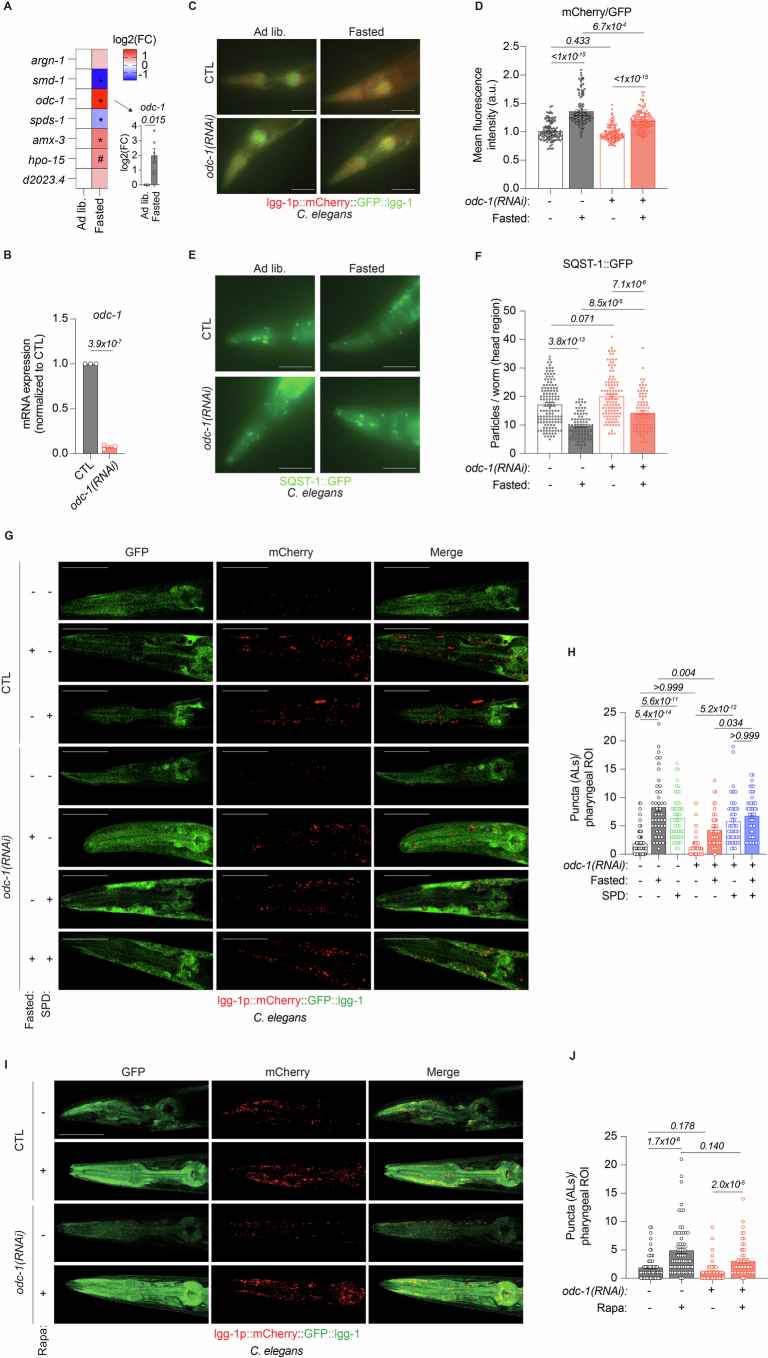
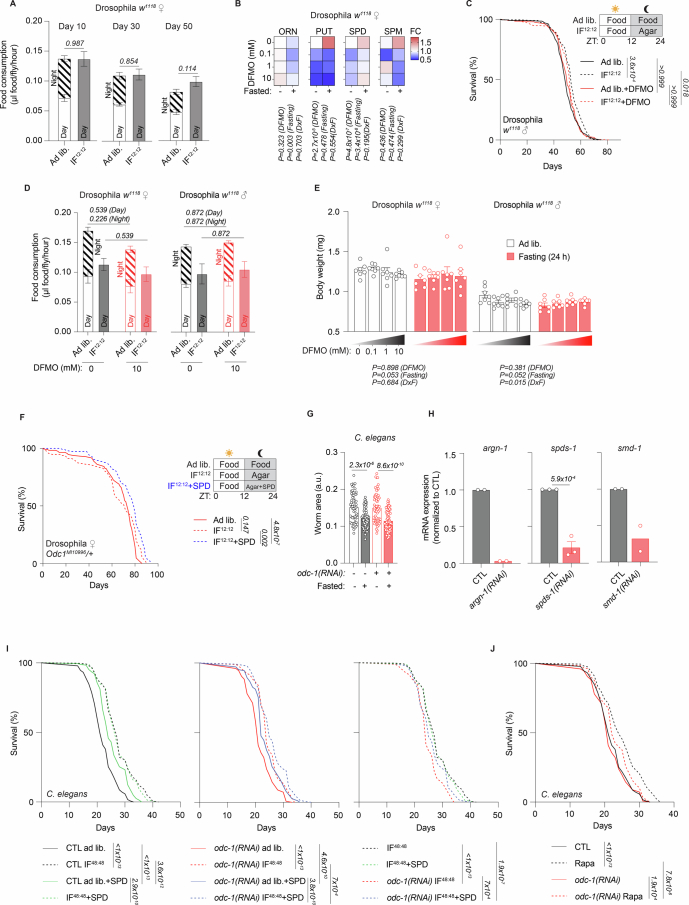
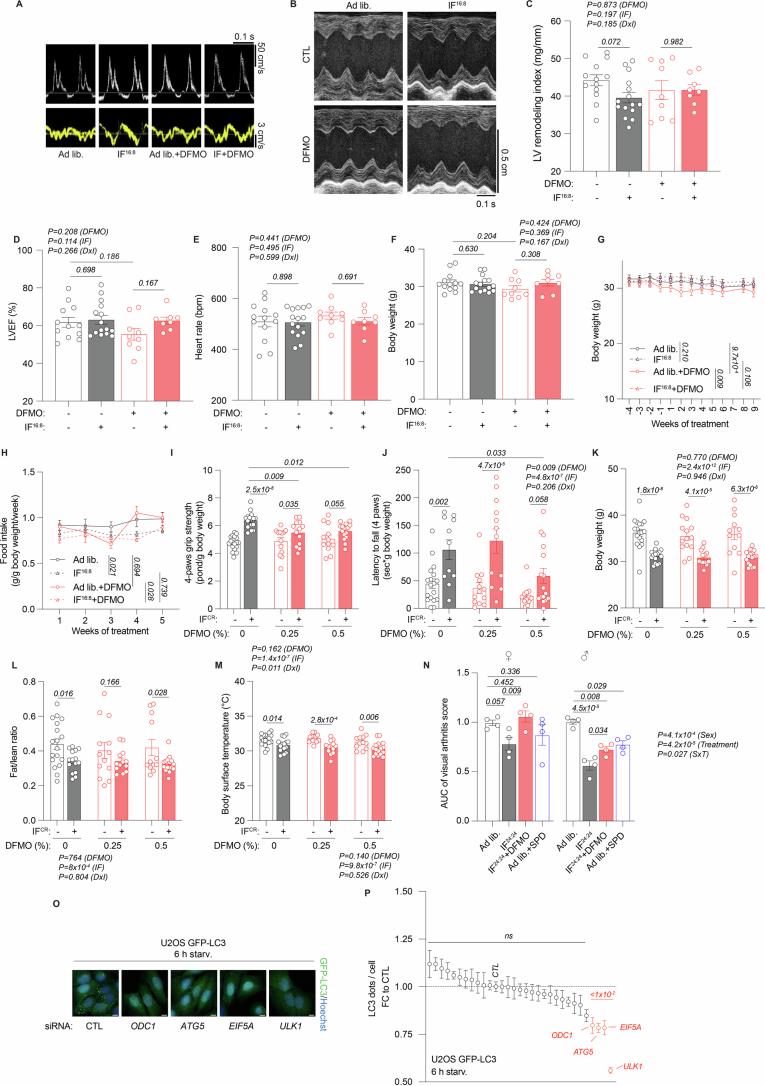
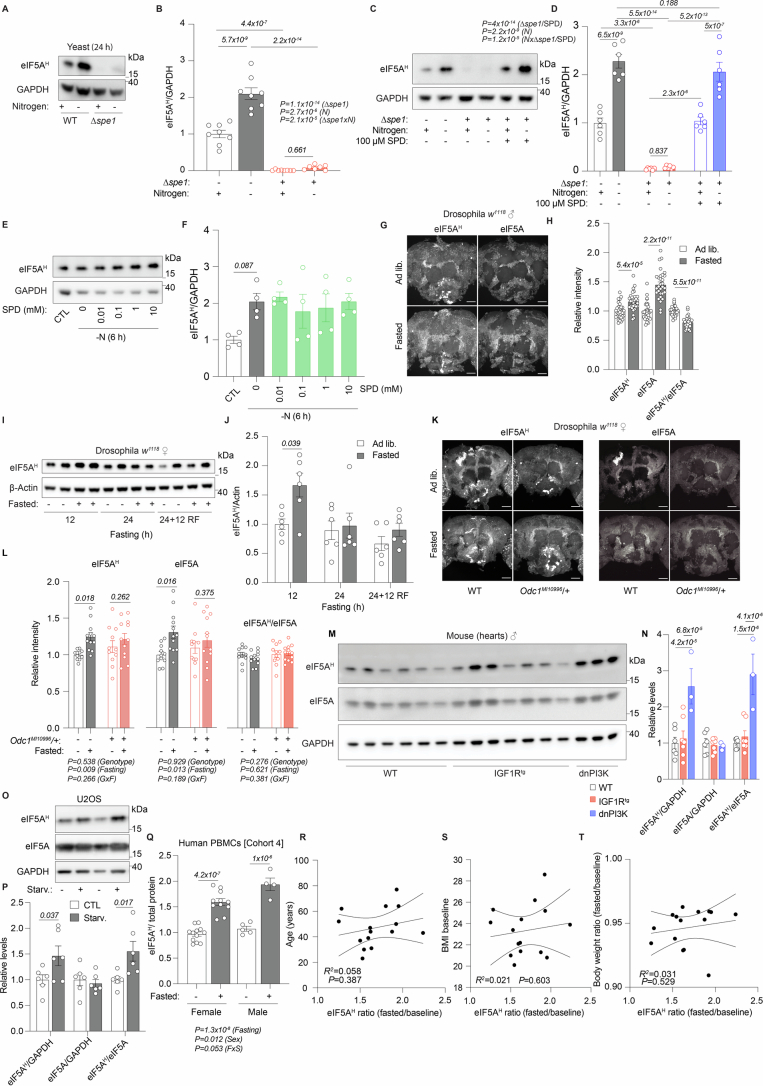
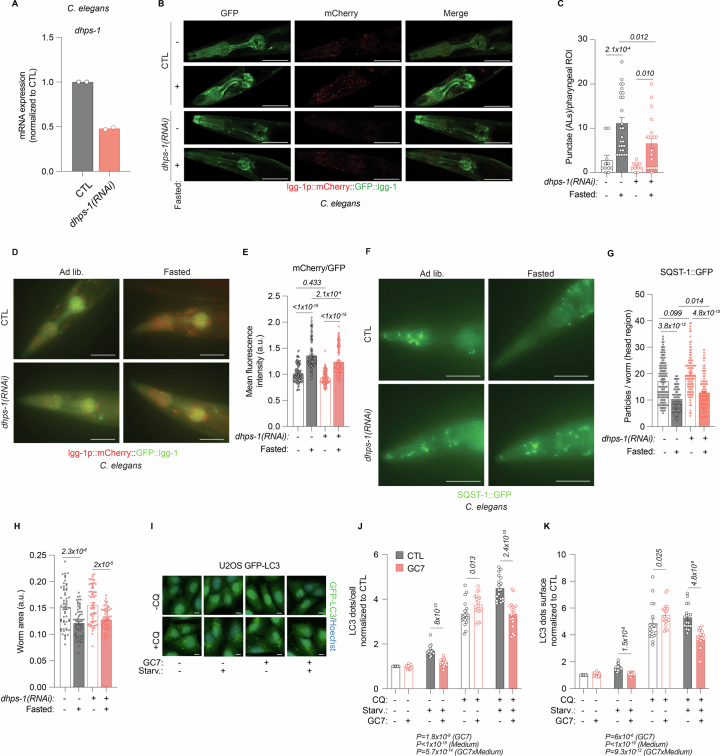
Caloric restriction and intermittent fasting prolong the lifespan and healthspan of model organisms and improve human health. The natural polyamine spermidine has been similarly linked to autophagy enhancement, geroprotection and reduced incidence of cardiovascular and neurodegenerative diseases across species borders. Here, we asked whether the cellular and physiological consequences of caloric restriction and fasting depend on polyamine metabolism. We report that spermidine levels increased upon distinct regimens of fasting or caloric restriction in yeast, flies, mice and human volunteers. Genetic or pharmacological blockade of endogenous spermidine synthesis reduced fasting-induced autophagy in yeast, nematodes and human cells. Furthermore, perturbing the polyamine pathway in vivo abrogated the lifespan- and healthspan-extending effects, as well as the cardioprotective and anti-arthritic consequences of fasting. Mechanistically, spermidine mediated these effects via autophagy induction and hypusination of the translation regulator eIF5A. In summary, the polyamine-hypusination axis emerges as a phylogenetically conserved metabolic control hub for fasting-mediated autophagy enhancement and longevity.


Conflict of interest statement

O.K., G.K. and F.M. are cofounders of Samsara Therapeutics, a company that develops novel pharmacological autophagy inducers. F.M. and T.E. have equity interests in and are advisors of The Longevity Labs. G.K. is a scientific co-founder of everImmune, Osasuna Therapeutics and Therafast Bio. G.K. has been holding research contracts with Daiichi Sankyo, Eleor, Kaleido, Lytix Pharma, PharmaMar, Osasuna Therapeutics, Samsara Therapeutics, Sanofi, Tollys and Vascage. G.K. is in the scientific advisory boards of Hevolution, Institut Servier and Rejuveron Life Sciences. F.G. and F.W.T. are employees of the Buchinger Wilhelmi Development und Holding, Überlingen. D.K., A.R.K. and A.M. are members of the steering committee of the Medical Association for Fasting and Nutrition (ÄGHE). D.K. and A.M. have also co-founded the Academy of Integrative Fasting, an institution for the qualification of medical staff in clinical fasting applications. D.K. serves as a consultant for a mobile application on intermittent fasting (FASTIC) as well as a company producing plant-based supplements (FENOU). A.M. is also a co-founder of the SALUFAST company and serves as a consultant for Lanserhof. All other authors declare no competing interests.

Figures

Fig. 1
Fig. 1. Fasting induces polyamine synthesis in various species.
a, Schematic overview of the polyamine pathway and adjacent metabolites. AdoMetDC, adenosylmethionine decarboxylase; ARG, arginase; MAT, methionine adenosyltransferase; ODC, ornithine decarboxylase; SAT, SPD/SPM acetyltransferase, SRM, spermidine synthase; SMOX, spermine oxidase; SMS, spermine synthase; PAO, polyamine oxidase. b, Polyamine levels of WT BY4741 yeast shifted to nitrogen-deprived medium (−N) for the indicated times. Data are normalized to the mean of the control (CTL) condition at every time point. Note that the statistics were performed together with additional groups as indicated in Supplementary Fig. 1a. n = 6 biologically independent samples (yeast cultures). c, WT BY4741 yeast cells were pre-labelled with 13C6-arginine [CTL(Arg*)] and shifted to CTL(Arg*) or −N medium for 6 h. MS-based analysis of labelled products revealed a uniform increase in percentage of labelled polyamines in N-starved cells. nd, not detected. n = 6 biologically independent samples (yeast cultures). d, Polyamine levels of young female w1118 flies fasted for 12 or 24 h (starting at 20:00 upon lights turned off). Data are normalized to the ad libitum (ad lib) group at every time point. Re-fed, 12 h re-feeding after 24 h fasting. n = 5 (re-fed, 24 h ad lib ORN), 6 (24 h ad lib PUT, SPD and SPM), 7 (rest) biologically independent samples (groups of flies). e, Serum polyamine levels of young male and female C57BL/6 mice fasted or kept ad lib for 14–16 h overnight, starting at 16:00–17:00). n = 5 (male), 8 (female) mice. f, Relative polyamine levels in human serum from cohort 1 after fasting (9 (7–13) days) depicted as mean with s.e.m. and violin plots, showing median and quartiles as lines. The extra panel depicts the individual increase in SPD levels for every volunteer. n = 104 (PUT), 109 (SPD baseline), 100 (SPM baseline), 105 (SPD fasted), 94 (SPM fasted) volunteers. g, Relative polyamine levels in human serum from cohort 2 after increasing numbers of fasting days. n = 61 (baseline PUT), 62 (baseline ORN and SPD), 22 (4–5 d PUT and SPD), 25 (4–5 d ORN, 6–8 d ORN), 19 (6–8 d PUT), 20 (6–8 d SPD), 9 (9–16 d PUT and SPD), 13 (9–16 d ORN) volunteers. h, Relative polyamine and precursor levels in human serum and PBMCs from cohort 4 after increasing numbers of fasting days. BL, baseline, RF = days 3 or 7 after re-introduction of food. N (serum) = 7 (BL SAM), 11 (3 d SAM), 12 (7d RF SAM), 13 (5d SAM), 14 (BL PUT and SPD), 15 (BL ARG and MET; 5 d ARG; 3d RF SAM), 16 (BL ORN; 5 d MET, ORN, PUT and SPD), 17 (3 d ARG, MET, ORN, PUT and SPD; 7 d RF ARG, MET, ORN, PUT and SPD), 18 (3 d RF ARG, MET, ORN, PUT and SPD) volunteers. N (PBMCs) = 6 (5 d ORN), 7 (5 d rest), 9 (BL SPD), 10 (BL rest), 11 (3 d RF SPD) 12 (3 d SPD and SPM; 3 d RF rest), 13 (3 d rest; 7 d RF) volunteers. Statistics used were two-way analysis of variance (ANOVA) with Holm-Šídák’s multiple comparisons test (b,d,f,h) and two-tailed Student’s t-tests (c). For every analyte (e) two-way ANOVA with false discovery rate (FDR) correction (two-stage step-up method by Benjamini, Krieger and Yekutieli, Q = 0.05) together with data depicted in Extended Data Fig. 1f–i (male) and Extended Data Fig. 1k–n (female). Wilcoxon matched-pairs signed rank test (f). Kruskal–Wallis test with Dunn’s multiple comparison test (g). FC, fold change to control. Heatmaps show means. Bar and line graphs show mean ± s.e.m. *P < 0.05, **P < 0.01, ***P < 0.001, #P < 0.2. Source numerical data are available in source data. Source data
Fig. 2
Fig. 2. Spermidine synthesis is required for the cellular adaptation to starvation.
a, Relative SPD levels of WT and ∆spe1 yeast cells after SPD treatment (100 µM) and N starvation. n = 6 biologically independent samples (yeast cultures). b, PCA depicting the proteome change in WT and Δspe1 cells under specified condition treatments following a 6-h culture in control or −N medium with or without 100 µM SPD. PCA was performed on a singular-value decomposition of centred and scaled protein groups (n = 4,684) displays a comparison between PC1 and PC2, along with the representation of a 95% confidence interval for each group. n = 6 biologically independent samples (yeast cultures). c, Differential expression (z-score) of proteins involved in the TORC complex, from the proteome analysis shown in b. n = 6 biologically independent samples (yeast cultures). d, Volcano plot showing significantly different intracellular metabolites in WT or ∆spe1 after 6 h −N compared with control conditions. Venn diagram showing exclusive and overlapping significantly regulated metabolites. FDR-corrected P value < 0.05, FC > 1.5. n = 4 biologically independent samples (yeast cultures). e, Metabolomic disturbances in ∆spe1 cells are rescued by SPD (100 µM) supplementation. The PCA displays a comparison between PC1 and PC2, along with the representation of a 95% confidence interval for each group. n = 6 biologically independent samples (yeast cultures). f, SPD (100 µM) corrects ∆spe1-associated amino acid disturbances. Relative arginine and serine levels from metabolomics analysis shown in e. n = 6 biologically independent samples (yeast cultures). Statistics were two-way ANOVA with Holm-Šídák’s multiple comparisons test (a,f) and two-tailed Student’s t-tests with FDR correction (d). Bar graphs show the mean ± s.e.m. Source numerical data are available in source data. Source data
Fig. 3
Fig. 3. Autophagy induction is blunted by lack of polyamine synthesis.
a, Decrease of TORC1 activity as inferred by Sch9-phosphorylation during -N in WT and ∆spe1 cells. Representative immunoblot. b, Quantification of immunoblots as shown in a. n = 3 biologically independent samples (yeast cultures). c, Polyamine supplementation (100 µM) corrects the delayed decrease of TORC1 activity during −N in ∆spe1 cells. Representative immunoblot. d, Quantification of immunoblots as shown in c. n = 4 biologically independent samples (yeast cultures). e, Supplementation of high SPD levels (5 mM) corrects the delayed decrease of TORC1 activity in ∆spe1 cells but does not affect TORC1 activity in WT cells. Representative immunoblot. f, Quantification of immunoblots as shown in e. n = 4 biologically independent samples (yeast cultures). g, SPD supplementation (100 µM) corrects decreased Atg7 protein levels ∆spe1 cells in both control and −N medium, as detected in proteome analysis shown in Fig. 2b. n = 6 biologically independent samples (yeast cultures). h, Representative immunoblots of yeast WT and ∆spe1 GFP-Atg8 cells after 6 h −N with and without 100 µM SPD, assessed for GFP and GAPDH. i, Quantifications of h. n = 6 biologically independent samples (yeast cultures). j, ALP activity (RFU per µg) from Pho8∆N60 assay normalized to each CTL group after 6 h −N. n = 10 (WT CTL, ∆spe1 CTL), 11 (WT -N), 8 (∆spe1 −N) biologically independent samples (yeast cultures). k, Representative immunoblots of yeast WT and ∆spe1 GFP-Atg8 after 6 h −N, with or without ascending concentrations of SPD, assessed for GFP and GAPDH. l, Quantifications of k. n = 6 biologically independent samples (yeast cultures). m, Representative images of human U2OS GFP-LC3 cells starved for 6 h in Hanks’ balanced salt solution (HBSS) (with or without chloroquine (CQ) for 3 h before fixation) after 3 days of 100 µM DFMO treatment. For quantifications see also Extended Data Fig. 5c. Scale bar, 10 µm. n, Quantification of cytosolic GFP-LC3 dots from l, normalized to the average number of GFP-LC3 dots in the control condition. n = 6 biologically independent experiments. o, Representative images of the head region of young control and odc-1(RNAi) C.elegans MAH215 (sqIs11 [lgg-1p::mCherry::GFP::lgg-1 + rol-6]) (LGG-1 is the C.elegans orthologue of LC3) fasted for two days. Autolysosomes (ALs) appear as mCherry-positive puncta. Autophagic activity is indicated by a shift to the red spectrum due to fluorescence quenching of the pH-sensitive-GFP by the acidic environment of the autolysosome. Scale bar, 50 μm. p, Quantification of ALs as depicted in o. Note that the statistics were performed together with additional groups as indicated in Extended Data Fig. 10c. n = 11 (CTL ad lib), 26 (CTL fasted), 8 (Odc-1(RNAi) ad lib), 30 (Odc-1(RNAi) fasted) worms. Statistics used were two-way ANOVA with Holm-Šídák’s multiple comparisons test (b,d,f,g,h,j,n), one-way ANOVA with Holm-Šídák’s multiple comparisons test (l) and Kruskal–Wallis test with FDR correction (two-stage step-up method by Benjamini, Krieger and Yekutieli, Q = 0.05) (p). Bar graphs show the mean ± s.e.m. Source numerical data and unprocessed blots are available in source data. NS, not significant. Source data
Fig. 4
Fig. 4. Intermittent fasting-mediated lifespan extension depends on SPD synthesis.
a, Representative microscopy images on day 5 of chronological lifespan experiments of yeast WT and ∆spe1 in control and −N medium, stained with propidium iodide (PI). Scale bar, 5 µm. b, PI-negative (live) cells during chronological aging of yeast WT and ∆spe1 in control and −N medium. n = 36 (WT), 26 (∆spe1 CTL), 24 (∆spe1 −N) biologically independent samples (yeast cultures). c, PI-negative (live) cells during chronological aging yeast WT and ∆spe2, ∆spe3 and ∆spe4 cells grown to the log phase and shifted to CTL or −N. n = 8 biologically independent samples (yeast cultures). d, Lifespan of female w1118 flies fed standard food with or without 10 mM DFMO and subjected to IF12:12. n = 315 (ad lib), 313 (IF), 327 (ad lib + DFMO), 348 (IF + DFMO) flies. e, Flies from d were assessed for their climbing ability, measured as covered walking distance after a negative geotaxis stimulus, between days 53–60. n = 11 biologically independent samples. f, Flies from d were assessed for their climbing ability, measured as speed after a negative geotaxis stimulus, between days 53–60. n = 11 biologically independent samples. g, Lifespan of C.elegans N2 fed control (CTL) or odc-1(RNAi) expressing bacteria during IF48:48. The worms were transferred every other day. IF groups were transferred to agar plates without bacteria every second day. Note that the statistics and experiments were performed together with the groups depicted in i and Fig. 6p. n = 913 (CTL ad lib), 750 (CTL IF), 794 (odc-1(RNAi) ad lib), 779 (odc-1(RNAi) IF) worms. h, The susceptibility of worms to heat stress is reduced by IF48:48 in control, but not in worms fed odc-1(RNAi) expressing bacteria. Young worms (after the first round of fasting) were placed at 37 °C for 6 h. Survival was assessed after overnight recovery at 20 °C. n = 5 biologically independent experiments. i, Lifespan of C.elegans N2 fed bacteria expression control (CTL) or RNAi against argn-1, spds-1 or smd-1 during IF48:48. Note that the experiments and statistics were performed together with the groups depicted in g and Fig. 6p. n = 913 (CTL ad lib), 750 (CTL IF), 899 (argn-1(RNAi) ad lib), 797 (argn-1(RNAi) IF), 820 (smd-1(RNAi) ad lib), 803 (smd-1(RNAi) IF), 881 (spds-1(RNAi) ad lib), 746 (spds-1(RNAi) IF) worms. Statistics used were two-way ANOVA with Holm-Šídák’s multiple comparisons test (b,c,e,f,h) and log-rank test with Bonferroni correction (d,g,i). Bar graphs show the mean ± s.e.m. Source numerical data are available in source data. AUC, area under the curve. Source data
Fig. 5
Fig. 5. DFMO blunts the healthspan-promoting effects of IF in mice.
a, Experimental layout to study the effects of DFMO feeding on IF16:8-mediated cardioprotection in 17–18-month-old male C57BL/6J mice. Mice were fasted from 15:00 to 7:00 (16 h daily, excluding weekends). A subset of aged mice received DFMO in the drinking water. After 10 weeks, cardiac function and structure were assessed by echocardiography. Data are shown in b,c, Extended Data Fig. 8a–h and Supplementary Table 3. b, Ratio of peak early Doppler transmitral flow velocity (E) to myocardial tissue Doppler velocity (e′), a measure of diastolic dysfunction, in aged male mice treated with IF16:8, with or without DFMO (n = 13, 15, 9 and 8 mice per group, respectively). c, LV mass normalized to body surface area (LV massi). n = 13 (ad lib), 15 (IF), 9 (ad lib + DFMO), 8 (IF + DFMO) mice. d, Experimental layout to study the effects of DFMO feeding on IFCR-mediated healthspan improvements in 20-month-old male C57BL/6J mice. Mice were given a single meal per day (30% CR) shortly before the dark phase. A subset of mice received 0.25% or 0.5% DFMO in the drinking water. After 3 months, healthspan was assessed. Data are shown in e,f and Extended Data Fig. 8i–m. e, Visual frailty index of aged male mice treated with IFCR, with or without DFMO. n = 12 (ad lib 0.5%), 13 (IF 0.25%), 14 (ad lib 0.25%), 15 (IF 0%), 16 (IF 0.5%), 18 (ad lib 0%) mice. f, Grip strength of fore limbs in gram-force (gf) normalized to body weight of aged male mice treated with IFCR, with or without DFMO. n = 12 (ad lib 0.5%), 13 (IF 0.25%), 14 (ad lib 0.25%), 15 (IF 0%), 16 (IF 0.5%), 18 (ad lib 0%) mice. g, Experimental layout to study the effects of DFMO feeding on IF-mediated anti-inflammatory effects in young BALB/cJRj mice of both sexes. DFMO and 3 mM SPD were supplemented via drinking water. Mice were fasted every other day. IF24:24 and SPD treatments were started 3 weeks before serum transfer and continued until the end of the experiment. Data are shown in h,i and Extended Data Fig. 8n. h, Development of arthritis upon injection of serum from K/BxN mice in young male and female BALB/cJRj mice treated as outlined in g. n = 8 mice. i, AUC analysis of h. n = 8 mice. Statistics used were two-way ANOVA with Holm-Šídák’s multiple comparisons test (b,c,e,f), log-rank test with Bonferroni correction (c,e) and one-way ANOVA with Holm-Šídák’s multiple comparisons test (i). Bar graphs show the mean ± s.e.m. M, months of age. Source numerical data are available in source data. Source data
Fig. 6
Fig. 6. Hypusination of eIF5A acts downstream of spermidine to mediate IF-associated longevity.
a, Scheme of the hypusination pathway. DHS, deoxyhypusine synthase; DOHH, deoxyhypusine hydroxylase; eIF5A, eukaryotic translation initiation factor 5A-1. b, Representative immunoblot of hypusinated eIF5A (eIF5AH) levels in yeast GFP-Atg8 WT and ∆spe1 after 6 h of −N. c, Quantification of b. n = 8(WT), 7(∆spe1) biologically independent samples (yeast cultures). d, Representative maximum projection images of confocal microscopy images of female w1118 fly central brain regions probed for eIF5A and hypusine by immunofluorescence. Before dissection, the flies were fasted for 0 h (ad lib) or 12 h, starting at 20:00. Scale bar, 50 µm. e, Quantification of signal intensities in d. n = 22 (ad lib), 23 (fasted) fly brains. f, Immunoblots of 48 h fasted C.elegans assessed for hypusine and GAPDH. g, Quantification of f. n = 4 biologically independent samples (worm lysates). h, Representative immunoblot of eIF5AH, eIF5A and GAPDH signals of liver samples from ad lib and fasted (14–16 h) young, male C57BL/6 mice. i, Quantification of h. n = 7 mice. j, eIF5AH and total eIF5A levels in human PBMCs after increasing fasting times, measured by capillary immunoblotting. RF, 3 days after re-introduction of food. n = 17 (days 0, 1 and 3), 15 (day 5), 16 (day 7 and RF) volunteers. k, Representative immunoblot of yeast Lia1-6xHA, assessed for HA-tags and GAPDH after 6 and 24 h −N. l, Quantification of Lia1-6xHA levels as depicted in k. n = 8 biologically independent samples (yeast cultures). m, Quantification of relative mRNA expression of dhps-1, dohh-1 and iff-1 in 24 h fasted C.elegans. n = 3 (iff-1), 5 (dhps-1 and dohh-1) biologically independent experiments. n, Quantification of relative mRNA expression of DHPS, DOHH and EIF5A in 6 h starved U2OS cells. n = 3 (DOHH), 4 (DHPS and EIF5A) biologically independent experiments. o, PI-negative (live) yeast cells during chronological lifespan analysis of WT and ∆lia1 yeast in control and −N medium. n = 12 biologically independent samples (yeast cultures). p, Lifespan of C.elegans N2 fed control (CTL) or dhps-1(RNAi) (homologue of DHS) expressing bacteria during IF48:48. Note that the experiments and statistics were performed together with the groups depicted in Fig. 4g,i. n = 913 (CTL ad lib), 750 (CTL IF), 862 (dhps-1(RNAi) ad lib), 776 (dhps-1(RNAi) IF) worms. Statistics used were two-way ANOVA with Holm-Šídák’s multiple comparisons test (c,j,l,o), two-tailed Student’s t-tests with Holm-Šídák’s multiple comparisons test (e,i,m,n), two-tailed Student’s t-test (h) and log-rank test with Bonferroni correction (p). Bar and line graphs show the mean ± s.e.m. Source numerical data and unprocessed blots are available in source data. Source data
Extended Data Fig. 1
Extended Data Fig. 1. Changes in polyamine levels in starving organisms.
(a) Polyamine levels of WT BY4741 yeast shifted to water for the indicated times. Data normalized to the mean of the control group at every time point. N = 5 biologically independent samples (yeast cultures). (b) Polyamine levels of glucose-restricted WT BY4741 after the indicated times. Data normalized to the mean of the control group at every time point. N = 5 biologically independent samples (yeast cultures). (c) Polyamine levels of young male w1118 flies fasted for 12 or 24 hours (starting at 20:00). Data normalized to the ad libitum group at every time point. Refed = 12 hours refeeding after 24 hours of fasting. N = 7 biologically independent samples (groups of flies). (d) Changes in body weight of young female and male w1118 flies fasted or kept ad lib for the indicated times, starting at 20:00. Data normalized to each ad lib group. P values against each sex’s ad lib group. Refed = 12 hours refeeding after 24 hours of fasting. N = 5(Refed female fasted), 6(24 h female ad lib; Refed female ad lib; Refed male ad lib), 7(12 h, 24 h female fasted; 12 h, 24 h male; Refed male fasted) biologically independent samples (groups of flies). (e) Changes in body weight of young male C57BL/6 mice fasted or kept ad lib for 14-16 hours overnight. N = 6 mice. (f-i) Relative polyamine levels of young male C57BL/6 mice fasted or kept ad lib for 14-16 hours overnight. BAT = brown adipose tissue, WAT = white adipose tissue. FC = fold change to means of ad lib N = 3(ORN Hippocampus; PUT Muscle fasted), 4(PUT WAT fasted), 5(rest) mice. (j) Changes in body weight of young female C57BL/6 mice fasted or kept ad lib for 14-16 hours overnight. N = 8 mice. (k-n) Relative polyamine levels of young female C57BL/6 mice fasted or kept ad lib for 14-16 hours overnight. BAT = brown adipose tissue, WAT = white adipose tissue. FC = fold change to means of ad lib. N = 7(ORN Heart ad lib), 8(rest) mice. (o-q) Relative polyamine levels of male and female C57BL/6 mice kept ad lib or calorie-restricted (30 %), starting at 9 months of age, until the age of 17 or 21 months. (o) N = 4(Fasted Spleen), 6(Fasted Kidney, Serum, Heart; SPM Fasted Liver), 7(Ad lib Spleen; Fasted Muscle, Liver rest), 8(Ad lib Kidney, Liver), 10(Ad lib Serum), 11(Ad lib Heart, Muscle) mice. (p) N = 3(CR Serum SPM), 4(CR Liver, Serum rest), 5(CR Kidney, Spleen), 6(Ad lib Serum; CR Heart, Muscle), 7(), 8(Ad lib Liver, Muscle), 9(Ad lib Kidney, Heart, Spleen) mice. (q)N = 3(Ad lib Liver), 4(Ad lib Kidney, Spleen), 6(Ad lib Serum, Heart, Muscle; CR Kidney, Spleen), 7(CR Heart, Muscle), 8(CR Liver, Serum) mice. (r-s) Polyamine levels in HBSS-starved human U2OS and H4 cells. N = 4 biologically independent samples. (t) Relative mRNA expression levels of polyamine-relevant genes in 6 hours starved U2OS cells. N = 3(ARG1, OAZ1, ODC1, SAT1, ATP13A2, ATP13A3, MYC, YAP, TAZ), 4(SRM, SMS, PAOX, MAT2A, AMD1, GNMT) biologically independent samples. (u) Serum SPD levels after fasting in cohort 1, stratified by sex, depicted as mean with S.E.M and violin plots, showing median and quartiles as lines. N = 67(female), 38(male). (v-x) Serum SPD levels after fasting in cohort 1 do not correlate with age, pre-fasting baseline body mass index (BMI) or body weight loss (body weight ratio). N = 99(Body weight ratio), 102(BMI), 105(Age) volunteers. (y) Relative SPD levels in human plasma from cohort 3 during IF. N = 22(12 h), 23(36 h) volunteers. (z) ODC1 protein levels in human PBMCs after increasing fasting times, measured by capillary electrophoresis. Refeeding = day 3 after re-introduction of food. N = 15(5 d), 16(3d RF), 17(rest) volunteers. Statistics: [A-D,R-S,U,Z] Two-way ANOVA with Holm-Šídák’s multiple comparisons test. [E,J,T] Two-tailed Student’s t-tests. [F-I, K-Q] Two-way ANOVA with FDR correction (Two-stage step-up method by Benjamini, Krieger and Yekutieli, Q = 0.05). [Y] Two-tailed Student’s t-test. [V-X] Simple linear regression analysis. Bar and line graphs show the mean ± s.e.m. Heatmaps show means. * P < 0.05, ** P < 0.01, *** P < 0.001, # P < 0.2. Source numerical data are available in source data. Source data
Extended Data Fig. 2
Extended Data Fig. 2. Spermidine supplementation corrects metabolome disturbances in ∆spe1 yeast cells.
(a, b) Heatmap (group means) and PCA of S. cerevisiae WT and ∆spe1 metabolomes after 6 hours -N, with or without 100 µM SPD. Unassigned NMR signals are labelled according to their NMR chemical shift. N = 6 biologically independent samples (yeast cultures). (c) Volcano plot showing significantly different metabolites in ∆spe1 after 6 hours -N, with or without 100 µM SPD. Two-tailed Student’s t-tests with FDR-corrected P values < 0.05, FC (fold change) >1.2. N = 6 biologically independent samples (yeast cultures). (d) Metabolite set enrichment analysis based on KEGG pathways of significantly different metabolites from [C] (raw P-values < 0.2). (e) Selected metabolites from [A], focusing on amino acid metabolism and the TCA cycle. N = 6 biologically independent samples (yeast cultures). Statistics: [E] Two-way ANOVA with Holm-Šídák’s multiple comparisons test. Bar graphs show the mean ± S.E.M. Asterisks indicate raw P-values. *<0.05, **<0.01, ***<0.001. Source numerical data are available in source data. Source data
Extended Data Fig. 3
Extended Data Fig. 3. Spermidine is required for the correct shutdown of TORC1 and autophagy regulation in N-starving yeast.
(a) Proteome change in S. cerevisiae WT BY4741 and Δspe1 strains under specified condition treatments following a 6-hour culture in control or -N media with or without 100 µM SPD supplementation. Differential expression (Z-score) of proteins involved in the TORC complex, from the proteome analysis. N = 6 biologically independent samples (yeast cultures). (b) Polyamine levels of WT BY472 treated with rapamycin (40 nM) for the indicated times. Data normalized to the mean of the DMSO control group at every time point. N = 5 biologically independent samples (yeast cultures). (c) Polyamine and precursor levels in cardiac tissue of young, male control, transgenic IGF1tg or dnPI3K mice. N = 5(WT), 8(IGF1Rtg), 11(dnPI3K) mice. (d) Yeast WT and Δspe1 strains under specified condition treatments following a 6-hour culture in control or -N media with or without 100 µM SPD. Differential expression (Z-Score) of proteins involved in autophagy, from the proteome analysis in Supplementary Fig. 1c. N = 6 biologically independent samples (yeast cultures). (e) Differential regulation of autophagy-relevant proteins in ∆spe1 cells. The averaged log2-transformed fold change (FC) of individual proteins (-N compared to control medium) was calculated for all conditions. The graph depicts the differences of these log2(FC) between ∆spe1 and WT cells (red triangles), as well as ∆spe1 treated with 100 µM SPD and WT cells (blue dots). nd=not detected. N = 6 biologically independent samples (yeast cultures). (f) Z-scores of the top 20 dysregulated proteins, as identified in [E]. N = 6 biologically independent samples (yeast cultures). Statistics: [A,B,F] Two-way ANOVA with Holm-Šídák’s multiple comparisons test. [C] Two-way ANOVA with FDR correction (Two-stage step-up method by Benjamini, Krieger and Yekutieli, Q = 0.05). Heatmaps show means. Bar and line graphs show the mean ± s.e.m. * P < 0.05, ** P < 0.01, *** P < 0.001, # P < 0.2. Source numerical data are available in source data. Source data
Extended Data Fig. 4
Extended Data Fig. 4. SPE1, the yeast ODC1 homologue, is required for starvation- and rapamycin-induced autophagy.
(a) Representative immunoblots of yeast WT and ∆spe1 GFP-Atg8 after 6 hours -N, assessed for GFP and GAPDH. (b) Quantifications of [B]. N = 7(∆spe1 -N), 8 (rest) biologically independent samples (yeast cultures). (c) Representative immunoblots of yeast WT and ∆spe1 GFP-Atg8 after 24 hours -N, assessed for GFP and GAPDH. (d) Quantifications of [C]. N = 7(∆spe1 -N), 8(rest) biologically independent samples (yeast cultures). (e) Representative images of the categories used for categorization of GFP-Atg8 signals as shown and quantified in [F-G]. DIC = differential interference contrast, PI = propidium iodide staining for dead cells. (f) Representative images of yeast WT and ∆spe1 GFP-Atg8 cells 6 hours after -N. Scale bar = 5 µm. (g) Blinded manual quantification of the autophagic status in microscopy images of WT and ∆spe1 GFP-Atg8 cells 6 hours after -N. N = 6 biologically independent samples (yeast cultures). (h) ALP activity (RFU/µg) from Pho8∆N60 assay normalized to each CTL group after 24 hours -N. N = 7(WT), 6(∆spe1) biologically independent samples (yeast cultures). (i) Representative immunoblots of yeast WT and ∆spe1 GFP-Atg8 after 6 hours rapamycin treatment (40 nM), assessed for GFP and GAPDH. (j) Quantifications of [I]. N = 12 biologically independent samples (yeast cultures). (k) Representative images of yeast WT and ∆spe1 GFP-Atg8 cells 6 hours after rapamycin (40 nM) treatment. Scale bar = 5 µm. (l) Blinded manual quantification of the autophagic status in microscopy images of WT and ∆spe1 GFP-Atg8 cells 6 hours after rapamycin (40 nM) treatment. N = 6 biologically independent samples (yeast cultures). (m) Representative immunoblots of yeast WT BY4742 and ∆spe1 GFP-Atg8 after 6 hours rapamycin treatment (40 nM), with and without 100 µM SPD, assessed for GFP and GAPDH. (n) Quantifications of [M]. N = 6 biologically independent samples (yeast cultures). Statistics: Two-way ANOVA with Holm-Šídák’s multiple comparisons test. Bar graphs show the mean ± s.e.m. Source numerical data and unprocessed blots are available in source data. Source data
Extended Data Fig. 5
Extended Data Fig. 5. ODC1 is required for starvation-induced autophagy in H4 and U2OS cells.
(a) DFMO treatment (48 hours, 100 µM) affects the polyamine profile of H4 and U2OS cells in vitro. Polyamine levels normalized to cell line-specific control (0 µM DFMO). N = 5(H4 0, 100 µM DFMO), 4(rest) biologically independent samples. (b) SPD levels in DFMO-treated (48 hours, 100 µM) U2OS and H4 cells after 6 hours starvation. N = 6 biologically independent samples. (c) Quantification of surface area covered by GFP-LC3 dots in 6 hours starved U2OS GFP-LC3 cells treated with or without 100 µM DFMO for 3 days, as depicted in Fig. 3m, normalized to the control condition. N = 6 biologically independent experiments. (d) Representative images of human H4 GFP-LC3 cells starved for 3 hours in HBSS (with or without chloroquine [CQ] for 1.5 hours before fixation) after three days of 100 µM DFMO treatment. Scale bar = 10 µm. (e, f) Quantification of cytosolic GFP-LC3 dots and surface area covered by GFP-LC3 dots from [D], normalized to the control condition. N = 6 biologically independent experiments. (g) SPD levels in U2OS cells treated with DFMO (100 µM) and SPD (10 µM) after 6 hours of starvation. Aminoguanidine (1 mM) was added to all conditions. N = 6 biologically independent samples. (h-j) Representative images and quantifications of human U2OS GFP-LC3 cells starved for 6 hours in HBSS (with or without chloroquine [CQ] for 3 hours before fixation) after three days of 100 µM DFMO treatment in combination with or without 10 µM SPD. Aminoguanidine (1 mM) was added to all conditions. Scale bar = 10 µm. N = 12 biologically independent experiments. (k-m) Representative images and quantifications of human H4 GFP-LC3 cells starved for 3 hours in HBSS (with or without CQ for 1.5 hours before fixation) after three days of 100 µM DFMO treatment in combination with or without 10 µM SPD. Aminoguanidine (1 mM) was added to all conditions. Bar = 10 µm. N = 12 biologically independent experiments. (n) Polyamine levels are depleted 48 hours after ODC1 knockdown via siRNAs in U2OS cells. N = 4 biologically independent samples. (o-q) Representative images and quantifications of human U2OS GFP-LC3 cells starved for 6 hours in HBSS (with or without CQ for 3 hours before fixation) after three days of ODC1 knockdown. Scale bar = 10 µm. N = 8 biologically independent experiments. (r, s) Representative images and quantifications of human U2OS GFP-LC3 cells starved for 6 hours in HBSS or treated with Rapamycin (10 µM) or Torin-1 (300 nM). SPD was added in ascending concentrations to test for synergistic effects with starvation. AG = aminoguanidine (1 mM). N = 4(Starv.+AG + 1.25, 2.5, 320, 640, 1280 µM SPD), 8(Starv.+AG; Starv+AG + 5-160 µM SPD), 16(Rapa, Torin-1, BafA1), 32(CTL) biologically independent samples. Statistics: [A-C,E-G,I-J,L-N,P-Q] Two-way ANOVA with Holm-Šídák’s multiple comparisons test. [S] One-way ANOVA with Holm-Šídák’s multiple comparisons test Heatmaps show means. Bar graphs show the mean ± s.e.m. Source numerical data are available in source data. Source data
Extended Data Fig. 6
Extended Data Fig. 6. Fasting-induced autophagy in worms requires odc-1.
(a) Relative mRNA expression levels of polyamine-relevant genes in 24 hours fasted C. elegans. N = 4(hpo-15), 5(argn-1, smd-1, amx-3, d2023.4), 6(odc-1, spds-1) biologically independent experiments. (b) Knockdown efficiency of odc-1 mRNA by feeding bacteria expressing odc-1(RNAi) for 3 days in C. elegans. N = 3 biologically independent experiments. (c) Representative fluorescence images of the head region of young C. elegans MAH215 (sqIs11 [lgg-1p::mCherry::GFP::lgg-1 + rol-6]) fasted for two days and fed control or odc-1(RNAi) expressing bacteria. Autophagic activity is indicated by a shift to the red spectrum due to fluorescence quenching of the pH-sensitive-GFP by the acidic environment of the autolysosome. Scale bar = 50 μm. (d) Quantification of the ratio of the mean fluorescence intensity of mCherry/GFP signals, as depicted in [C]. Note that the experiment and statistics were performed together with the dhps-1(RNAi) groups in Extended Data Fig. 10e. N = 121(CTL ad lib), 127(CTL fasted), 113(Odc-1(RNAi) ad lib), 125(Odc-1(RNAi) fasted) worms. (e) Representative fluorescence images of the head region of young C. elegans SQST-1::GFP fasted for two days and fed control or odc-1(RNAi). Autophagic activity is indicated by a decrease in the number of GFP-positive particles. Scale bar = 50 μm. (f) Quantification of the SQST-1::GFP particles in the head region, as depicted in [E]. Note that the experiment and statistics were performed together with the dhps-1(RNAi) groups in Extended Data Fig. 10g. N = 133(CTL ad lib), 86(CTL fasted), 109(odc-1(RNAi) ad lib), 86(odc-1(RNAi) fasted) worms. (g) Representative images of the head region of young C. elegans MAH215 (sqIs11 [lgg-1p::mCherry::GFP::lgg-1 + rol-6]) fasted for two days and fed control or odc-1(RNAi) with and without 0.2 mM SPD. Autolysosomes (ALs) appear as mCherry-positive puncta. Scale bar = 50 μm. (h) Quantification of ALs as depicted in [G]. N = 63(CTL), 42(CTL fasted), 52(CTL + SPD), 54(odc-1(RNAi)), 48(odc-1(RNAi) fasted), 50(odc-1(RNAi)+SPD, odc-1(RNAi)+SPD fasted) worms. (i) Representative images of the head region of young C. elegans MAH215 (sqIs11 [lgg-1p::mCherry::GFP::lgg-1 + rol-6]) with or without 50 µM rapamycin and fed control or odc-1(RNAi). Autolysosomes (ALs) appear as mCherry-positive puncta. Scale bar = 50 μm. (j) Quantification of ALs as depicted in [I]. N = 63(CTL), 62(CTL+Rapa), 54(odc-1(RNAi)), 53(odc-1(RNAi)+Rapa) worms. Statistics: [A] Mann-Whitney with Holm-Šídák’s multiple comparisons test. [B] Two-tailed Student’s t-test. [D,F,H,J] Kruskal-Wallis test with Dunn’s multiple comparison test. Heatmaps show means. Bar graphs show the mean ± s.e.m. * P < 0.05, # P < 0.2. Source numerical data are available in source data. Source data
Extended Data Fig. 7
Extended Data Fig. 7. Polyamine synthesis is important for IF-induced benefits in flies and worms.
(a) Daily and nightly food consumption of D. melanogaster w1118 after 10, 30 and 50 days of IF12:12. N = 11(Day 30 IF Day), 12(Day 30 Ad lib), 16(Day 50 Ad lib Night), 18(Day 10), 20(Day 50 IF Day), 22(Day 50 Ad lib Day) biologically independent samples (groups of flies). (b) DFMO feeding affects the polyamine profile of female w1118 flies during ad lib and 24 hours fasting. N = 6(Ad lib 10 µM DFMO; Fasted 0, 10 µM DFMO), 7(Ad lib 0, 0.1, 1 µM DFMO; Fasted 0.1, 1 µM DFMO) biologically independent samples (groups of flies). (c) Lifespan of male w1118 flies fed standard food with or without 10 mM DFMO and subjected to IF. N = 210(Ad lib), 206(IF), 199(Ad lib+DFMO), 212(IF + DFMO) flies. (d) Food consumption of 10-day old female and male w1118 flies, fed control or food containing 10 mM DFMO, during the first 7 cycles of IF. N = 8(0 mM Day IF), 9(rest) biologically independent samples (groups of 5 flies per N). (e) DFMO feeding does not influence body weight changes after 24 hours fasting. N = 7 biologically independent samples (groups of flies). (f) Lifespan of heterozygous Odc1MI10996/+ flies subjected to IF. The IF + SPD group received 5 mM SPD via agar during the night. N = 119(Odc1MI10996/+ ad lib), 117(Odc1MI10996/+ IF), 113(Odc1MI10996/+ IF + SPD) worms. (g) Knockdown of odc-1 does not affect worm size under ad lib or IF48:48 conditions, compared to CTL RNAi. Note that the experiment and statistics were performed together with the dhps-1(RNAi) groups in Extended Data Fig. 10h. N = 56(CTL ad lib), 66(CTL IF), 63(Odc-1(RNAi) ad lib), 78(Odc-1(RNAi) IF) worms. (h) Knockdown efficiency of respective mRNAs by feeding bacteria expressing argn-1, spds-1, or smd-1 RNAi in C. elegans. N = 2(argn-1, smd-1), 3(spds-1) biologically independent experiments. (i) Lifespan of C. elegans N2 fed control (CTL) or RNAi against odc-1, with or without continuous 0.2 mM SPD feeding during IF. Note that the experiments and statistics were performed together with the groups depicted in [J]. N = 429(CTL ad lib), 523(CTL IF), 437(CTL ad lib+SPD),466(IF + SPD), 330(odc-1(RNAi) ad lib), 575(odc-1(RNAi) IF), 497(odc-1(RNAi) ad lib+SPD), 605(odc-1(RNAi) IF + SPD) worms. (j) Lifespan under 50 µM rapamycin treatment of C. elegans N2 fed control (CTL) or RNAi against odc-1. Note that the experiments and statistics were performed together with the groups depicted in [I]. N = 429(CTL), 423(Rapa), 330(odc-1(RNAi), 330(odc-1(RNAi) Rapa) worms. Statistics: [A,D] Two-tailed Student’s t-test (per time point). [B,E,G] Two-way ANOVA with Holm-Šídák’s multiple comparisons test. [F,I,J] Log-rank test with Bonferroni correction. [H] Two-tailed Student’s t-test. Heatmaps show means. Bar graphs show the mean ± s.e.m. Source numerical data are available in source data. Source data
Extended Data Fig. 8
Extended Data Fig. 8. Cardiac profiling by echocardiography of aging mice during IF, with and without DFMO.
(a) Representative echocardiography-derived mitral pulsed wave and tissue Doppler tracings in aged mice treated as outlined in Fig. 5a. (b) Representative echocardiography derived left ventricular (LV) M-mode tracings. (c) LV remodelling index. N = 13(Ad lib), 15(IF), 9(Ad lib + DFMO), 8(IF + DFMO) mice. (d) LV ejection fraction (LVEF). N = 12(Ad lib), 15(IF), 9(Ad lib + DFMO), 8(IF + DFMO) mice. (e) Heart rate. N = 13(Ad lib), 15(IF), 9(Ad lib + DFMO), 8(IF + DFMO) mice. (f) Body weight at the time of cardiac profiling. N = 13(Ad lib), 15(IF), 9(Ad lib + DFMO), 8(IF + DFMO) mice. (g) Body weight throughout the intervention. N = 15(Ad lib; Ad lib + DFMO),16(IF; IF + DFMO IF) mice (at week 0). (h) Food intake per mouse throughout the intervention. N = 3(Week 4 IF + DFMO), 4(rest) cages. (i) Grip strength (all limbs) normalized to body weight. N = 18(CTL ad lib), 15(CTL IF), 13(0.25% DFMO), 12(0.5% DFMO ad lib), 16(0.5% DFMO IF) mice. (j) Latency to fall in a 4-limb grid hanging test. N = 18(CTL ad lib), 11(CTL IF), 13(0.25% DFMO ad lib), 12(0.25% DFMO IF), 12(0.5% DFMO ad lib), 16(0.5% DFMO IF) mice. (k) Body weight. N = 18(CTL ad lib), 15(CTL IF), 14(0.25% DFMO ad lib), 13(0.25% DFMO IF), 12(0.5% DFMO ad lib), 16(0.5% DFMO IF) mice. (l) Fat-to-lean mass ratio. N = 18(CTL ad lib), 15(CTL IF), 13(0.25% DFMO), 12(0.5% DFMO ad lib), 16(0.5% DFMO IF) mice. (m) Abdominal surface temperature. N = 18(CTL ad lib), 15(CTL IF), 14(0.25% DFMO ad lib), 13(0.25% DFMO IF), 12(0.5% DFMO ad lib), 16(0.5% DFMO IF) mice. (n) Sex-stratified arthritis scoring of data presented in Fig. 5h-i upon injection of serum from K/BxN mice in young male and female BALB/cJRj mice treated as outlined in Fig. 5g. N = 4 mice. (o) Genes previously connected to the cellular effects of SPD were knocked out via siRNAs in U2OS GFP-LC3 cells and tested for starvation-induced autophagy. Selected representative images after 6 hours of starvation. (p) 48 hours after siRNA knockdown, U2OS GFP-LC3 cells were starved for 6 hours. The graph depicts the normalized individual FC to control conditions of GFP-LC3 dots for every gene knockdown or control condition (means ± S.E.M.). FC 1 represents the starvation-induced increase in GFP-LC3 dots in the control condition. Highlighted genes were significantly different from the control. N = 17(CTL), (Dharmafect control), 9(rest) biologically independent samples. Statistics: [C-N] Two-way ANOVA with Holm-Šídák’s multiple comparisons test. [P] One-way ANOVA with Holm-Šídák’s multiple comparisons test. Line graph shows the mean ± s.e.m. Bar and line graphs show the mean ± S.E.M. Source numerical data are available in source data. Source data
Extended Data Fig. 9
Extended Data Fig. 9. Fasting increases hypusination of eIF5A.
(a) Hypusine levels are increased after 24 hours -N in yeast BY4741 GFP-Atg8 cells, but not in ∆spe1. Representative immunoblot. (b) Quantification of [A]. N = 7(∆spe1 -N), 8(rest) biologically independent samples (yeast cultures). (c) Representative immunoblot of WT and ∆spe1, with and without 100 µM SPD after 6 hours -N, assessed for hypusine and GAPDH. (d) Quantification of [C]. N = 6 biologically independent samples (yeast cultures). (e) SPD supplementation does not further increase hypusination in BY4741 GFP-Atg8 yeast. Representative immunoblot. (f) Quantification of [E]. N = 4 biologically independent samples (yeast cultures). (g) Representative maximum projection images of confocal microscopy images of male w1118 fly central brain regions probed for eIF5A and hypusine by immunofluorescence. Prior to dissection, the flies were fasted for 0 (ad lib) or 12 hours, starting at 8 pm. Scale bar = 50 µm. (h) Quantification of signal intensities as shown in [G]. N = 30 fly brains. (i) Representative immunoblot of female Drosophila w1118 head extracts, assessed for hypusine and actin after 12 and 24 hours overnight fasting. RF = 12 hours refeeding. (j) Quantification of [I]. N = 6 biologically independent samples (fly head lysates). (k) Representative immunostaining microscopy images against hypusine after 12 hours fasting of female WT w1118 and Odc1MI10996/+ fly brains. Scale bar = 50 µm. (l) Quantification of [K]. N = 11(ad lib), 12(fasted) fly brains. (m) Immunoblots of cardiac tissue from young male transgenic IGF1Rtg or dnPI3K mice and their age-matched WT controls. Heart lysates were assessed for hypusine, total eIF5A and GAPDH. (n) Quantification of [M]. N = 6(WT), 7(IGF1Rtg), 3(dnPI3K) mice. (o) Representative immunoblot of human U2OS cells starved for 6 hours and assessed for hypusine, total eIF5A and GAPDH. (p) Quantification of [O]. N = 6 biologically independent samples. (q) Hypusine levels after five days of fasting in isolated human PBMCs of cohort 4, stratified by sex. N = 12(female baseline), 11(female fasted), 5 (male baseline), 4(male fasted) volunteers. (r-t) eIF5AH levels after five days of fasting in isolated human PBMCs of cohort 4 do not correlate with age, pre-fasting baseline BMI or body weight loss (body weight ratio). N = 15 volunteers. Statistics: [B,D,L,NP,Q] Two-way ANOVA with Holm-Šídák’s multiple comparisons test. [F] One-way ANOVA with Holm-Šídák’s multiple comparisons test. [H,J] Two-tailed Student’s t-test with Holm-Šídák’s multiple comparisons test. [R-T] Simple linear regression. Bar graphs show the mean ± s.e.m. Source numerical data and unprocessed blots are available in source data. Source data
Extended Data Fig. 10
Extended Data Fig. 10. Hypusination is important for fasting-induced autophagy in worms and human cells.
(a) Feeding of dhps-1(RNAi) expressing bacteria reduces dhps-1 mRNA expression in C. elegans N2 worms. N = 2 biologically independent experiments. (b) Representative confocal images of the head region of young C. elegans MAH215 (sqIs11 [lgg-1p::mCherry::GFP::lgg-1 + rol-6]) fasted for two days and fed control or dhps-1(RNAi) expressing bacteria. Autolysosomes (ALs) appear as mCherry-positive puncta. Scale bar = 50 μm. (c) Quantification of ALs as depicted in [B]. Note that the experiment and statistics were performed together with the odc-1(RNAi) groups in Fig. 3p. N = 11(CTL ad lib), 26(CTL fasted), 10(dhps-1(RNAi) ad lib), 21(dhps-1(RNAi) fasted) worms. (d) Representative fluorescence images of the head region of young C. elegans MAH215 (sqIs11 [lgg-1p::mCherry::GFP::lgg-1 + rol-6]) (LGG-1 is the C. elegans ortholog of LGG-1/Atg8) fasted for two days and fed control or dhps-1(RNAi) expressing bacteria. Autophagic activity is indicated by a shift to the red spectrum due to fluorescence quenching of the pH-sensitive-GFP by the acidic environment of the autolysosome. Scale bar = 50 μm. (e) Quantification of the ratio of the mean fluorescence intensity of mCherry/GFP signals, as depicted in [D]. Note that the experiment and statistics were performed together with the odc-1(RNAi) groups in Extended Data Fig. 6d. N = 121(CTL ad lib), 127(CTL fasted), 107(Dhps-1(RNAi) ad lib), 143(Dhps-1(RNAi) fasted) worms. (f) Representative fluorescence images of the head region of young C. elegans SQST-1::GFP fasted for two days and fed control or dhps-1(RNAi) expressing bacteria. Autophagic activity is indicated by a decrease in the number of GFP-positive particles. Scale bar = 50 μm. (g) Quantification of the SQST-1::GFP particles in the head region, as depicted in [F]. Note that the experiment and statistics were performed together with the odc-1(RNAi) groups in Extended Data Fig. 6f. N = 133(CTL ad lib), 86(CTL fasted), 108(dhps-1(RNAi) ad lib), 100(dhps-1(RNAi) fasted) worms. (h) Knockdown of dhps-1 does not affect worm size under ad lib or IF conditions. Note that the experiment and statistics were performed together with the odc-1(RNAi) groups in Extended Data Fig. 7g. N = 56(CTL ad lib), 66(CTL IF), 62(dhps-1(RNAi) ad lib), 59(dhps-1(RNAi) IF) worms. (i) Representative images of U2OS GFP-LC3 cells starved in HBSS with or without 100 µM GC7 for 6 hours. CQ was added for 3 hours before fixation. (j-k) Quantifications of [I]. N = 18 biologically independent samples. Statistics: [C,E,G] Kruskal-Wallis-test with Dunn’s correction. [H,J,K] Two-way ANOVA with Holm-Šídák’s multiple comparisons test. Bar graphs show the mean ± s.e.m. Source numerical data are available in source data. Source data

References

    1. Green, C. L., Lamming, D. W. & Fontana, L. Molecular mechanisms of dietary restriction promoting health and longevity. Nat. Rev. Mol. Cell Biol. 10.1038/s41580-021-00411-4 (2021). - PMC - PubMed
    1. Fontana, L. The scientific basis of caloric restriction leading to longer life. Curr. Opin. Gastroenterol.25, 144–150 (2009). 10.1097/MOG.0b013e32831ef1ba - DOI - PubMed
    1. Francesco, A. D., Germanio, C. D., Bernier, M. & de. Cabo, R. A time to fast. Science362, 770–775 (2018). 10.1126/science.aau2095 - DOI - PMC - PubMed
    1. Hofer, S. J., Carmona-Gutierrez, D., Mueller, M. I. & Madeo, F. The ups and downs of caloric restriction and fasting: from molecular effects to clinical application. EMBO Mol. Med. 10.15252/emmm.202114418 (2021). - PMC - PubMed
    1. Mitchell, S. J. et al. Daily fasting improves health and survival in male mice independent of diet composition and calories. Cell Metab.29, 221–228.e3 (2019). 10.1016/j.cmet.2018.08.011 - DOI - PMC - PubMed

Publication types

Substances

Grants and funding

LinkOut - more resources