. 2024 Oct;131(6):1092-1105.
doi: 10.1038/s41416-024-02810-8. Epub 2024 Aug 8.

CDK9 inhibition inhibits multiple oncogenic transcriptional and epigenetic pathways in prostate cancer

Affiliations

CDK9 inhibition inhibits multiple oncogenic transcriptional and epigenetic pathways in prostate cancer

Razia Rahman et al. Br J Cancer. 2024 Oct.

Erratum in

Abstract

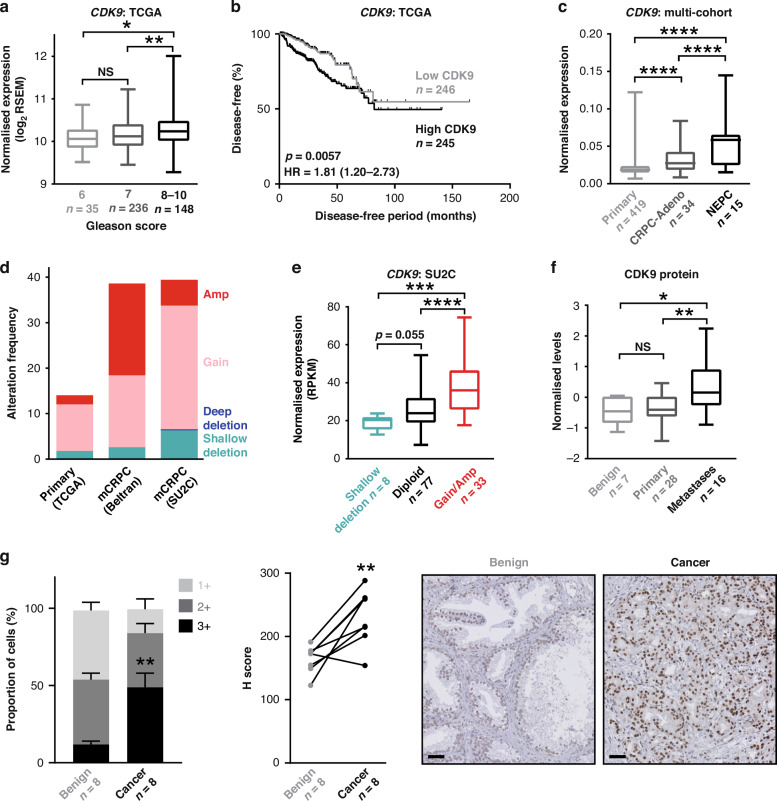
Background: Cyclin-dependent kinase 9 (CDK9) stimulates oncogenic transcriptional pathways in cancer and CDK9 inhibitors have emerged as promising therapeutic candidates.

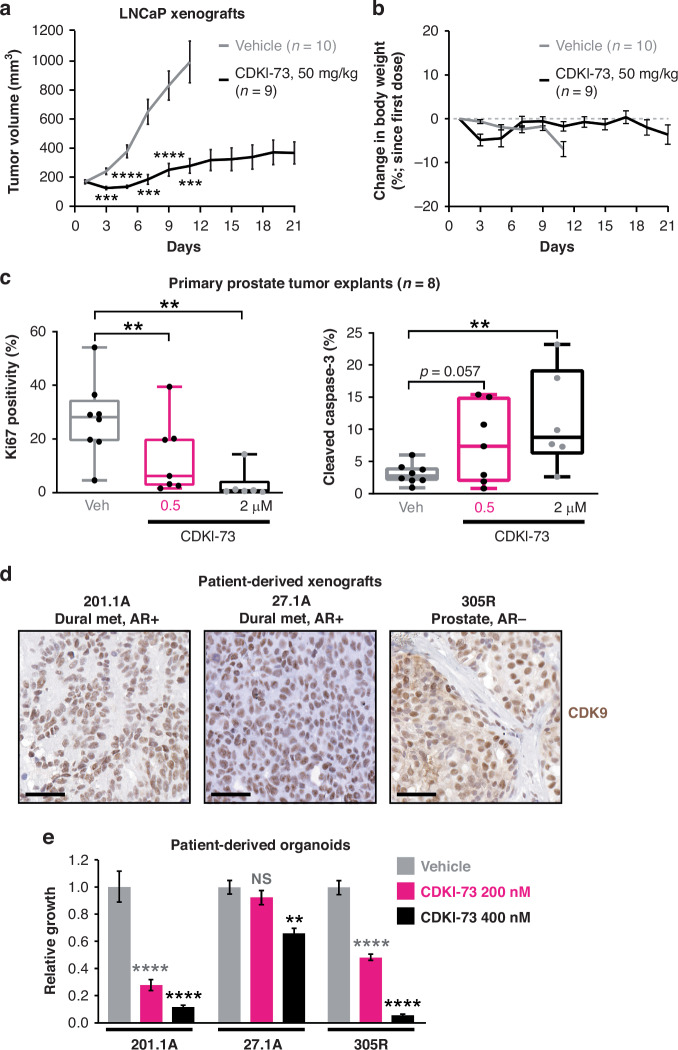
Methods: The activity of an orally bioavailable CDK9 inhibitor, CDKI-73, was evaluated in prostate cancer cell lines, a xenograft mouse model, and patient-derived tumor explants and organoids. Expression of CDK9 was evaluated in clinical specimens by mining public datasets and immunohistochemistry. Effects of CDKI-73 on prostate cancer cells were determined by cell-based assays, molecular profiling and transcriptomic/epigenomic approaches.

Results: CDKI-73 inhibited proliferation and enhanced cell death in diverse in vitro and in vivo models of androgen receptor (AR)-driven and AR-independent models. Mechanistically, CDKI-73-mediated inhibition of RNA polymerase II serine 2 phosphorylation resulted in reduced expression of BCL-2 anti-apoptotic factors and transcriptional defects. Transcriptomic and epigenomic approaches revealed that CDKI-73 suppressed signaling pathways regulated by AR, MYC, and BRD4, key drivers of dysregulated transcription in prostate cancer, and reprogrammed cancer-associated super-enhancers. These latter findings prompted the evaluation of CDKI-73 with the BRD4 inhibitor AZD5153, a combination that was synergistic in patient-derived organoids and in vivo.

Conclusion: Our work demonstrates that CDK9 inhibition disrupts multiple oncogenic pathways and positions CDKI-73 as a promising therapeutic agent for prostate cancer, particularly aggressive, therapy-resistant subtypes.


Conflict of interest statement

G Risbridger, R Taylor and M Lawrence (Research collaborations: AstraZeneca, Pfizer, Astellas, Zenith Epigenetics for research on compounds not associated with this study).

Figures

Fig. 1
Fig. 1. CDK9 is commonly over-expressed and amplified in prostate cancer.
a Expression level of CDK9 in localized prostate cancer according to increasing Gleason score in the TCGA [26] cohort. Boxes extend from the 25th to 75th percentiles; the middle line is the median; top and bottom lines are minimum and maximum. Groups were compared using ANOVA and Tukey’s multiple comparison tests. b Kaplan–Meier curve showing estimated disease-free probability following radical prostatectomy in patients with high or low levels of CDK9 in the TCGA cohort. P value and hazard ratio were determined using log-rank tests. c Expression level of CDK9 in localized prostate cancer (TCGA) and adenocarcinoma (CRPC-Adeno) or neuroendocrine (NEPC) subtypes of CRPC [28]. CDK9 mRNA levels were normalized to ACTB mRNA levels. Groups were compared using ANOVA and Tukey’s multiple comparison tests. d CDK9 is commonly amplified in prostate cancer. Data is from The Cancer Genome Atlas (TCGA), Beltran [28] and Stand Up 2 Cancer (SU2C) [29] cohorts. e CDK9 gene amplification in the SU2C cohort is associated with increased mRNA expression. Groups were compared using ANOVA and Tukey’s multiple comparison tests. f CDK9 protein expression in clinical prostate samples (benign, primary tumors, or bone metastases) was measured by mass spectrometry [55]. Groups were compared using ANOVA and Tukey’s multiple comparison tests. g CDK9 protein expression is elevated in malignant compared to benign prostate tissues. Left, stacked bar graph showing the proportion of cells with low (1+), intermediate (2+), and high (3+) intensity CDK9 staining. Error bars are standard errors of the mean (s.e.m.). P value was determined using an unpaired t-test comparing the 3+ proportions. Middle, H scores of matched tumors and non-malignant samples (n = 8). P value was determined using a paired t test. Right, representative staining of non-malignant and Gleason grade 3 and 4 tumors (bar = 100 µm). In all panels, p values are: *p < 0.05; **p < 0.01; ***p < 0.001; ****p < 0.0001.
Fig. 2
Fig. 2. CDKI-73 causes cell death and suppresses anti-apoptotic pathways in prostate cancer cells.
a Chemical structure of CDKI-73. b Live-cell confluency analysis (Incucyte) demonstrates a dose-dependent reduction of LNCaP cell growth in response to CDKI-73. Error bars are ± s.e.m. of 6 biological replicates. Data is representative of 3 independent experiments. c Flow cytometry-based Annexin V/7-AAD apoptosis assay after 72 h of treatment with the indicated doses of CDKI-73. Data represents the mean of triplicate samples and are representative of 3 independent experiments. Error bars are s.e.m. Apoptotic cell proportions were compared to the vehicle using ANOVA and Tukey’s multiple comparison tests (*p < 0.05; ****p < 0.0001). d Representative Western blots showing decreased levels of RNAPII, pSer2-RNAPII, BCL-2, MCL-1, and MYC following treatment of LNCaP cells with the indicated doses of CDKI-73 or vehicle control (DMSO) for 10 or 24 h. GAPDH is shown as a loading control. e Levels of pSer2-RNAPII normalized to total RNAPII (both normalized to GAPDH) following treatment of LNCaP cells with the indicated doses of CDKI-73 or vehicle control (DMSO) for 10 or 24 h. This data is from an independent experiment to that shown in panel d. f Expression of genes encoding anti-apoptotic factors, as measured by qRT-PCR, following 4, 8, or 12 h of treatment with the indicated doses of CDKI-73 or vehicle control (DMSO). Gene expression was normalized to GAPDH, HPRT1, and ACTB; expression for DMSO (4 h) was set to 1. Error bars are ± s.e.m. of 3 biological replicates; P values (treatment compared to vehicle) were determined using ANOVA and Dunnett’s multiple comparisons tests. The data shown is representative of 3 independent experiments. In all panels: a or *p < 0.05; b or **p < 0.01; c or ***p < 0.001; d or ****p < 0.0001; NS, not significant.
Fig. 3
Fig. 3. CDKI-73 has potent anti-tumor activity in diverse, clinically-relevant models of aggressive prostate cancer.
a Growth of LNCaP xenografts in mice treated with vehicle (n = 10) or CDKI-73 (n = 9). CDKI-73 (50 mg/kg) was administered orally on day 1 and then daily from day 3. For vehicle-treated mice, tumor size in 4 mice reached the ethical end-point at day 11; hence, this is the final time-point in this group. Graphs show the mean ± s.e.m. at each time-point. b Average body weight of mice harboring LNCaP xenografts and treated with vehicle or CDKI-73 (50 mg/kg). For vehicle-treated mice, tumor size in 4 mice reached the ethical end-point at day 11; hence, this is the final time-point in this group. c CDKI-73 inhibits proliferation and promotes cell death in prospectively collected human tumors grown as patient-derived explants (PDEs). PDEs (from n = 8 patients) were treated for 48 h. Ki67 and cleaved caspase-3 were evaluated by immunohistochemistry. Boxes extend from the 25th to 75th percentiles; the middle line is the median; top and bottom lines are minimum and maximum. Groups were compared using ANOVA and Tukey’s multiple comparison tests. d Representative immunohistochemistry staining of CDK9 in 3 independent PDXs, 27.1A, 201.1A and 305R. Source of tissue for the PDXs and AR status are shown in Supplementary Fig. 3. Met, metastasis. The bar is 50 µM. e CDKI-73 inhibits the growth of organoids grown from PDXs. Organoid viability was determined using Cell Titer Glo viability assays 3 days post-treatment. Data represents the mean ± s.e.m. of quadruplicate samples; treatment groups were compared to vehicles using ANOVA and Tukey’s multiple comparison tests. In all panels: *p < 0.05; **p < 0.01; ***p < 0.001; ****p < 0.0001; NS, not significant.
Fig. 4
Fig. 4. CDKI-73 reduces AR expression and activity.
a Volcano plot demonstrating genes differentially expressed (≥2-fold change and false-discovery rate (FDR) q value ≤ 0.05) in response to 4 h of treatment with 250 nM CDKI-73. b Hallmark pathways [75] suppressed (down) and activated (up) by CDKI-73, as determined using GSEA. NS, not significant. c Expression of AR mRNA and AR target genes (FKPB5 and TMPRSS2), as measured by qRT-PCR, following 4, 8 or 12 h of treatment with the indicated doses of CDKI-73 or vehicle control. Gene expression was normalized to GAPDH, HPRT1, and ACTB; expression for the vehicle (4 h) was set to 1. Error bars are ± s.e.m. of 3 biological replicates; P values (treatment compared to vehicle) were determined using ANOVA and Dunnett’s multiple comparisons tests. The data shown is representative of 3 independent experiments. d Representative Western blots showing levels of pSer81-AR and total AR following treatment of LNCaP cells with the indicated doses of CDKI-73 or vehicle control (DMSO) for 10 and 24 h. GAPDH is shown as a loading control. The values below the pSer81-AR blots are levels of pSer81-AR normalized to total AR (both normalized to GAPDH, with DMSO set to 1); the values below the AR blots are its levels normalized to GAPDH (with DMSO set to 1). In all panels: a or *p < 0.05; b or **p < 0.01; c or ***p < 0.001; d or ****p < 0.0001; NS, not significant.
Fig. 5
Fig. 5. CDKI-73 induces epigenomic reprogramming and disrupts prostate cancer-associated enhancers.
a Volcano plot demonstrating genomic sites with differential H3K27ac ChIP-seq signal in response to 48 h of treatment with 150 nM CDKI-73. b Genomic distribution of H3K27ac lost sites, determined using ChIPseeker [45]. c GIGGLE plot showing overlap between H3K27ac lost sites and publicly available cistrome data for transcription factors and epigenetic regulators. Points indicate individual datasets, line indicates mean score. d Motifs enriched in the H3K27ac lost sites, were identified using HOMER [46]. P values represent enrichment over the genomic background. e Overlap between H3K27ac lost sites and LNCaP super-enhancers defined in a previous study [76]. Arrows indicate the number of sites in that particular dataset that overlap with the other. f CDKI-73 suppresses BRD4 oncogenic gene sets [68, 77], as demonstrated by GSEA. NES, normalized enrichment score. g Fold-change of mRNAs following CDKI-73 treatment for genes associated with or without super-enhancers (SE status + and -, respectively). LNCaP genes with SEs were obtained from the SEdb 2.0 database [78] using published H3K27ac ChIP-seq data (GSM1902615) [76].
Fig. 6
Fig. 6. Synergism of CDKI-73 with BRD4 inhibition.
a Growth assays assessing the effect of CDKI-73, AZD5153, or the combination of both drugs in the indicated cell lines. Error bars are ± s.e.m. Treatment groups were compared using t-tests. b Representative Western blots showing levels of pSer2-RNAPII, MCL-1, and MYC in LNCaP cells following 24 h of treatment with CDKI-73, AZD5153, or the combination. GAPDH is shown as a loading control. c Expression of MCL1 and MYC mRNA, as measured by qRT-PCR, in LNCaP cells following 8 h of treatment with the indicated doses of CDKI-73, AZD5153 or the combination. Gene expression was normalized to GAPDH and ACTB; expression for vehicle (DMSO) was set to 1. Error bars are ± s.e.m. of 3 biological replicates; P values (treatment compared to vehicle) were determined using ANOVA and Tukey’s multiple comparisons tests. The data shown is representative of 2 independent experiments. d LNCaP tumor volume in mice treated with vehicle (n = 10), CDKI-73 (n = 9), AZD5153 (n = 10), or the combination (n = 9) following 1 or 11 days of engraftment. Single-agent treatments were administered orally on day 1 and then daily from day 3; for the combination treatment, drugs were administered orally on days 1, 3–7, and 10–11. Boxes are minimum to maximum; the line indicates the mean. Groups were compared using ANOVA and Tukey’s multiple comparison tests. e Synergistic activity of CDKI-73 and AZD5153 in 201.1A-Cx organoids. Organoid viability was determined using Cell Titer-Glo viability assays at 3 days post-treatment. Data represents the mean ± s.e.m. of 6 individual wells. f Synergy map (highest single agent (HSA) model) for the experiment shown in e, generated using SynergyFinder Plus [54]. g Summary of synergy between CDKI-73 and AZD5153 in 4 organoid models of aggressive prostate cancer. Mean synergy scores from 3 distinct synergy models (zero interaction potency (ZIP), HSA, and Bliss) are shown; the average of the 3 models is shown on the right. In all panels: *p < 0.05; **p < 0.01; ***p < 0.001; ****p < 0.0001; NS, not significant.

References

    1. Ferlay J, Soerjomataram I, Dikshit R, Eser S, Mathers C, Rebelo M, et al. Cancer incidence and mortality worldwide: sources, methods and major patterns in GLOBOCAN 2012. Int J cancer J Int du cancer. 2015;136:E359–86. - PubMed
    1. Coutinho I, Day TK, Tilley WD, Selth LA. Androgen receptor signaling in castration-resistant prostate cancer: a lesson in persistence. Endocr-Relat cancer. 2016;23:T179–T97. - PubMed
    1. Recine F, Sternberg CN. Hormonal therapy and chemotherapy in hormone-naive and castration resistant prostate cancer. Transl Androl Urol. 2015;4:355–64. - PMC - PubMed
    1. Davies A, Zoubeidi A, Selth LA. The epigenetic and transcriptional landscape of neuroendocrine prostate cancer. Endocr-Relat cancer. 2020;27:R35–R50. - PubMed
    1. Gioeli D, Paschal BM. Post-translational modification of the androgen receptor. Mol Cell Endocrinol. 2012;352:70–8. - PubMed

MeSH terms