. 2024 Nov;48(11):1625-1637.
doi: 10.1038/s41366-024-01600-9. Epub 2024 Aug 8.

Hepatocyte-specific loss of melanocortin 1 receptor disturbs fatty acid metabolism and promotes adipocyte hypertrophy

Affiliations

Hepatocyte-specific loss of melanocortin 1 receptor disturbs fatty acid metabolism and promotes adipocyte hypertrophy

Keshav Thapa et al. Int J Obes (Lond). 2024 Nov.

Abstract

Background/objectives: Melanocortins mediate their biological functions via five different melanocortin receptors (MC1R - MC5R). MC1R is expressed in the skin and leukocytes, where it regulates skin pigmentation and inflammatory responses. MC1R is also present in the liver and white adipose tissue, but its functional role in these tissues is unclear. This study aimed at determining the regulatory role of MC1R in fatty acid metabolism.

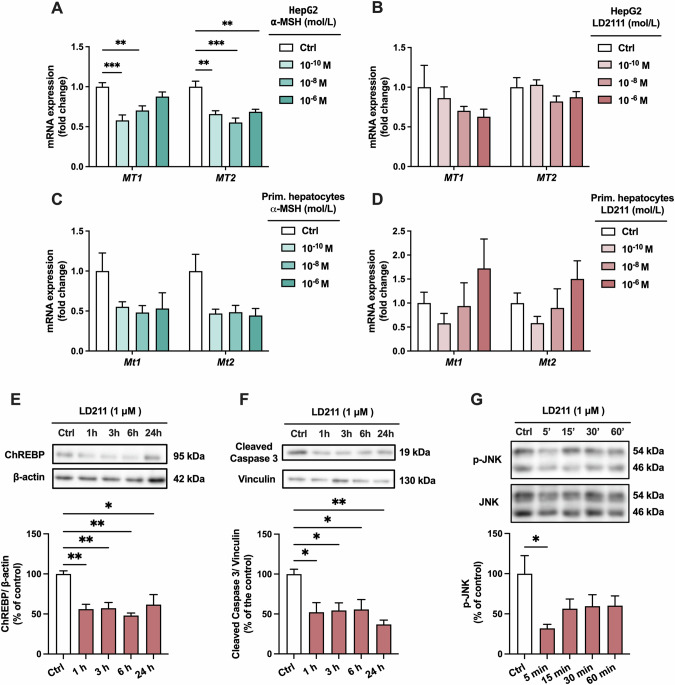
Methods: Male recessive yellow (Mc1re/e) mice, a model of global MC1R deficiency, and male hepatocyte-specific MC1R deficient mice (Mc1r LKO) were fed a chow or Western diet for 12 weeks. The mouse models were characterized for body weight and composition, liver adiposity, adipose tissue mass and morphology, glucose metabolism and lipid metabolism. Furthermore, qPCR and RNA sequencing analyses were used to investigate gene expression profiles in the liver and adipose tissue. HepG2 cells and primary mouse hepatocytes were used to study the effects of pharmacological MC1R activation.

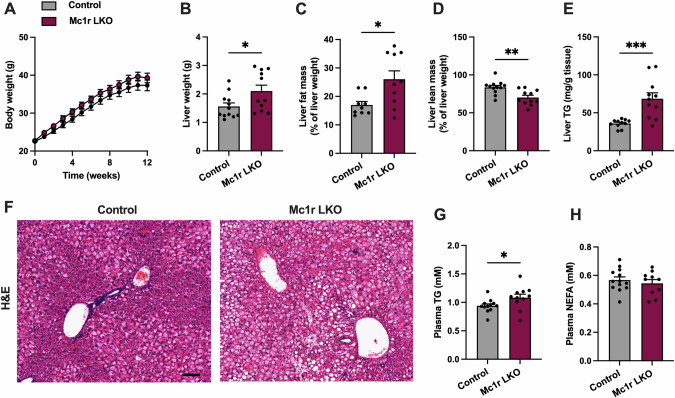
Results: Chow- and Western diet-fed Mc1re/e showed increased liver weight, white adipose tissue mass and plasma triglyceride (TG) concentration compared to wild type mice. This phenotype occurred without significant changes in food intake, body weight, physical activity or glucose metabolism. Mc1r LKO mice displayed a similar phenotype characterized by larger fat depots, increased adipocyte hypertrophy and enhanced accumulation of TG in the liver and plasma. In terms of gene expression, markers of de novo lipogenesis, inflammation and apoptosis were upregulated in the liver of Mc1r LKO mice, while enzymes regulating lipolysis were downregulated in white adipose tissue of these mice. In cultured hepatocytes, selective activation of MC1R reduced ChREBP expression, which is a central transcription factor for lipogenesis.

Conclusions: Hepatocyte-specific loss of MC1R disturbs fatty acid metabolism in the liver and leads to an obesity phenotype characterized by enhanced adipocyte hypertrophy and TG accumulation in the liver and circulation.


Conflict of interest statement

The authors declare no competing interests.

Figures

Fig. 1
Fig. 1. Mc1re/e mice with global MC1R deficiency show increased white adipose tissue mass and liver weight.
A, B Body weight curves in chow- and Western diet-fed wild type (WT) and Mc1re/e mice. C, D Quantification of fat and lean mass by quantitative NMR scanning of whole-body composition in chow- and Western diet-fed WT and Mc1re/e mice at the end of the 12-week diet intervention. E–G White adipose tissue (WAT) weights and sum weights of WAT depots in chow- and Western diet-fed WT and Mc1re/e mice. H Liver weight in chow- and Western diet-fed WT and Mc1re/e mice. I, J Quantification of plasma triglyceride (TG) and non-esterified fatty acids (NEFA) concentrations in chow- and Western diet-fed WT and Mc1re/e mice. Values are mean ± SEM, n = 10–15 mice per group in each graph. *p < 0.05 and **p < 0.01 for the indicated comparisons by two-way ANOVA and Bonferroni post hoc tests. #### p < 0.0001 for the main effect of diet by 2-way ANOVA.WAT indicates white adipose tissue; TG triglyceride, NEFA non-esterified fatty acids.
Fig. 2
Fig. 2. Mc1re/e mice show increased adipocyte hypertrophy and upregulation of lipogenesis-related genes in the liver.
A Representative H&E-stained gWAT sections of chow- and Western diet-fed WT and Mc1re/e mice. Scale bar = 100 µm. B, C Adipocyte size distribution in histological gWAT samples from chow- and Western diet-fed WT and Mc1re/e mice (D) Mean adipocyte size in gWAT samples of chow- and Western diet-fed WT and Mc1re/e mice. E–G Quantitative real-time-polymerase chain reaction (qPCR) analysis of Lpl, Lipe, Atgl expression in the gWAT. H–K qPCR analysis of Srebp1c, Chrebp, Fasn and Scd1 expression in the liver. Values are mean ± SEM, n = 10–15 mice per group in each graph. *p < 0.05, **p < 0.01 and ***p < 0.001 for the indicated comparisons by two-way ANOVA and Bonferroni post hoc tests. # p < 0.05 and ## p < 0.01 for the main effect of diet by 2-way ANOVA. gWAT indicates gonadal white adipose tissue. Lpl lipoprotein lipase, Lipe hormone sensitive lipase, Atgl adipose triglyceride lipase, Srebp1c sterol regulatory element-binding protein 1, Chrebp carbohydrate response element-binding protein, Fasn fatty acid synthase, Scd1 stearoyl-CoA desaturase 1.
Fig. 3
Fig. 3. Hepatocyte-specific melanocortin 1 receptor (MC1R) deficiency increases liver weight and hepatic triglyceride accumulation.
A Body weight curves of Western diet-fed control and Mc1r LKO mice. B Liver weight at the end of the experiment. C, D Quantification of fat and lean mass of whole liver by quantitative NMR scanning. E Quantification of liver TG levels in control and Mc1r LKO mice. F Representative H&E-stained liver sections of Western diet-fed control and Mc1r LKO mice. Scale bar = 100 µm. G, H Quantification of plasma TG and NEFA concentrations in control and Mc1r LKO mice. Values are mean ± SEM, n = 10–15 mice per group in each graph. *p < 0.05, **p < 0.01 and ***p < 0.001 by unpaired two-tailed Student’s t test. Mc1r LKO indicates liver-specific MC1R knockout mice; TG triglycerides, NEFA non-esterified fatty acids.
Fig. 4
Fig. 4. Hepatocyte-specific MC1R deficiency increases adiposity.
A Absolute weights of different white adipose tissue (WAT) depots in Western diet-fed control and Mc1r LKO mice. B Relative WAT weights (expressed as % of body weight). C Sum weight of all WAT depots in Western diet-fed control and Mc1r LKO mice. D Representative H&E-stained gWAT sections of Western diet-fed control and Mc1r LKO mice. Scale bar  = 100 µm. E, F The distribution of adipocyte sizes and mean adipocyte area in the gWAT of Western diet-fed control and Mc1r LKO mice. G–I qPCR analysis of genes involved in lipogenesis and lipolysis, and lipid droplet-associated proteins in the gWAT of Western diet-fed control and Mc1r LKO mice. Values are mean ± SEM, n = 10–15 per group in each graph. *p < 0.05 and **p < 0.01 by unpaired two-tailed Student’s t test. Ppara peroxisome proliferator activated receptor alpha, Srebp1c sterol regulatory element-binding protein 1, Chrebp carbohydrate response element-binding protein, Lpl lipoprotein lipase, Lipe hormone sensitive lipase, Atgl adipose triglyceride lipase, Mgll monoglyceride lipase, Plin1 perilipin-1, Plin2 perilipin-2, Plin3 perilipin-3.
Fig. 5
Fig. 5. Hepatic transcriptome of Western diet-fed Mc1r LKO mice.
A Volcano plot of differentially expressed genes (DEGs) between control and Mc1r LKO mice. n = 4 mice per group. B Gene ontology (GO) terms associated with DEGs that were identified using topGO, a Bioconductor R package. Circle size indicates the number of DEGs enriched in the pathway, and circle color indicates the degree of enrichment. C Validation of RNA-Seq data with qPCR of selected DEGs (Mt1, Mt2, Fkbp5 Pfkfb3) in the liver of Western diet-fed control and Mc1r LKO mice. D, E qPCR analysis of pro-inflammatory cytokines and apoptosis markers in the liver. F–H qPCR analysis of genes involved in de novo lipogenesis, fatty acid oxidation, and fatty acid esterification and lipid droplet formation. Values are ±SEM, n = 10–11 mice per group in each graph. *p < 0.05 versus control mice by Student’s t test. Mt1 metallothionein 1, Mt2 metallothionein 2, Fkbp5 FK506 binding protein 5, Il1b interleukin-1 beta, Il6 interleukin 6, Tnfa tumor necrosis factor alpha, Bax Bcl2-associated X protein, Noxa phorbol-12-myristate-13-acetate-induced protein 1, Bcl2 B-cell lymphoma 2, Casp3 caspase 3, Chrebp carbohydrate response element binding protein, Acc1 acetyl-CoA carboxylase, Fasn fatty acid synthase, Scd1 stearoyl-CoA desaturase-1, Gpat3 glycerol-3-phosphate acyltransferase 1, Ppara peroxisome proliferator-activated receptor, Cpt1a carnitine O-palmitoyltransferase 1, Cpt2 carnitine O-palmitoyltransferase 2, Acox1 peroxisomal acyl-coenzyme A oxidase 1, Dgat1 diglyceride acyltransferase, Gpat3 glycerol-3-phosphate acyltransferase 3, Plin1 perilipin-1, Plin2 perilipin-2, Plin3 perilipin-3.
Fig. 6
Fig. 6. Pharmacological activation of MC1R reduces ChREBP protein expression in primary mouse hepatocytes.
A, B qPCR analysis of MT1 and MT2 mRNA levels in HepG2 treated with different concentrations (0.1 nM, 10 nM, or 1 µM) of α-MSH or the selective MC1R agonist LD211 for 3 h. C, D qPCR analysis of Mt1 and Mt2 mRNA levels in primary mouse hepatocytes treated with different concentrations (0.1 nM, 10 nM, or 1 µM) of α-MSH or the selective MC1R agonist LD211 for 3 h. E, F Representative Western blots and quantification of ChREBP and cleaved caspase 3 protein levels in primary mouse hepatocytes treated with 1 µM of LD211 for 1, 3, 6 or 24 h. G Representative Western blots and quantification of phosphorylated JNK (p-JNK) in primary mouse hepatocytes treated with 1 µM of LD211 for 5, 15, 30 or 60 min. Values are mean ± SEM, n = 3–6 per group in each graph from 2 independent experiments. *p < 0.05, **p < 0.01 and ***p < 0.001 for the indicated comparisons by one-way ANOVA and Dunnet post hoc tests.

References

    1. Eckel RH, Grundy SM, Zimmet PZ. The metabolic syndrome. Lancet. 2005;365:1415–28. - PubMed
    1. Fabbrini E, Sullivan S, Klein S. Obesity and nonalcoholic fatty liver disease: biochemical, metabolic, and clinical implications. Hepatol Baltim Md. 2010;51:679–89. - PMC - PubMed
    1. Bugianesi E, Gastaldelli A, Vanni E, Gambino R, Cassader M, Baldi S, et al. Insulin resistance in non-diabetic patients with non-alcoholic fatty liver disease: sites and mechanisms. Diabetologia. 2005;48:634–42. - PubMed
    1. Haas JT, Francque S, Staels B. Pathophysiology and mechanisms of nonalcoholic fatty liver disease. Annu Rev Physiol. 2016;78:181–205. - PubMed
    1. Azzu V, Vacca M, Virtue S, Allison M, Vidal-Puig A. Adipose tissue-liver cross talk in the control of whole-body metabolism: implications in nonalcoholic fatty liver disease. Gastroenterology. 2020;158:1899–912. - PubMed

Publication types