. 2024 Sep;8(9):1641-1653.
doi: 10.1038/s41559-024-02481-x. Epub 2024 Aug 8.

Century-long timelines of herbarium genomes predict plant stomatal response to climate change

Affiliations

Century-long timelines of herbarium genomes predict plant stomatal response to climate change

Patricia L M Lang et al. Nat Ecol Evol. 2024 Sep.

Abstract

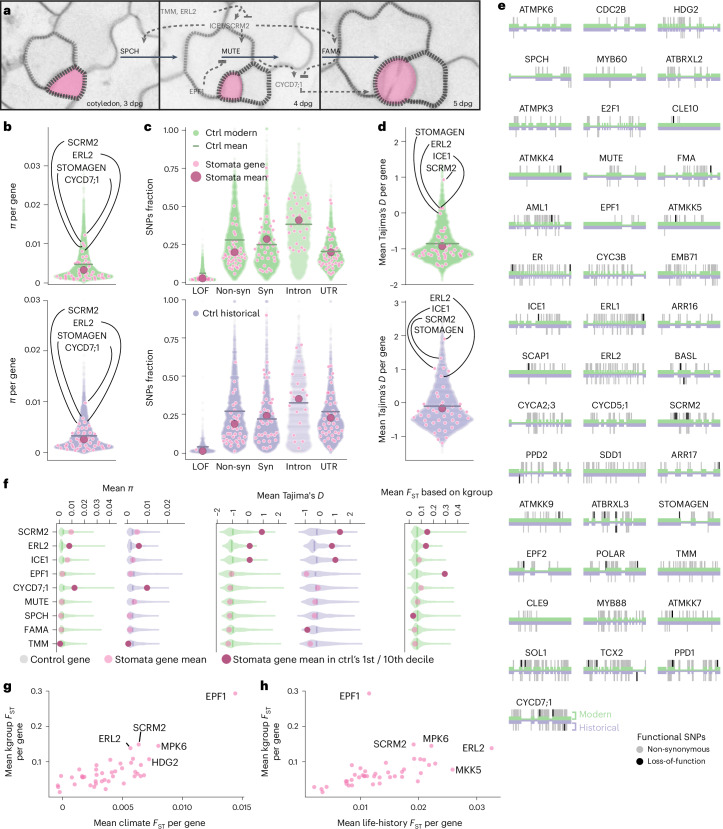
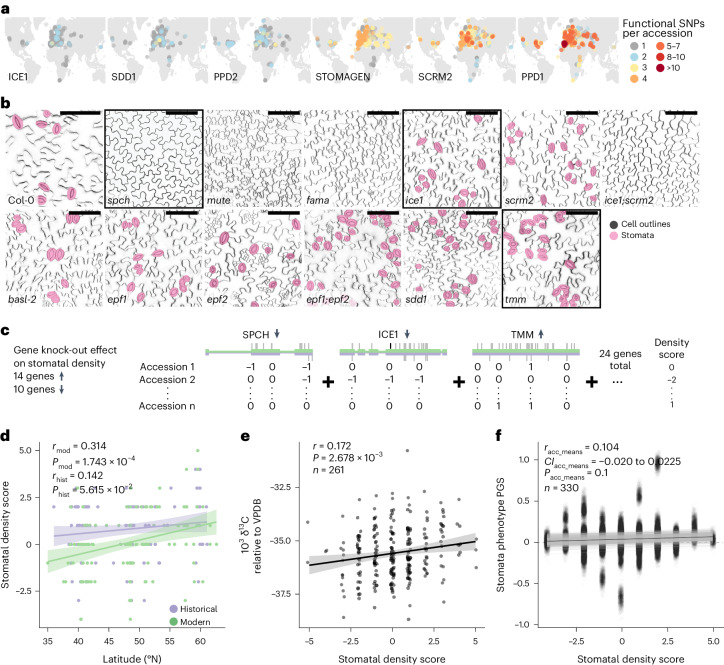
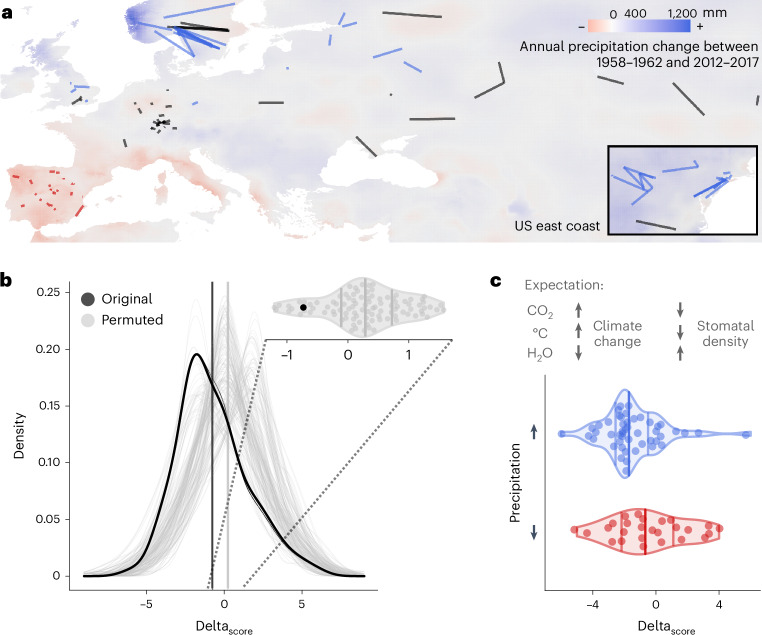
Dissecting plant responses to the environment is key to understanding whether and how plants adapt to anthropogenic climate change. Stomata, plants' pores for gas exchange, are expected to decrease in density following increased CO2 concentrations, a trend already observed in multiple plant species. However, it is unclear whether such responses are based on genetic changes and evolutionary adaptation. Here we make use of extensive knowledge of 43 genes in the stomatal development pathway and newly generated genome information of 191 Arabidopsis thaliana historical herbarium specimens collected over 193 years to directly link genetic variation with climate change. While we find that the essential transcription factors SPCH, MUTE and FAMA, central to stomatal development, are under strong evolutionary constraints, several regulators of stomatal development show signs of local adaptation in contemporary samples from different geographic regions. We then develop a functional score based on known effects of gene knock-out on stomatal development that recovers a classic pattern of stomatal density decrease over the past centuries, suggesting a genetic component contributing to this change. This approach combining historical genomics with functional experimental knowledge could allow further investigations of how different, even in historical samples unmeasurable, cellular plant phenotypes may have already responded to climate change through adaptive evolution.


Conflict of interest statement

The authors declare no competing interests.

Figures

Fig. 1
Fig. 1. Conserved core stomata genes and regulatory genes show local adaptation signals.
a, Stomatal development in A. thaliana (simplified, example regulators in grey, central (core) transcription factors in black. Stomata false-coloured in magenta. Cotyledons imaged at 3, 4 and 5 days post germination. b, Genetic diversity in stomatal genes is significantly lower than in length-matched control genes (gene names mark outliers; nucleotide diversity π per gene, empirical Pmod = 0.004, Phist = 0.046). c, Significantly fewer SNPS in stomatal genes are putative LOF or non-synonymous than in the control genes (empirical Pmodnon-syn = 0, Phistnon-syn = 0.002, PmodLOF = 0, PhistLOF = 0.047; Supplementary Table 3). Ctrl, control; Non-syn, non-synonymous. d, Mean per-gene Tajima’s D indicates selection signals. Stomatal gene group is not significantly different (Pmod, Phist > 0.1) from the control, but several genes are outliers (labelled). Significance tests for panels bd asked whether means of the group of stomatal genes were outliers compared with the means of 1,000 control gene groups. Purple for historical, green for modern datasets, horizontal line indicates full control dataset’s mean. Magenta circles for stomatal genes, large dark circles for stomatal gene group mean. e, LOF (black) and non-synonymous (grey) SNPs in the 43 focus genes in historical (bottom, purple) and modern (top, green) dataset. f, Mean per-gene values for nucleotide diversity π, Tajima’s D and FSTkgroup values for outlier genes, compared with conserved stomatal factors SPCH, MUTE and FAMA (for all 43 genes, see Supplementary Figs. 2 and 3 and Supplementary Table 2). FSTkgroup is calculated for populations defined by whole-genome genetic variation (from ref. ). Gene values are displayed as transparent pink circles on violin plots representing distribution of values for the respective length-matched control genes, vertical line indicating distribution’s 0.5 quantile. Solid pink circles indicate that the gene mean value lies within the 1st/10th decile of the control distribution. g,h, Stomatal gene differentiation as mean FST per gene, with FSTkgroup (y-axis), compared with FST for populations clustered by climate of origin (precipitation, temperature, BIO4 and BIO15, Bioclim dataset; ref. ) (g) and life-history traits (data; ref. ) (h). Genes with the highest FST values across the three analyses are labelled.
Fig. 2
Fig. 2. Functional score predicts stomatal density patterns.
a, Geographic distribution of functional (non-synonymous, LOF) SNP accumulation in historical and modern samples for six genes with the overall highest amounts of putatively functional SNPs, overlaid on a continental map. Colour gradient from grey to dark red indicates samples with 1 to over 10 functional SNPs. b, Gradient of stomatal density differences resulting from loss of major stomatal development genes visualized with confocal microscopy. Stomata are false-coloured in magenta; scale bars, 100 µm. Black frames around three example genes used in c. c, Schematic overview detailing the generation of the experimentally informed stomatal density score. Of 24 genes with known effect on stomatal density, loss of 14 increases and loss of 10 decreases stomatal density. Putatively functional SNPs are assigned a ‘−1’ when located in genes whose loss decreases density and a ‘+1’ in genes whose loss increases density. Density scores for each historical and modern sample are calculated as the sum of these values across the 24 genes, counting a single functional SNP per gene. d, Linear regression (±s.d.) of the stomatal density score with paired samples’ latitude of origin, separated into historical (purple) and modern (green) samples (for each n = 126, one-sided Pearson’s correlation test Pmod = 1.743 × 10−4, Phist = 5.615 × 10−2, correlation coefficient rmod = 0.314, rhist = 0.142). Analyses exclude samples from North America and the African continent. e, Correlation (±s.d.) of the density score with the δ13C measurement, a proxy of WUE, in 261 A. thaliana accessions. This is based on isotope amount ratios of stable carbon isotopes 13C/12C, expressed as ‰ against the Vienna Pee Dee Belemnite (VPDB; ref. ) standard (one-sided Pearson’s correlation test P = 2.678 × 10−3, correlation coefficient r = 0.172; δ13C (stable carbon isotope ratio) data from ref. ). f, Correlation (±s.d.) of the stomatal density score with genome-wide association-based traditional PGS for stomatal density (one-sided Pearson’s correlation test, positive correlation 997/1,000 re-trainings, 141/1,000 significant one-sided Pearson’s correlation tests with P < 0.05, correlation coefficient rmedian = 0.092; stomatal density data from ref. ).
Fig. 3
Fig. 3. Stomatal density decrease over time fits climate change expectations.
a, Map with historical and modern sample pairs as used for stomatal density change analyses (in b and c). Connecting lines between sample pairs are coloured by the precipitation change in the sample locations; red indicates a significant decrease in precipitation from 1958 to 2017 in both the historical and modern sample location, blue indicates a significant increase in precipitation, and black no significant change or different changes in paired locations. Background colour gradient indicates change in the mean annual precipitation between 1958–1962 and 2012–2017, with colours as above. Inlay shows sample pairs located on the North American East Coast. b, Distribution of per sample-pair calculated difference in stomatal density scores (deltascore = modern − historical) for original data (black) and 100 permutations (grey) between genes and their assigned effect (decrease/increase) on stomatal density, with genetic variation itself remaining un-permuted; mean deltascore = −0.730, Wilcoxon signed rank test, P < 2.2 × 10−16. Density distribution means are marked by solid black and grey vertical lines. Violin plot of the distribution means, with the non-permuted mean deltascore lower than 92/100 permutations. c, Expected effects of climate-change-related shifts in [CO2], temperature and water availability on stomatal density (based on published experiments, for example, refs. ). Change in the stomatal density score (deltascore = modern − historical) in sample pairs with significantly increased (blue, n = 48) or decreased (red, n = 26) precipitation in geographic locations of origin (excluding sample pairs where precipitation did not change significantly or where a pair’s locations did not change in the same way). Horizontal lines indicate 0.25, 0.5 and 0.75 distribution quantiles. Increased, but not decreased, precipitation is significantly associated with decreased deltascore (linear regression, deltascore ≈ precipitationdirectionality, Pincr_precipitation = 0.024, Pdecr_precipitation = 0.889, Pmodel = 0.045; Supplementary Table 9). Analyses include samples from North America and exclude samples from the African continent as well as pairs between island and mainland samples.

References

    1. IPCC, 2022: Climate Change 2022: Impacts, Adaptation, and Vulnerability. Contribution of Working Group II to the Sixth Assessment Report of the Intergovernmental Panel on Climate Change (Cambridge Univ. Press, 2022).
    1. Panchen, Z. A., Primack, R. B., Anisko, T. & Lyons, R. E. Herbarium specimens, photographs, and field observations show Philadelphia area plants are responding to climate change. Am. J. Bot.99, 751–756 (2012). - PubMed
    1. Primack, D., Imbres, C., Primack, R. B., Miller-Rushing, A. J. & Del Tredici, P. Herbarium specimens demonstrate earlier flowering times in response to warming in Boston. Am. J. Bot.91, 1260–1264 (2004). - PubMed
    1. Parmesan, C. & Yohe, G. A globally coherent fingerprint of climate change impacts across natural systems. Nature421, 37–42 (2003). - PubMed
    1. Walker, A. P. et al. Integrating the evidence for a terrestrial carbon sink caused by increasing atmospheric CO2. New Phytol.229, 2413–2445 (2021). - PubMed