

Unraveling multi-scale neuroimaging biomarkers and molecular foundations for schizophrenia: A combined multivariate pattern analysis and transcriptome-neuroimaging association study
- PMID: 39118226
- PMCID: PMC11310100
- DOI: 10.1111/cns.14906
Unraveling multi-scale neuroimaging biomarkers and molecular foundations for schizophrenia: A combined multivariate pattern analysis and transcriptome-neuroimaging association study
Abstract
Aims: Schizophrenia is characterized by alterations in resting-state spontaneous brain activity; however, it remains uncertain whether variations at diverse spatial scales are capable of effectively distinguishing patients from healthy controls. Additionally, the genetic underpinnings of these alterations remain poorly elucidated. We aimed to address these questions in this study to gain better understanding of brain alterations and their underlying genetic factors in schizophrenia.
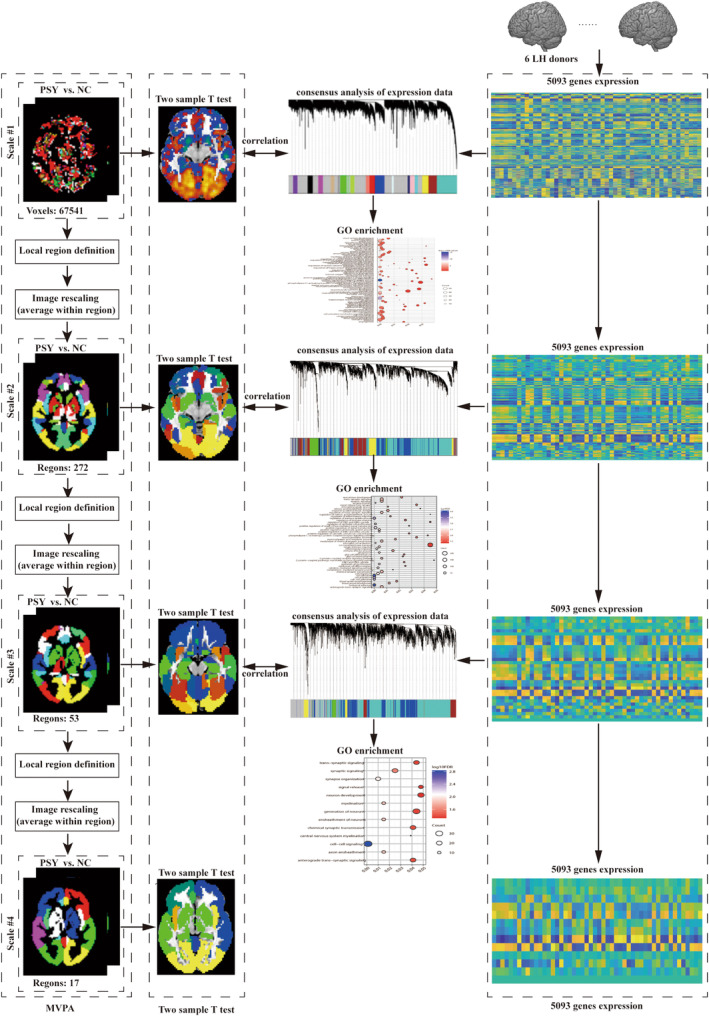
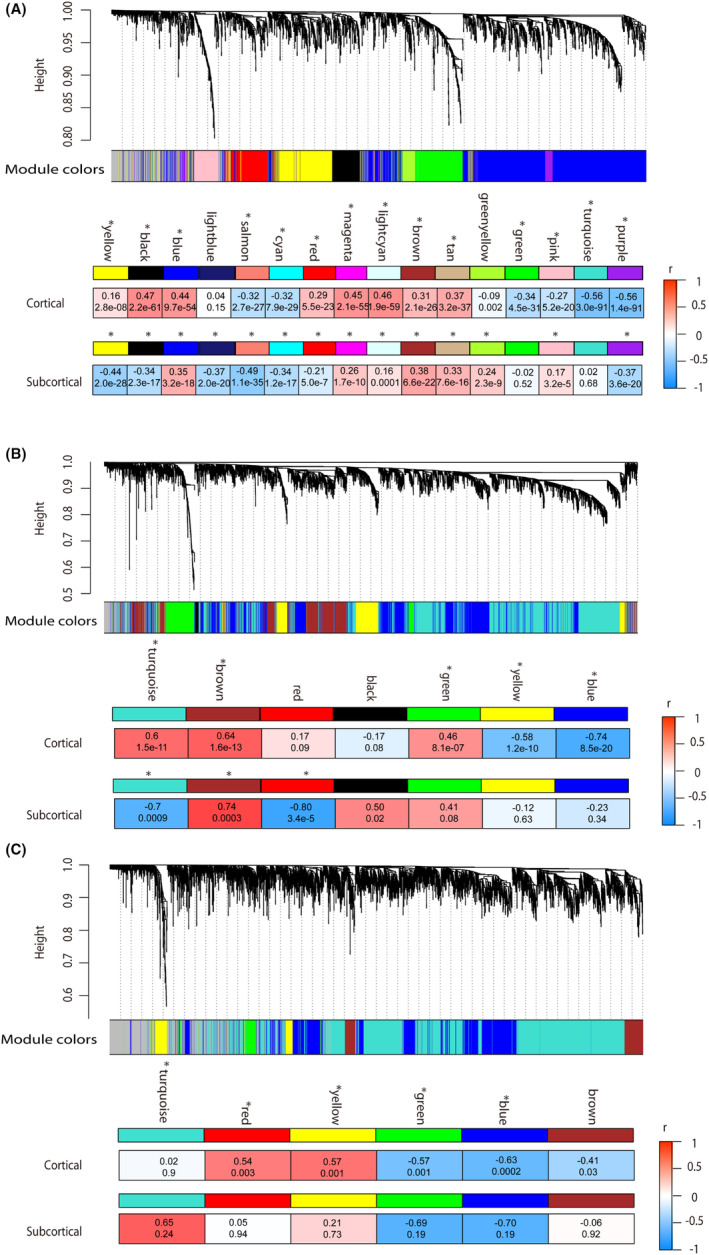
Methods: A cohort of 103 individuals with diagnosed schizophrenia and 110 healthy controls underwent resting-state functional MRI scans. Spontaneous brain activity was assessed using the regional homogeneity (ReHo) metric at four spatial scales: voxel-level (Scale 1) and regional-level (Scales 2-4: 272, 53, 17 regions, respectively). For each spatial scale, multivariate pattern analysis was performed to classify schizophrenia patients from healthy controls, and a transcriptome-neuroimaging association analysis was performed to establish connections between gene expression data and ReHo alterations in schizophrenia.
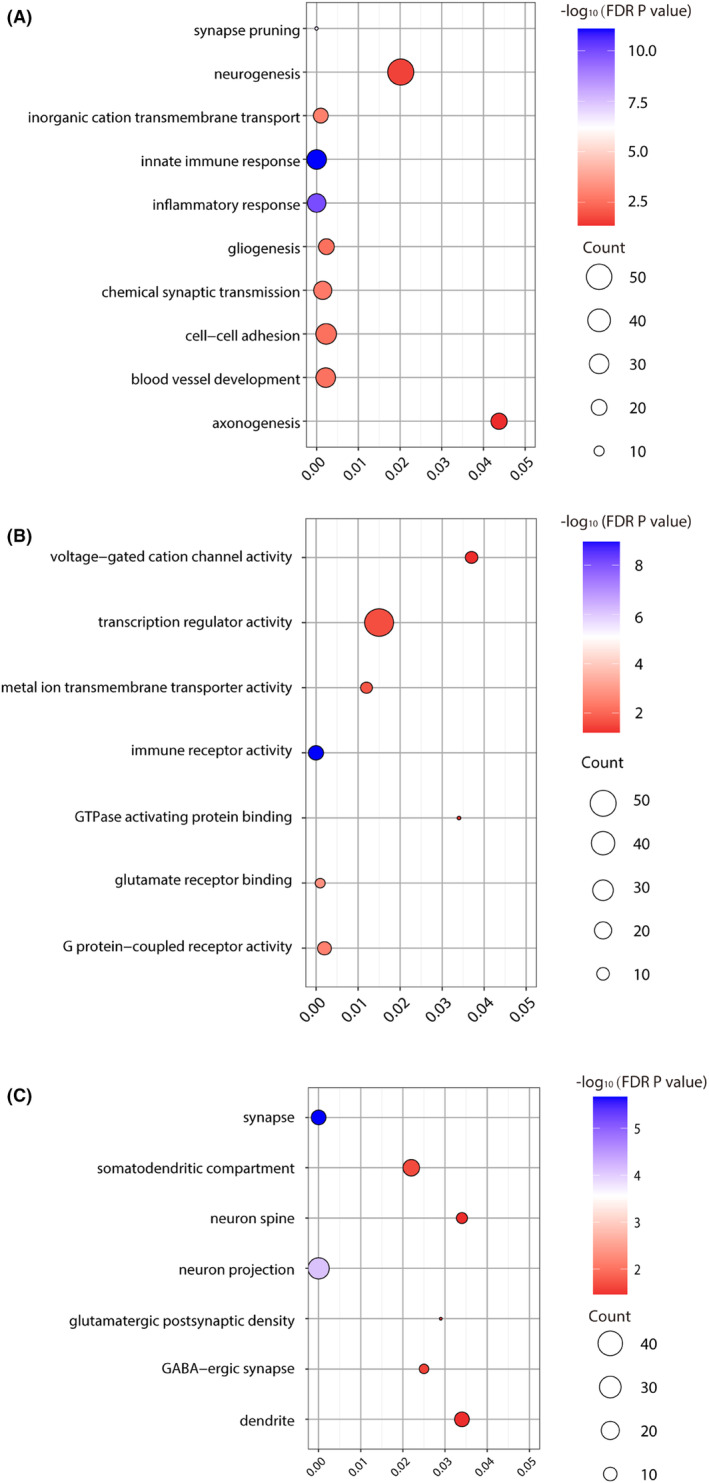
Results: The ReHo metrics at all spatial scales effectively discriminated schizophrenia from healthy controls. Scale 2 showed the highest classification accuracy at 84.6%, followed by Scale 1 (83.1%) and Scale 3 (78.5%), while Scale 4 exhibited the lowest accuracy (74.2%). Furthermore, the transcriptome-neuroimaging association analysis showed that there were not only shared but also unique enriched biological processes across the four spatial scales. These related biological processes were mainly linked to immune responses, inflammation, synaptic signaling, ion channels, cellular development, myelination, and transporter activity.
Conclusions: This study highlights the potential of multi-scale ReHo as a valuable neuroimaging biomarker in the diagnosis of schizophrenia. By elucidating the complex molecular basis underlying the ReHo alterations of this disorder, this study not only enhances our understanding of its pathophysiology, but also pave the way for future advancements in genetic diagnosis and treatment of schizophrenia.
Keywords: gene expression; multiscale analysis; multivariate pattern analysis; regional homogeneity; schizophrenia.
© 2024 The Author(s). CNS Neuroscience & Therapeutics published by John Wiley & Sons Ltd.
Conflict of interest statement
The authors have no conflict of interest to declare.
Figures
Similar articles
-
Systemic pharmacological treatments for chronic plaque psoriasis: a network meta-analysis.Cochrane Database Syst Rev. 2021 Apr 19;4(4):CD011535. doi: 10.1002/14651858.CD011535.pub4. Cochrane Database Syst Rev. 2021. Update in: Cochrane Database Syst Rev. 2022 May 23;5:CD011535. doi: 10.1002/14651858.CD011535.pub5. PMID: 33871055 Free PMC article. Updated.
-
Sertindole for schizophrenia.Cochrane Database Syst Rev. 2005 Jul 20;2005(3):CD001715. doi: 10.1002/14651858.CD001715.pub2. Cochrane Database Syst Rev. 2005. PMID: 16034864 Free PMC article.
-
Systemic pharmacological treatments for chronic plaque psoriasis: a network meta-analysis.Cochrane Database Syst Rev. 2020 Jan 9;1(1):CD011535. doi: 10.1002/14651858.CD011535.pub3. Cochrane Database Syst Rev. 2020. Update in: Cochrane Database Syst Rev. 2021 Apr 19;4:CD011535. doi: 10.1002/14651858.CD011535.pub4. PMID: 31917873 Free PMC article. Updated.
-
The Black Book of Psychotropic Dosing and Monitoring.Psychopharmacol Bull. 2024 Jul 8;54(3):8-59. Psychopharmacol Bull. 2024. PMID: 38993656 Free PMC article. Review.
-
MarkVCID cerebral small vessel consortium: II. Neuroimaging protocols.Alzheimers Dement. 2021 Apr;17(4):716-725. doi: 10.1002/alz.12216. Epub 2021 Jan 21. Alzheimers Dement. 2021. PMID: 33480157 Free PMC article.
Cited by
-
Multi-feature fusion RFE random forest for schizophrenia classification and treatment response prediction.Sci Rep. 2025 Mar 12;15(1):8594. doi: 10.1038/s41598-025-89359-5. Sci Rep. 2025. PMID: 40075170 Free PMC article.
References
-
- Millan MJ, Andrieux A, Bartzokis G, et al. Altering the course of schizophrenia: progress and perspectives. Nat Rev Drug Discov. 2016;15(7):485‐515. - PubMed
-
- McCutcheon RA, Reis Marques T, Howes OD. Schizophrenia—an overview. JAMA Psychiatry. 2020;77(2):201‐210. - PubMed
-
- Hjorthøj C, Stürup AE, McGrath JJ, Nordentoft M. Years of potential life lost and life expectancy in schizophrenia: a systematic review and meta‐analysis. Lancet Psychiatry. 2017;4(4):295‐301. - PubMed
Publication types
MeSH terms
Substances
Grants and funding
- TJYXZDXK-001A/Tianjin Key Medical Discipline (Specialty) Construction Project
- 21JCQNJC01480/Natural Scientific Foundation of Tianjin
- TJSQNYXXR-D2-143/Tianjin Healthy High Level Talent Selection and Training Project
- 82072001/National Natural Science Foundation of China
- 82202093/National Natural Science Foundation of China
LinkOut - more resources
Full Text Sources
Medical
