. 2024 Nov;23(11):e14301.
doi: 10.1111/acel.14301. Epub 2024 Aug 8.

A defective splicing machinery promotes senescence through MDM4 alternative splicing

Affiliations

A defective splicing machinery promotes senescence through MDM4 alternative splicing

Mathieu Deschênes et al. Aging Cell. 2024 Nov.

Abstract

Defects in the splicing machinery are implicated in various diseases, including cancer. We observed a general reduction in the expression of spliceosome components and splicing regulators in human cell lines undergoing replicative, stress-induced, and telomere uncapping-induced senescence. Supporting the view that defective splicing contributes to senescence, splicing inhibitors herboxidiene, and pladienolide B induced senescence in normal and cancer cell lines. Furthermore, depleting individual spliceosome components also promoted senescence. All senescence types were associated with an alternative splicing transition from the MDM4-FL variant to MDM4-S. The MDM4 splicing shift was reproduced when splicing was inhibited, and spliceosome components were depleted. While decreasing the level of endogenous MDM4 promoted senescence and cell survival independently of the MDM4-S expression status, cell survival was also improved by increasing MDM4-S. Overall, our work establishes that splicing defects modulate the alternative splicing of MDM4 to promote senescence and cell survival.

Keywords: MDM4; RNA; alternative splicing; senescence; spliceosome; splicing factors.


Conflict of interest statement

The authors declare no competing interests.

Figures
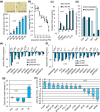
FIGURE 1
FIGURE 1
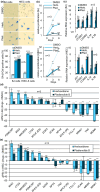
Replicative senescence is associated with a global downregulation of splicing factors. (a) BJ cells were stained with the X‐gal chromogenic substrate using the senescence‐associated β‐Galactosidase (SA‐β‐Gal) method. Positive and negative cells were individually counted in 5 randomly picked pictures for each population. Samples were statistically compared to PD 19. (b) The doubling rate of BJ cells at various PDs was quantified using the Crystal Violet staining assay. Each population was cultured for 4 days before data acquisition. The doubling rate is defined as the average amount of doublings per day achieved between day 0 and day 4 (PD/day). Each sample was statistically compared to PD 19. (c) Relative expression of senescence RNA markers in BJ cells was quantified with qRT‐PCR where values for low PD BJ cells were set to 1.0. Data from higher PD were statistically compared to data from lower PD. (d) RNAseq was performed on duplicate sets of BJ cells at PD 18 and 63. Transcripts were considered repressed or overexpressed when log2 of senescent TPM/young TPM were < −0.5 or >0.5, respectively. Only transcripts with TPM >5 in at least one sample were considered. (total = all transcripts; tsc.F = transcription factors; SpC = spliceosome components; SpR = splicing regulators). (e, f) Relative RNA expression of spliceosome components (e) and splicing regulators (f) was assessed by qRT‐PCR. Values obtained from BJ cells of low PD were set to 1.0. (g) Percent Spliced‐In (PSI) of individual alternative splicing events and splicing modes were obtained by the Plateforme RNomique de l'Université de Sherbrooke. Only events with |ΔPSI| >5% were considered. For each splicing mode, PSIs (long variant)/(long + short) × 100 were multiplied by the respective gene expression level (TPM) and their sum from duplicates generated an abundance index normalized in percent change compared to low PD BJ cells. (5'ss = 5′ alternative splice site; 3'ss = 3′ alternative splice site; ES = exon skipping; IR = intron retention). (h) Alternative splicing events were validated by endpoint RT‐PCR. ΔPSI is defined as the difference between the PSI from test group and the control group. Statistical analysis was performed on PSI only. (MYLK (IR) = intron retention event in MYLK; MYLK (ES) = novel exon skipping event in MYLK). Quiescent low PD BJ cells were generated by contact inhibition (100% confluency). Means were compared using Student's t‐test. *p‐value <0.05, **p‐value <0.01, ***p‐value <0.001.
FIGURE 2
FIGURE 2
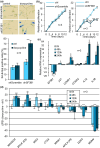
Stress‐induced premature senescence is associated with a decrease in the expression of splicing factors and changes in alternative splicing. (a–c) Relative expression of senescence RNA markers (left) in BJ (a), WI‐38 (b) and HCT116 (c) cells was quantified by qRT‐PCR where mock‐treated samples were set to 1.0. Proliferation rate (right) was quantified using the Crystal Violet staining assay. Values obtained from cells treated with hydrogen peroxide were statistically compared to mock values of corresponding timepoints. (d–f) Relative expression of splicing factors in BJ (d), WI‐38 (e) and HCT116 (f) cells was quantified with qRT‐PCR where mock samples were set to 1.0. (g–i) Alternative splicing events in BJ (g), WI‐38 (h) and HCT116 (i) cells were quantified by endpoint RT‐PCR to obtain ΔPSI values. Statistical analysis was performed on PSI only. BJ (top panels), WI‐38 (middle panels) and HCT116 (bottom panels) cells were treated with hydrogen peroxide and compared to mock‐treated samples. Means were compared using Student's t‐test. *p‐value <0.05, **p‐value <0.01, ***p‐value <0.001.
FIGURE 3
FIGURE 3
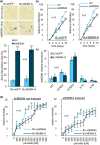
Splicing inhibition induces senescence. (a) BJ (left) and HIEC (right) cells were stained using the SA‐β‐Gal method. (b) Proliferation rate of BJ (top) and HIEC (bottom) cells was quantified using the Crystal Violet staining assay. Each sample was statistically compared with the DMSO sample at the corresponding timepoint. (c) Relative expression of senescence RNA markers in BJ (top) and HIEC (bottom) cells was quantified with qRT‐PCR where DMSO samples were set to 1.0. (d, e) Alternative splicing events were quantified by endpoint RT‐PCR in BJ (d) and HIEC cells (e). Statistical analysis was performed on PSI only. All treatments with Herboxidiene (Herb.) and Pladienolide B (Plad.) were performed at concentrations between 5 and 10 nM for a 6‐day duration (10 nM: BJ, IMR‐90, WI‐38. 5 nM: HIEC, HCT116). Samples were statistically compared to DMSO‐treated cells. Means were compared using Student's t‐test. *p‐value <0.05, **p‐value <0.01, ***p‐value <0.001.
FIGURE 4
FIGURE 4
A deficit in SF3B1 induces senescence. (a) BJ cells were stained using the SA‐β‐Gal method. (b) Proliferation rate was measured with the Crystal Violet staining assay. The values obtained for each sample were statistically compared with control group values at corresponding timepoints. (c) Relative expression of senescence RNA markers and shRNA targets was quantified with qRT‐PCR where samples taken at t = 0 were set to 1.0. Data for individual transcript were statistically compared to t = 0. (d) Alternative splicing events were quantified by endpoint RT‐PCR. Statistical analysis was performed on PSI only. Doxycycline induction of shRNAs targeting spliceosome components was performed for a 10‐day duration, unless indicated otherwise. Means were compared using Student's t‐test. *p‐value <0.05, **p‐value <0.01, ***p‐value <0.001.
FIGURE 5
FIGURE 5
MDM4 alternative splicing regulates senescence and survival. (a) BJ‐eGFP (left) and BJ‐MDM4‐S (right) cells were stained using the SA‐β‐Gal method. (b) Proliferation rate was measured using the Crystal Violet staining assay. Data from induced cells was statistically compared to non‐induced samples of corresponding timepoints. (c) Relative expression of senescence RNA markers in shRNA‐induced cells was quantified in BJ‐eGFP and BJ‐MDM4‐S cells by qRT‐PCR. Data for each gene was normalized and statistically compared to non‐induced samples. (d) Survival was monitored using the Promega CellTox™ kit in BJ‐shMDM4 and BJ‐MDM4‐S cells treated with the indicated concentration of hydrogen peroxide for 2 h. BJ‐shMDM4 was used as control instead of BJ‐eGFP to avoid eGFP interference with the Promega CellTox™ kit. BJ‐shMDM4 and BJ‐MDM4‐S were either non‐induced (left panel) or induced (right panel) for 24 h following hydrogen peroxide treatment. Data were normalized to non‐treated samples (NT). Mortality values from BJ‐MDM4‐S were statistically compared to those of BJ‐shMDM4 at corresponding hydrogen peroxide concentrations. Doxycycline induction was performed for 10 days. BJ cells were infected for the inducible expression of a shRNA targeting all variants of MDM4. BJ‐shMDM4 were infected to express constitutively eGFP (BJ‐eGFP) or MDM4‐S (BJ‐MDM4‐S). Means were compared using Student's t‐test. *p‐value <0.05, **p‐value <0.01, ***p‐value <0.001.

References

    1. Acosta, J. C. , Banito, A. , Wuestefeld, T. , Georgilis, A. , Janich, P. , Morton, J. P. , Athineos, D. , Kang, T.‐W. , Lasitschka, F. , Andrulis, M. , Pascual, G. , Morris, K. J. , Khan, S. , Jin, H. , Dharmalingam, G. , Snijders, A. P. , Carroll, T. , Capper, D. , Pritchard, C. , … Gil, J. (2013). A complex secretory program orchestrated by the inflammasome controls paracrine senescence. Nature Cell Biology, 15(8), 978–990. 10.1038/ncb2784 - DOI - PMC - PubMed
    1. Allsopp, R. C. , Vaziri, H. , Patterson, C. , Goldstein, S. , Younglai, E. V. , Futcher, A. B. , Greider, C. W. , & Harley, C. B. (1992). Telomere length predicts replicative capacity of human fibroblasts. Proceedings of the National Academy of Sciences of the United States of America, 89(21), 10114–10118. - PMC - PubMed
    1. Alsafadi, S. , Houy, A. , Battistella, A. , Popova, T. , Wassef, M. , Henry, E. , Tirode, F. , Constantinou, A. , Piperno‐Neumann, S. , Roman‐Roman, S. , Dutertre, M. , & Stern, M.‐H. (2016). Cancer‐associated SF3B1 mutations affect alternative splicing by promoting alternative branchpoint usage. Nature Communications, 7(1), 10615. 10.1038/ncomms10615 - DOI - PMC - PubMed
    1. AlShareef, S. , Ling, Y. , Butt, H. , Mariappan, K. G. , Benhamed, M. , & Mahfouz, M. M. (2017). Herboxidiene triggers splicing repression and abiotic stress responses in plants. BMC Genomics, 18(1), 260. 10.1186/s12864-017-3656-z - DOI - PMC - PubMed
    1. Anczuków, O. , & Krainer, A. R. (2015). The spliceosome, a potential Achilles heel of MYC‐driven tumors. Genome Medicine, 7(1), 107. 10.1186/s13073-015-0234-3 - DOI - PMC - PubMed