. 2024 Sep 1;151(17):dev202194.
doi: 10.1242/dev.202194. Epub 2024 Sep 5.

Developing long bones respond to surrounding tissues by trans-pairing of periosteal osteoclasts and endocortical osteoblasts

Affiliations

Developing long bones respond to surrounding tissues by trans-pairing of periosteal osteoclasts and endocortical osteoblasts

Yukiko Kuroda et al. Development. .

Abstract

Developing long bones alter their shape while maintaining uniform cortical thickness via coordinated activity of bone-forming osteoblasts and bone-resorbing osteoclasts at periosteal and endosteal surfaces, a process we designate trans-pairing. Two types of trans-pairing shift cortical bone in opposite orientations: peri-forming trans-pairing (peri-t-p) increases bone marrow space and endo-forming trans-pairing (endo-t-p) decreases it, via paired activity of bone resorption and formation across the cortex. Here, we focused on endo-t-p in growing bones. Analysis of endo-t-p activity in the cortex of mouse fibulae revealed osteoclasts under the periosteum compressed by muscles, and expression of RANKL in periosteal cells of the cambium layer. Furthermore, mature osteoblasts were localized on the endosteum, while preosteoblasts were at the periosteum and within cortical canals. X-ray tomographic microscopy revealed the presence of cortical canals more closely associated with endo- than with peri-t-p. Sciatic nerve transection followed by muscle atrophy and unloading induced circumferential endo-t-p with concomitant spread of cortical canals. Such canals likely supply the endosteum with preosteoblasts from the periosteum under endo-t-p, allowing bone shape to change in response to mechanical stress or nerve injury.

Keywords: Cortical canals; Modeling drift; Osteoblasts; Osteoclasts; Sciatic nerve transection; Trans-cortical vessels.


Conflict of interest statement

Competing interests The authors declare no competing or financial interests.

Figures

Fig. 1.
Fig. 1.
Trans-pairing across the fibular cortex in P9 mice. (A) Lateral view of the right tibia (Ti) and fibula (Fi) from a P9 female mouse. TFJ, tibia-fibula junction. Scale bar: 1 mm. (B) Whole-mount TRAP staining of a lower hindlimb of a female P9 mouse. Dotted lines at 2.5 mm and 0.5 mm from the TFJ indicate cross-section levels assessed in C-F. Arrows indicate TRAP-positive periosteal surfaces. Scale bar: 1 mm. lat, lateral; prox, proximal; ant, anterior; post, posterior. (C-F) Immunofluorescence detection of osteoclasts (magenta; MMP9 positive) and osteoblasts (green; osteocalcin positive) in frozen cross-sections of undecalcified tibia and fibula at the 2.5 mm (C,E) and 0.5 mm (D,F) levels isolated from P9 mice (four female). DAPI nuclear stain is in blue. Scale bars: 200 µm in C,D; 50 µm in E,F (higher magnifications of C,D). BM, bone marrow; Cort, cortical bone; peri, periosteum; endo, endosteum; OB, osteoblast; OC, osteoclast. Arrows indicate periosteal resorption surfaces. Arrowheads indicate endocortical resorption surfaces.
Fig. 2.
Fig. 2.
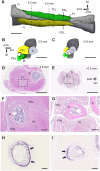
Periosteal bone resorption occurs at areas corresponding to muscle compression. (A) Micro-CT image of right lower hindlimb of a P9 male mouse, created through digital segmentation of I2KI-enhanced muscles surrounding the fibula (Fi). FDL, flexor digitorum/hallucis longus; Pt, peroneus tertius; Pdq, peroneus digiti quarti; Ti, tibia. Scale bar: 1 mm. (B,C) Cross-sectional views at 2.5 mm (B) and 0.5 mm (C) proximal to the tibia-fibula junction (TFJ) of A. Scale bars: 1 mm. (D,E) Hematoxylin and Eosin staining of cross-sections at 2.5 mm (D) and 0.5 mm (E) from the TFJ in a P9 male mouse. Scale bars: 1 mm. (F) Higher magnification of area outlined in D. Scale bar: 100 µm. (G) Higher magnification of area outlined in E. Scale bar: 100 µm. (H,I) TRAP activity staining of sections adjacent to F and G, respectively. Scale bars: 100 µm. Arrows indicate TRAP-positive periosteal surfaces.
Fig. 3.
Fig. 3.
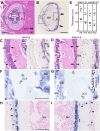
Tnfsf11 (RANKL) is expressed in cambium cells of the fibular periosteum covered by muscle. (A) Hematoxylin and Eosin staining of fibula cross-sections at 2.5 mm from the tibia-fibula junction (TFJ) in a P16 male mouse. FDL, flexor digitorum/hallucis longus; Pt, peroneus tertius; Pdq, peroneus digiti quarti; BM, bone marrow. Scale bar: 100 µm. (B) TRAP activity staining of sections adjacent to A. Arrows indicate robust TRAP activity. Scale bar: 100 µm. (C,D) Magnified view of peri-t-p (C) and endo-t-p (D) regions in A and B. Periosteal thickness is indicated by arrows. Dashed line indicates the periosteal surface in C and the endocortical surface in D. Scale bars: 25 µm. (E) Periosteal thickness at peri- and endo-t-p fibular cortices from P9, P16, P23 and P30 male mice (n=4 slices for each age of mouse). Horizontal lines indicate mean value of each group. (F,G) In situ hybridization of Tnfsf11 in peri-t-p (F) and endo-t-p (G) cortices of fibula at 2.5 mm from the TFJ in a P16 mouse (two male) indicates Tnfsf11 positivity. OCY, osteocyte. Scale bar: 25 µm. (H,I) In situ hybridization of Col1a1 in peri-t-p (H) and endo-t-p (I) cortices of fibula at 3.0 mm from TFJ in a P16 mouse (two male). Scale bar: 50 µm. Arrowheads indicate preosteoblasts weakly positive for Col1a1 detected at the periosteum of peri-t-p cortex, as well as at the periosteum and in cortical canals of endo-t-p cortex.
Fig. 4.
Fig. 4.
Phase-contrast X-ray tomographic microscopy of peri- and endo-t-p cortices. (A) 3D morphology of right fibula 0.5-1 mm proximal to the tibia-fibula junction (TFJ) of a P9 male mouse. Scale bar: 100 µm. Plus signs indicate exposed osteocyte lacunae. Asterisks indicate canals across cortical bone. ant, anterior; post, posterior; med, medial; dist, distal; NF, nutrient foramen. (B) Cylindrical panoramic image including duplicated anterior regions of the endocortical surface of the fibula shown in A. Asterisks and arrowheads indicate cortical canals in endo-t-p and peri-t-p cortices, respectively. (C) Analysis of canal diameter within peri- and endo-t-p cortices of fibulae (n=4, female and male mice) at 0.5 to 1 mm above the TFJ. Statistical analysis was performed using a Mann–Whitney U test. (D) Cortical canal density in peri-t-p or endo-t-p cortex of fibula analyzed in C. Statistical analysis was performed using a paired t-test.
Fig. 5.
Fig. 5.
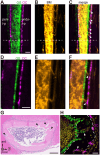
Cortical canals contain capillary vessels, osteoclasts and osteoblasts. (A-C) Lightsheet fluorescence microscopy detection of osteoblasts (OB, green; Col1a1-AcGFP positive), osteoclasts (OC, magenta; TRAP-tdTomato positive) and the vasculature (orange; tomato lectin positive) in P16 fibula [at ∼1.5 mm above the tibia-fibula junction (TFJ)] of TRAP-tdTomato:Col1a1-AcGFP mice (male and female) injected with tomato lectin. 100 µm projection images are shown. Both peri- and endo-t-p are detectable above dashed line. Arrowheads indicate trans-cortical vessels. BM, bone marrow. Scale bar: 100 µm. (D-F) Magnified 10 µm projection images taken at the endo-t-p cortex. Scale bar: 100 µm. (G) Hematoxylin and Eosin staining of cross-sections of fibula 4 mm above the TFJ in a P30 male mouse. Arrowheads indicate cortical canals. Scale bar: 100 µm. (H) Cellular localization of osteoblasts (green, osteocalcin-positive) and osteoclasts (magenta, TRAP-tdTomato-positive) in cortical bone of fibula 4 mm above the TFJ in a P28 male mouse. DAPI nuclear stain is in yellow. Arrowheads indicate osteoclasts (magenta) or osteoblasts (green) within canals. Dashed lines indicate edges of cortical bone. Scale bar: 20 µm.
Fig. 6.
Fig. 6.
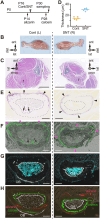
Sciatic nerve transection (SNT) abolishes directional pairing of bone resorption and formation. (A) Schematic showing timeline of SNT. (B) Control (Cont) sham-operated left (L) hindlimb (left); right (R) hindlimb (right) subjected to SNT at P16. Both were analyzed 2 weeks later. There is muscle atrophy of the SNT hindlimb (n=5 mice, two female and three male). lat, lateral; dist, distal; ant, anterior. (C-G) Histological analyses of SNT and control hindlimbs described above. (C-E) Paraffin-embedded cross-sections at 3.5 mm from the tibia-fibula junction (TFJ). (C) Hematoxylin and Eosin staining of fibula (f) and tibia (t) of a male mouse. Scale bars: 1 mm. (D) Periosteal thickness at anterior cortices of Cont (n=2) and SNT fibulae (n=3) from male and female mice. A total of five paraffin-embedded sections were measured for each group. Horizontal lines indicate mean value of each group. (E) TRAP activity staining. Arrowheads and arrows indicate periosteal and endocortical bone resorption surfaces, respectively. Scale bars: 100 µm. (F-H) Frozen sections of fibula of a female mouse 4.5 mm from the TFJ. (F) TRAP activity staining using ELF97 as substrate (green). Arrowheads and arrows indicate periosteal and endocortical bone resorption surfaces, respectively. Scale bars: 100 µm. (G) Osteocalcin immunostaining (white) and DAPI staining (cyan). Scale bars: 100 µm. (H) Labeling of bone with alizarin complexone (red) and calcein (green). Also shown is osteocalcin immunostaining (white). Scale bars: 100 µm. G is the same frozen section as H without showing alizarin and calcein labeling.
Fig. 7.
Fig. 7.
Circumferential spreading of cortical canals after SNT. (A) Proximal nano-CT views of control and SNT samples of a 1.27 mm section of fibula centered 4 mm above the tibia-fibula junction (TFJ). Scale bars: 100 µm. (B) Cortical canals (yellow) segmented from nano-CT images shown in A. Canals are spread more widely in SNT versus control fibulae. Scale bars: 100 µm. (C) Anterior (ant) and posterior (post) views of control and SNT samples from bone marrow. The cutting plane at the center of the fibula is the dashed line shown in B. Scale bars: 100 µm. (D) Cortical canal location. Each circle indicates orientation of a cortical canal viewed from the center of the bone marrow cavity on the same proximodistal level as in A plotted against the z-axis. Different mice (n=4, two female and two male) are distinguished by color saturation. The posterior half of the fibula, which has absolute angles greater than 90°, is highlighted in green. (E) Polar histogram of cortical canal localization shown in D. The percentage of canals located in anterior or posterior halves is also shown. The percentage in the posterior half is significantly higher in SNT(R) than in Cont (L), based on a paired t-test (P=0.033).
Fig. 8.
Fig. 8.
Cortical canals serve as a cellular pathway supplying preosteoblasts from the periosteum to the endosteum in the endo-t-p cortex. (A) Schematic showing timeline of tamoxifen injection and sampling of Gli1-CreERT2; Ai14 mice. Female and male mice were collected at early (TM+24 h) and late (TM+2 w) timepoints. TM, tamoxifen. (B,C) Representative cross-sectional images of fibula at early (B) and late (C) timepoints after tamoxifen administration. Dashed lines indicate the boundary between endo- and peri-t-p cortices. Top images (TD for transmitted light differential interference contrast) and the middle images (confocal) were obtained from the same section. The bottom images are magnified views of areas outlined in the middle images showing the endo-t-p cortex. tdTomato-positive cells are visible at the periosteum (arrows) and at the endosteum (arrowheads). BM, bone marrow. Scale bars: 100 µm. (D) Localization of tdTomato-positive cells (magenta, arrowheads) and endothelial cells (yellow, CD31-positive) in the endo-t-p cortex of fibula at the late timepoint. Scale bars: 20 μm. (E) Summary of trans-pairing during bone modeling or bone drift. Bone drift occurs when endo- and peri-t-p occur simultaneously. Cortical bone undergoing periosteal bone resorption and endocortical bone formation, i.e. endo-t-p, exhibits more and larger cortical canals than bone undergoing peri-t-p. Cortical canals, which serve as pathways for capillary vessels, may also facilitate endocortical bone formation by supplying preosteoblasts (preOBs) from the periosteum to the endosteum.

References

    1. Ahn, S. and Joyner, A. L. (2004). Dynamic changes in the response of cells to positive hedgehog signaling during mouse limb patterning. Cell 118, 505-516. 10.1016/j.cell.2004.07.023 - DOI - PubMed
    1. Allen, M. R. and Burr, D. B. (2019). Chapter 5 - Bone growth, modeling, and remodeling. In Basic and Applied Bone Biology (ed. Allen M. R. and Burr D. B.) pp. 85-100. Academic Press.
    1. Asghar, A., Kumar, A., Kant Narayan, R. and Naaz, S. (2020). Is the cortical capillary renamed as the transcortical vessel in diaphyseal vascularity? Anat. Rec. 303, 2774-2784. 10.1002/ar.24461 - DOI - PubMed
    1. Birkhold, A. I., Razi, H., Duda, G. N., Weinkamer, R., Checa, S. and Willie, B. M. (2016). The periosteal bone surface is less mechano-responsive than the endocortical. Sci. Rep. 6, 23480. 10.1038/srep23480 - DOI - PMC - PubMed
    1. Birkhold, A. I., Razi, H., Duda, G. N., Checa, S. and Willie, B. M. (2017). Tomography-based quantification of regional differences in cortical bone surface remodeling and mechano-response. Calcif. Tissue Int. 100, 255-270. 10.1007/s00223-016-0217-4 - DOI - PubMed

LinkOut - more resources