. 2024 Oct;11(38):e2402550.
doi: 10.1002/advs.202402550. Epub 2024 Aug 9.

SEC16A Variants Predispose to Chronic Pancreatitis by Impairing ER-to-Golgi Transport and Inducing ER Stress

Affiliations

SEC16A Variants Predispose to Chronic Pancreatitis by Impairing ER-to-Golgi Transport and Inducing ER Stress

Min-Jun Wang et al. Adv Sci (Weinh). 2024 Oct.

Abstract

Chronic pancreatitis (CP) is a complex disease with genetic and environmental factors at play. Through trio exome sequencing, a de novo SEC16A frameshift variant in a Chinese teenage CP patient is identified. Subsequent targeted next-generation sequencing of the SEC16A gene in 1,061 Chinese CP patients and 1,196 controls reveals a higher allele frequency of rare nonsynonymous SEC16A variants in patients (4.90% vs 2.93%; odds ratio [OR], 1.71; 95% confidence interval [CI], 1.26-2.33). Similar enrichments are noted in a French cohort (OR, 2.74; 95% CI, 1.67-4.50) and in a biobank meta-analysis (OR, 1.16; 95% CI, 1.04-1.31). Notably, Chinese CP patients with SEC16A variants exhibit a median onset age 5 years earlier than those without (40.0 vs 45.0; p = 0.012). Functional studies using three CRISPR/Cas9-edited HEK293T cell lines show that loss-of-function SEC16A variants disrupt coat protein complex II (COPII) formation, impede secretory protein vesicles trafficking, and induce endoplasmic reticulum (ER) stress due to protein overload. Sec16a+/- mice, which demonstrate impaired zymogen secretion and exacerbated ER stress compared to Sec16a+/+, are further generated. In cerulein-stimulated pancreatitis models, Sec16a+/- mice display heightened pancreatic inflammation and fibrosis compared to wild-type mice. These findings implicate a novel pathogenic mechanism predisposing to CP.

Keywords: SEC16A; disease predisposition; endoplasmic reticulum stress; pancreatitis; protein vesicle trafficking.


Conflict of interest statement

The authors declare no conflict of interest.

Figures

Figure 1
Figure 1
Association of rare SEC16A variants with CP and influence on age of onset. A) Forest plots illustrating the distribution of rare SEC16A variant alleles across multiple cohorts. This includes the Chinese discovery cohort, the French replication cohort, and three publicly available biobanks. Additionally, meta‐analytic data combining these various sources are presented. AC, allele count; AN, allele number; AF, allele frequency; OR, odds ratio; CI, confidence interval. B) Kaplan–Meier plots showing the impact of rare SEC16A variants on the age of onset of pancreatitis symptoms in Chinese patients with known pathogenic SPINK1, PRSS1, CTRC and/or CFTR genotypes. The red curve represents patients carrying rare SEC16A variants, whereas the blue curve denotes patients without these variants. C) Kaplan–Meier plots depicting the influence of rare SEC16A variants on the age of onset of pancreatitis symptoms in Chinese patients who lack known pathogenic SPINK1, PRSS1, CTRC and/or CFTR genotypes. Consistent with panel B, the red curve depicts patients with rare SEC16A variants whereas the blue curve represents those without these variants.
Figure 2
Figure 2
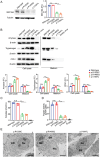
Impact of rare SEC16A variants on protein expression. A) SEC16A expression in CRISPR/Cas9‐edited mutant HEK293T cell lines. Left panel: A representative Western blot displaying SEC16A expression in cell lysates from both wild‐type and three HEK293T mutant cell lines. Right panel: Quantitative analysis of SEC16A expression levels in the mutant cell lines, normalized against tubulin and compared to that (set at 1) in the wild‐type cells. FC, fold change. B) Effect of rare SEC16A variants on secretion of exogenously expressed pancreatic zymogens. Upper panels: Immunoblots of cell lysates and media from both wild‐type and mutant SEC16A HEK293T cells expressing AMY2A, PRSS1, and CPA1 through lentiviral infection. The “Empty virus” group serves as the control, comprising uninfected HEK293T cells. Lower panels: Quantitative analysis of amylase, trypsinogen, and CPA1 expression (normalized to actin) in lysate and media of infected mutant cells versus wild‐type. Expression in wild‐type cells is set at 1. FC, fold change. C) Comparison of exogenously expressed amylase activity levels in the supernatant of mutant cell lines relative to wild‐type cells. D) Analysis of exogenously expressed trypsin activity levels in the supernatant of mutant cell lines compared to wild‐type cells. E) Ultrastructure examination of variant SEC16A HEK293T cells under transmission electron microscopy (TEM). Secretory vesicles are indicated with arrows. Scale bar represents 5 µm. All experiments were conducted using cell lines homozygous for the respective variants. For panels showing quantitative data, values are expressed as mean ± SD. Statistical significance is denoted as n.s. (not significant) and ** (p < 0.01), determined using one‐way ANOVA with Tukey's multiple comparisons test.
Figure 3
Figure 3
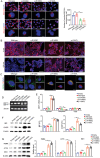
Disruption of COPII vesicle organization and ER Stress induced by SEC16A variants. A) Visualization of SEC16A‐ or SEC31A‐positive structures in CRISPR/Cas9‐edited mutant HEK293T cell lines. Left panel: Representative images of HEK293T wild‐type and SEC16A variant cells infected with AMY2A virus, immunostained for SEC16A or SEC31A. Scale bar: 50 µm for low‐power field and 10 µm for magnification (THUNDER Imagers, Mica). Right panel: Quantitative analysis of the average number of SEC31A‐positive structures in wild‐type versus mutant cells, based on counts from 50 cells per experiment. B) CPA1 expression in cycloheximide‐treated cells. Immunostaining of wild‐type and SEC16A variant HEK293T cells expressing CPA1, before and after 120 min cycloheximide treatment. Blue, DAPI staining for nuclei; red, anti‐V5 staining for CPA1. Scale bar: 100 µm. C) Higher magnification images of CPA1 expression after 120 min cycloheximide treatment (THUNDER Imagers, Mica). Blue, DAPI staining for nuclei; green, anti‐GRP94 for ER; red, anti‐V5 staining for CPA1. Scale bar: 10 µm. D) XBP1 mRNA splicing analysis. Reverse transcription‐PCR analysis of unspliced (U) and spliced (S) XBP1 mRNA in wild‐type and SEC16A mutant cells. E) Quantitative real‐time PCR of XBP1 mRNA. Measurement of spliced, unspliced, and total XBP1 mRNA levels, expressed as fold changes relative to the levels in cells infected with empty adenovirus. F) ER stress markers analysis. Left panel: A representative Western blot analysis of ER stress markers BIP and CHOP in non‐infected cells (empty virus) and infected wild‐type and SEC16A mutant cells. Right panel: Quantification of BIP and CHOP in wild‐type and mutant HEK293T cell lines with exogenous amylase expression, compared to wild‐type cells with no exogenous amylase expression (empty virus control). G) UPR pathway marker analysis. Left panel: A representative Western blot analysis of UPR pathway markers PERK, ATF6, and IRE1 in non‐infected cells (empty virus) and infected wild‐type and SEC16A mutant cells. Right panel: Quantification of UPR pathway markers, compared to empty virus control. FC denotes fold change. All experiments were conducted using cell lines homozygous for the respective variants. For panels showing quantitative data, values represent mean ± SD from three independent experiments. Statistical significance indicated as n.s. (not significant) and ** (p < 0.01), determined using one‐way ANOVA with Tukey's multiple comparisons test.
Figure 4
Figure 4
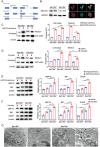
Impact of Sec16a knockout on protein secretion and ER stress in primary pancreatic acini. A) Schematic illustrating the generation of Sec16a knockout mice using CRISPR/Cas9‐mediated non‐homologous end joining. B) Left panel: Western blot analysis of pancreatic tissues from Sec16a +/+ and Sec16a +/− mice. Right panel: Immunofluorescence analysis of Sec16A protein levels (green fluorescence), co‐stained with amylase (acinar marker, red fluorescence) in isolated pancreatic acini from 8‐week‐old Sec16a+/+ and Sec16a+/− mice. Scale bar: 50 µm. C) Left panel: Immunoblots showing amylase levels in lysates and media from cultured pancreatic acinar cells isolated from Sec16a+/+ and Sec16a+/− mice, infected with either AMY2A‐lentivirus or empty lentivirus. Right panel: Graph of amylase expression normalized to actin in the AMY2A‐lentivirus infected group compared to the control group. FC, fold change. D) Left panel: Immunoblots showing amylase levels in lysates and media from cultured pancreatic acinar cells isolated from Sec16a+/+ and Sec16a+/− mice treated with cerulein or saline. Right panel: Graph illustrating amylase levels, normalized to actin, in the cerulein‐treated group relative to the control group. FC, fold change. E) Expression of ER stress markers (XBP1 [spliced], BIP, and CHOP) in cultured pancreatic acinar cells with/without AMY2A‐lentivirus infection. Left: Representative immunoblots. Right: Quantitative analysis. F) Left panel: Immunoblots of ER stress markers (XBP1 [spliced], BIP, and CHOP) in cultured pancreatic acinar cells with/without cerulein stimulation. Right panel: Relative intensity graph. G) Transmission electron microscopy (TEM) images showing ultrastructure changes in isolated pancreatic acinar cells of Sec16a+/+ and Sec16a+/− mice. Arrows highlight unfolded protein accumulation in the ER. Scale bar: 1 µm. For panels with quantitative analysis, data are presented as mean ± SD. Statistical significance determined using two‐way ANOVA with Tukey's test: n.s., not significant; *, p < 0.05; **, p < 0.01.
Figure 5
Figure 5
Genetic knockdown of Sec16a exacerbates cerulein‐induced AP. A) Schematic of the cerulein‐induced AP protocol. B) Comparison of pancreas/body weight ratios in Sec16a+/+ and Sec16a+/− mice following cerulein‐induced AP. C) Serum amylase levels (U/mL) in Sec16a+/+ and Sec16a+/− mice treated with cerulein or saline. D) H&E‐stained pancreas sections from Sec16a+/+ and Sec16a+/− mice treated with cerulin or saline. Scale bar: 100 µm. E) Histology scores of AP in Sec16a+/+ and Sec16a+/− mice. F) Left panel: TUNEL staining (green signal) illustrating apoptosis in Sec16a+/+ and Sec16a+/− mice, with nuclei counterstained using DAPI. Scale bar: 100 µm. Right panel: Quantitative analysis of apoptosis‐positive cells. G) Expression of ER stress markers (XBP1 [spliced] and BIP) in the cerulein‐induced AP model of Sec16a+/+ and Sec16a+/− mice (n = 3). Left: Representative immunoblots. Right: Quantitative analysis. For panels with quantitative analysis, data are presented as mean ± SD (n = 3–6). Statistical significance was assessed using a two‐tailed unpaired Student's t‐test for column analysis and two‐way ANOVA with Tukey's test for grouped analysis: *, p < 0.05; **, p < 0.01.
Figure 6
Figure 6
Enhanced severity of cerulein‐induced CP in Sec16a +/− mice. A) Schematic of the cerulein‐induced CP protocol. B) Pancreas/body weight ratios in Sec16a+/+ and Sec16a+/− mice after cerulein‐induced CP. C) Representative H&E‐stained pancreas sections. Scale bar: 100 µm. D) Sirius red staining of pancreas sections from Sec16a+/+ and Sec16a+/− mice. Scale bar: 100 µm. E) Quantification of positive‐staining areas using ImageJ software. F) Quantification of expression levels of fibrogenic factor genes (Col1a1, Tgfβ, and Fn1) and the proinflammatory factor gene interleukin‐6 (Il6) by quantitative RT‐PCR. G) CK‐19 immunofluorescence staining to evaluate acinar‐to‐ductal metaplasia in pancreata, with nuclei stained blue by DAPI. Scale bar: 100 µm. H) Expression of ER stress markers (XBP1 [spliced] and BIP) in cerulein‐induced CP model of Sec16a+/+ and Sec16a+/− mice (n = 3). Left: Representative immunoblots. Right: Quantitative analysis. All data represent mean ± SD (n = 3–6). *, p < 0.05; **, p < 0.01. Two‐tailed unpaired Student's t‐test for column analysis; two‐way ANOVA with Tukey's test for grouped analysis.

References

    1. Beyer G., Habtezion A., Werner J., Lerch M. M., Mayerle J., Lancet 2020, 396, 499. - PubMed
    1. Petrov M. S., Yadav D., Nat. Rev. Gastroenterol. Hepatol. 2019, 16, 175. - PMC - PubMed
    1. Whitcomb D. C., Gorry M. C., Preston R. A., Furey W., Sossenheimer M. J., Ulrich C. D., Martin S. P., Gates L. K., Amann S. T., Toskes P. P., Liddle R., McGrath K., Uomo G., Post J. C., Ehrlich G. D., Nat. Genet. 1996, 14, 141. - PubMed
    1. Hegyi E., Sahin‐Tóth M., Dig Dis Sci. 2017, 62, 1692. - PMC - PubMed
    1. Sahin‐Tóth M., Curr. Opin. Gastroenterol. 2017, 33, 390. - PMC - PubMed

Substances

LinkOut - more resources