. 2024 Oct;11(38):e2405354.
doi: 10.1002/advs.202405354. Epub 2024 Aug 9.

Hypocretin-1/Hypocretin Receptor 1 Regulates Neuroplasticity and Cognitive Function through Hippocampal Lactate Homeostasis in Depressed Model

Affiliations

Hypocretin-1/Hypocretin Receptor 1 Regulates Neuroplasticity and Cognitive Function through Hippocampal Lactate Homeostasis in Depressed Model

Bing Chen et al. Adv Sci (Weinh). 2024 Oct.

Abstract

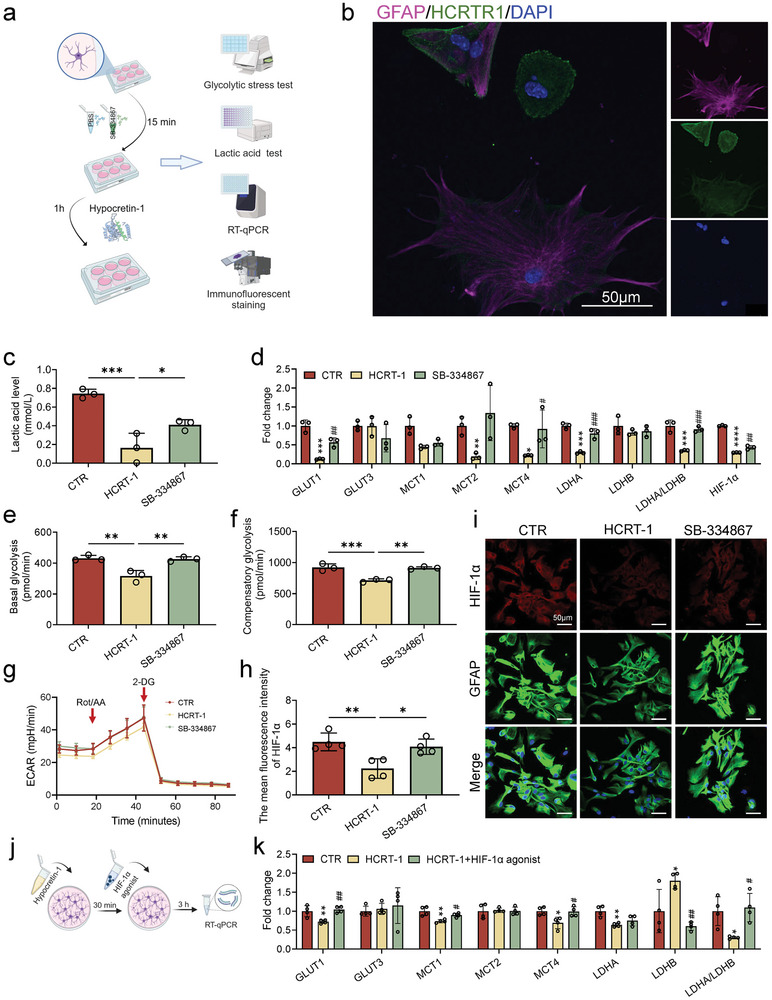
Cognitive dysfunction is not only a common symptom of major depressive disorder, but also a more common residual symptom after antidepressant treatment and a risk factor for chronic and recurrent disease. The disruption of hypocretin regulation is known to be associated with depression, however, their exact correlation is remains to be elucidated. Hypocretin-1 levels are increased in the plasma and hypothalamus from chronic unpredictable mild stress (CUMS) model mice. Excessive hypocretin-1 conducted with hypocretin receptor 1 (HCRTR1) reduced lactate production and brain-derived neurotrophic factor (BDNF) expression by hypoxia-inducible factor-1α (HIF-1α), thus impairing adult hippocampal neuroplasticity, and cognitive impairment in CUMS model. Subsequently, it is found that HCRTR1 antagonists can reverse these changes. The direct effect of hypocretin-1 on hippocampal lactate production and cognitive behavior is further confirmed by intraventricular injection of hypocretin-1 and microPET-CT in rats. In addition, these mechanisms are further validated in astrocytes and neurons in vitro. Moreover, these phenotypes and changes in molecules of lactate transport pathway can be duplicated by specifically knockdown of HCRTR1 in hippocampal astrocytes. In summary, the results provide molecular and functional insights for involvement of hypocretin-1-HCRTR1 in altered cognitive function in depression.

Keywords: cognition; depression; hypocretin‐1; hypoxia‐inducible factor‐1α; lactate.


Conflict of interest statement

The authors declare no conflict of interest.

Figures

Figure 1
Figure 1
Alleviation effects of hypocretin receptor 1 (HCRTR1) antagonist (SB‐334867) on chronic unpredictable mild stress (CUMS)‐induced anxiety and depressive‐behaviors and cognitive repairment. a) Schematic illustration of the construction of CUMS‐induced depression model and the therapeutic treatment of HCRTR1 antagonist. Vehicle, control; CUMS, CUMS + Vehicle; SB334867, CUMS + SB334867. b) Diagram of open field test and typical heatmap of mice exploration during the open field test. SB‐334867 reversed CUMS‐induced decreasing time in the central zone, while there was no difference of total distance among three groups. c) Diagram of elevated plus test and heatmap of mice exploration during the elevated plus test. SB‐334867 reversed CUMS‐induced decreasing time and entries in open arms. d) Diagram of marble burying test. SB‐334867 reversed the CUMS‐induced increase in the number of buried marbles. e) Diagram of tail suspension test. SB‐334867 reversed the CUMS‐induced increased immobility time. (f) Diagram of Y‐maze test. SB‐334867 reversed the CUMS‐induced less time proportion in exploration in the new zone. g) Diagram of novel object recognition test. SB‐334867 reversed the CUMS‐induced less time proportion in exploration in the novel object. h,i) Hypothalamus and plasma hypocretin‐1 level in different groups. j) The mRNA expression of HCRTR1 in hippocampus in different groups. Dots in panels represent individual samples. Data were shown as mean ± SD. One‐way ANOVA followed by Dunnett's post hoc test. *p < 0.05, **p < 0.01, ***p < 0.001, ****p < 0.0001; ns, no significant difference, ≥ 0.05.
Figure 2
Figure 2
HCRTR1 antagonist (SB‐334867) restored hippocampal synaptic plasticity and neurogenic dysregulation induced by CUMS. a–d) Representative microscopic of Nissl staining, postsynaptic density protein 95 (PSD‐95) and synaptophysin (SYP), doublecortin (DCX) positive cell and GFAP/SOX2 positive cells within the hippocampus in different groups, respectively. scale bar, 50 µm. e–g) Quantification of mean fluorescence intensity of PSD‐95 and SYP. h) Quantification of DCX positive cells in DG. i,j) Quantification of SOX2+/GFAP and SOX2/GFAP+ cells in DG, respectively. k) The mRNA expression of PSD‐95 and SYP in hippocampus. l) Hippocampal lactate level in different groups. m) Changes of mRNA expression of glycolytic‐related factors in hippocampus of different groups. GLUT, glucose transporter; MCT, monocarboxylic acid transporter; LDH, lactate dehydrogenase. *Compared with vehicle, #compared with CUMS. n) Changes of mRNA expression of proliferator‐activated receptor gamma coactivator alpha (PGC‐1α)‐ silent information regulator 1 (Sirt1)‐ brain‐derived neurotrophic factor (BDNF) in hippocampus of different groups. *Compared with vehicle, #compared with CUMS. o,p) Hippocampal and plasma BDNF level in different groups. q) The correlation between hippocampal BDNF and lactate levels. r) The mRNA expression of hypoxia‐inducible factor 1α (HIF‐1α) in hippocampus in different groups. Dots in panels represent individual samples. Data were shown as mean ± SD. One‐way ANOVA followed by Dunnett's post hoc test. *p < 0.05, **p < 0.01, ***p < 0.001, ****p < 0.0001; #p < 0.05, ##p < 0.01, ###p < 0.001, ####p < 0.0001; ns, no significant difference, ≥ 0.05.
Figure 3
Figure 3
Hypocretin‐1 induced anxiety, depressive‐behaviors, cognitive impairment and dysregulation of energy metabolism. a) Schematic illustration of the intraventricular injection hypocretin‐1 (icv.HCRT‐1) in hippocampus and construction of CUMS‐induced depression model. b) Both icv.HCRT‐1 and CUMS resulted in decreased center time in open field test. c) Both icv.HCRT‐1 and CUMS decreased open arm time in elevated plus test. d) Both icv.HCRT‐1 and CUMS resulted in decreased new zone exploration time in Y‐maze test. e) Both icv.HCRT‐1 and CUMS resulted in decreased sucrose preference. f) Both icv.HCRT‐1 and CUMS resulted in increased immobility time in forced swim test. g) Representative microscopic of PSD‐95 and SYP in hippocampus. scale bar, 200 µm. h) Representative microscopic of DCX positive cells in the DG. scale bar, 100 µm. i,j) Quantification of mean fluorescence intensity SYP and PSD‐95, respectively. k) Quantification of DCX positive cells in the DG. l) mRNA expression of synapse‐related gene (SYP and PSD‐95) in hippocampus. m) Changes of mRNA expression of glycolytic‐related factors in hippocampus of different groups. n) Hippocampal lactate level in different groups. o) Representative 18F‐FDG PET images of rat hippocampus from control (CTR), icv.HCRT‐1 and CUMS groups. p) Glucose metabolism in hippocampus. Dots in panels represent individual samples. Data were shown as mean ± SD. One‐way ANOVA followed by Dunnett's post hoc test. *p < 0.05, **p < 0.01, ***p < 0.001, ****p < 0.0001; ns, no significant difference, ≥ 0.05.
Figure 4
Figure 4
Hypocretin‐1 induced the decrease of lactate and glycolysis rate in hippocampal astrocytes. a) Schematic diagram showing the detection of glycolytic analysis, lactate, RT‐qPCR and immunofluorescent staining. SB‐334867, a HCRTR1 antagonist. b) The co‐expression of HCRTR1 and GFAP. c) The lactate in astrocyte medium in different groups. CTR, control; HCRT‐1, hypocretin‐1; SB‐334867, HCRT‐1 + SB‐334867. d) Changes of mRNA expression of glycolytic‐related factors in astrocytes. *Compared with CTR, #compared with HCRT‐1. e–g) Glycolysis rate test. The basal, compensatory glycolysis rate and extracellular acidification rate (ECAR) of astrocytes, respectively. h) Quantification of mean fluorescence intensity of the HIF‐1α expression in astrocytes. i) Representative microscopic images showing expression of HIF‐1α in astrocytes. j) Schematic diagram showing treatment with HIF‐1α agonist. k) Changes of mRNA expression of glycolytic‐related factors in astrocytes treatment with HCRT‐1 and HIF‐1α agonist. Dots in panels represent individual samples. Data were shown as mean ± SD. One‐way ANOVA followed by Dunnett's post hoc test. *p < 0.05, **p < 0.01, ***p < 0.001, ****p < 0.0001; #p < 0.05, ##p < 0.01, ###p < 0.001, ####p < 0.0001; ns, no significant difference, ≥ 0.05.
Figure 5
Figure 5
Hypocretin‐1 stimulated astrocytes caused neuronal damage. a) Schematic diagram showing the co‐culture of astrocyte and neuron or PC12. SB‐334867, a HCRTR1 antagonist. b) The effect of hypocretin‐1 in neuron speed length in PC12 cell lines. c,d) Quantification of mean fluorescence intensity of Tuj1 (beta III tubulin) and Tunel+ (TdT‐mediated dUTP Nick‐End Labeling) cells in the primary neuron. e) Representative microscopic fields of PC12 co‐cultured with astrocytes in different groups. f,g) Representative microscopic fields of neuronal apoptosis and neurite branches in primary hippocampus neurons. h) Schematic diagram showing the knockdown of HCRTR1 in astrocytes and co‐culture of astrocyte and PC12. i) Validation of successful knockdown of HCRTR1 in astrocytes. j) The lactate in astrocyte medium in different groups. k,l) Quantification of speed length and the number of neurite branches in PC12 cell lines. m) Representative microscopic fields of PC12 co‐cultured with astrocytes in different groups. Dots in panels represent individual samples. Data were shown as mean ± SD. One‐way ANOVA followed by Dunnett's post hoc test. *p < 0.05, **p < 0.01, ***p < 0.001, ****p < 0.0001; ns, no significant difference, ≥ 0.05.
Figure 6
Figure 6
Knockdown of HCRTR1 in hippocampal astrocytes reversed CUMS‐induced anxiety and depressive‐behaviors and cognitive repairment. a) The procedure of animal model establishment. CTR, GFAP‐Ctrl; CUMS, GFAP‐Ctrl + CUMS; GFAP‐HCRTR1‐KD, GFAP‐HCRTR1‐KD + CUMS. b) Illustration of viral injections. Solid arrows, eGFP and GFAP. c) Validation knockdown of HCRTR1 in hippocampal astrocytes. d) The exploration time in center area in open field test in different groups. e) The exploration time in open arm in the elevated plus test in different groups. f) The proportion of time exploring in new zone in Y‐maze in different groups. g) The proportion of time exploring in novel object in novel object recognition test in different groups. h) The number of buried marbles in marble burying test different groups. i) The immobility time in tail suspension test in different groups. j) The lactate level in hippocampus in different groups. k) The mRNA expression of LDHA and LDHB in hippocampus different groups. Dots in panels represent individual samples. Data were shown as mean ± SD. One‐way ANOVA followed by Dunnett's post hoc test. *p < 0.05, **p < 0.01, ***p < 0.001, ****p < 0.0001; ns, no significant difference, ≥ 0.05.
Figure 7
Figure 7
Knockdown of HCRTR1 in hippocampal astrocytes reversed CUMS‐induced hippocampal synaptic plasticity damage. a) Representative transmission electron microscope images showing the synaptic structure and postsynaptic densities in hippocampus. scale bar, 500 nm. b,c) Typical image of Golgi staining. d) Quantification of postsynaptic density thickness in different groups. e,f) Quantification of the number of intersections and spine density in different groups. g–i) Representative microscopic of PSD‐95 and SYP, DCX positive cells and GFAP and SOX2 positive cells within the hippocampus in different groups, respectively. scale bar, 100 µm. j,k) Quantification of mean fluorescence intensity SYP and PSD‐95, respectively. l) Quantification of DCX positive cells in the DG. scale bar, 200 µm. m) Quantification of SOX2+/GFAP cells in the DG. n) Hypocretin‐1 in depression may negatively regulate the HIF‐1α pathway through HCRTR1, disrupting the glycolytic pathway and resulting in the reduction lactate release from astrocytes, thereby disrupting synaptic plasticity and neurogenesis of hippocampal neurons, which may be lead to cognitive impairment in depressed individuals. Dots in panels represent individual samples. Data were shown as mean ± SD. One‐way ANOVA followed by Dunnett's post hoc test. *p < 0.05, **p < 0.01, ***p < 0.001, ****p < 0.0001; ns, no significant difference, ≥ 0.05.

References

    1. Holmes S. E., Abdallah C., Esterlis I., Neuropsychopharmacology 2023, 48, 186. - PMC - PubMed
    1. Myles P. S., Kulkarni J., Nagele P., Lancet 2023, 401, 2111. - PubMed
    1. Sheline Y. I., Mittler B. L., Mintun M. A., Eur. Psychiatry 2002, 17, 300s. - PubMed
    1. Price R. B., Duman R., Mol. Psychiatry 2020, 25, 530. - PMC - PubMed
    1. Liu W., Ge T., Leng Y., Pan Z., Fan J., Yang W., Cui R., Neural. Plast. 2017, 2017, 6871089. - PMC - PubMed

LinkOut - more resources