. 2024 Nov;11(43):e2403245.
doi: 10.1002/advs.202403245. Epub 2024 Aug 9.

Central Role of Hypothalamic Circuits for Acupuncture's Anti-Parkinsonian Effects

Affiliations

Central Role of Hypothalamic Circuits for Acupuncture's Anti-Parkinsonian Effects

Ju-Young Oh et al. Adv Sci (Weinh). 2024 Nov.

Abstract

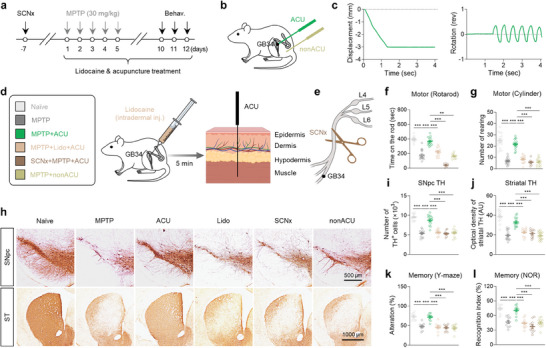
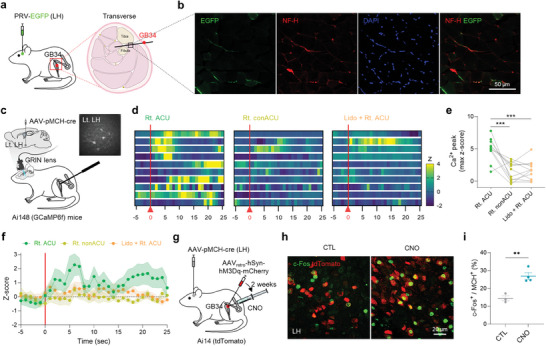
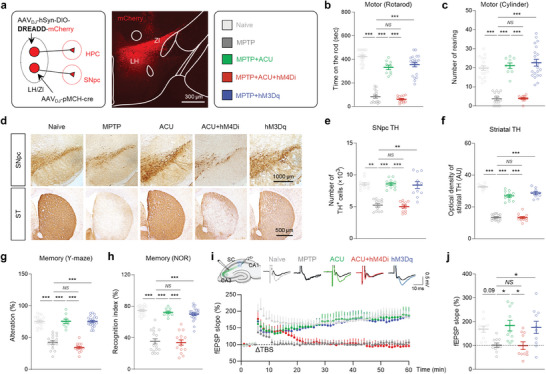
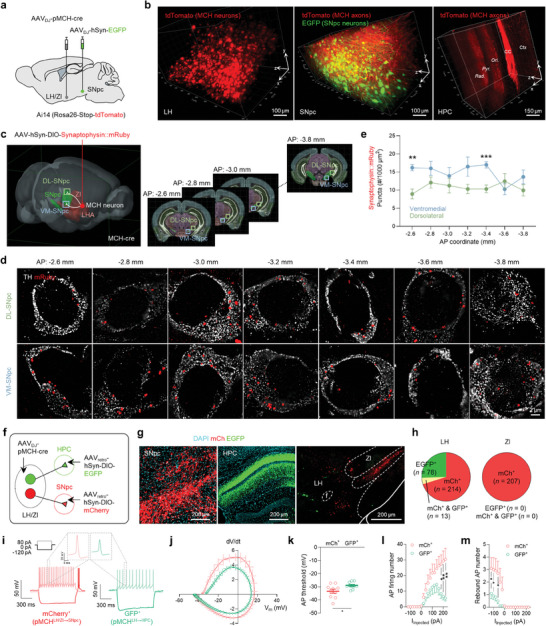
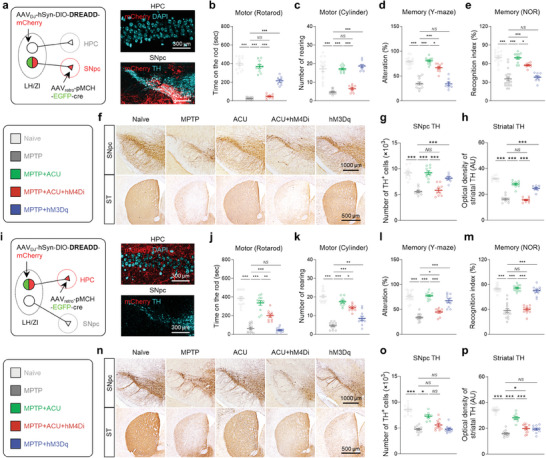
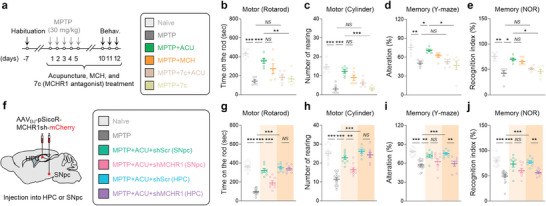
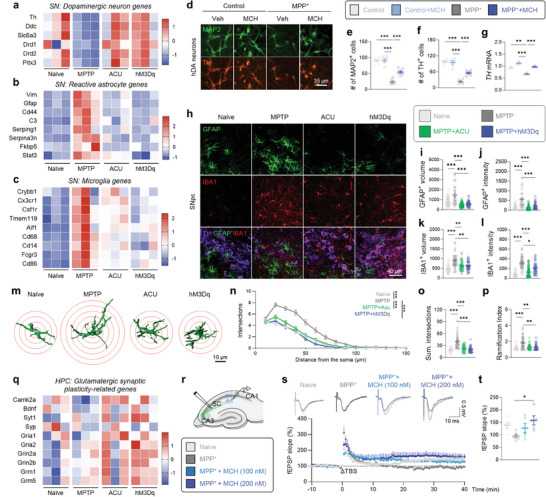
Despite clinical data stretching over millennia, the neurobiological basis of the effectiveness of acupuncture in treating diseases of the central nervous system has remained elusive. Here, using an established model of acupuncture treatment in Parkinson's disease (PD) model mice, we show that peripheral acupuncture stimulation activates hypothalamic melanin-concentrating hormone (MCH) neurons via nerve conduction. We further identify two separate neural pathways originating from anatomically and electrophysiologically distinct MCH neuronal subpopulations, projecting to the substantia nigra and hippocampus, respectively. Through chemogenetic manipulation specifically targeting these MCH projections, their respective roles in mediating the acupuncture-induced motor recovery and memory improvements following PD onset are demonstrated, as well as the underlying mechanisms mediating recovery from dopaminergic neurodegeneration, reactive gliosis, and impaired hippocampal synaptic plasticity. Collectively, these MCH neurons constitute not only a circuit-based explanation for the therapeutic effectiveness of traditional acupuncture, but also a potential cellular target for treating both motor and non-motor PD symptoms.

Keywords: Parkinson's disease (PD); acupuncture; hypothalamus; melanin‐concentrating hormone (MCH); motor and non‐motor symptoms; neural circuitry.


Conflict of interest statement

The authors declare no conflict of interest.

Figures

Figure 1
Figure 1
Acupuncture stimulation at GB34 elicits anti‐parkinsonian effects through nerve conduction. a) Experimental timeline of various interventions in the MPTP mouse model. b) Schematic diagram of acupuncture treatment at GB34 acupoint and non‐acupoint. c) Quantitative measurement of displacement and rotation of the needle during acupuncture stimulation. d) Left, group information. Right, schematic diagram of lidocaine‐induced local nerve blockade 5 min prior to acupuncture stimulation. e) Schematic diagram of sciatic nerve axotomy 7 days prior to acupuncture stimulation. f,g) Motor function assessed by rotarod test (f) and cylinder test g,h) Representative images of TH staining with SNpc and striatum (ST) tissues. i) Numbers of TH‐positive dopaminergic neurons in the SNpc. j) Quantification of optical density of striatal TH. k,l) Spatial working memory function assessed by Y‐maze k) and novel object recognition (NOR) test l). Statistical significance was assessed by Kruskal‐Wallis ANOVA test with Dunn's multiple comparison test f) or one‐way ANOVA with Tukey's multiple comparison test. ** p < 0.01. *** p < 0.001. All data are presented as mean ± SEM. Detailed statistical information is listed in Table S1 (Supporting Information).
Figure 2
Figure 2
Anatomical and functional connection between a peripheral acupoint GB34 and MCHLH/ZI neurons. a) Schematic diagram of retrograde tracing of the neural path from the LH to the peripheral acupoint GB34 using pseudorabies virus (PRV). b) Representative fluorescence image of EGFP‐labeled nerve endings (stained with neurofilament NF‐H) at the muscular layer of GB34. c) Schematic diagram of in‐vivo calcium imaging of MCHLH/ZI neurons upon acupuncture stimulation. Right top, an example image of MCH‐neuronal GCaMP6f signals. d) Heatmaps of calcium signals from each neuron upon acupuncture or control stimulations. e) Quantification of peak amplitudes of calcium signals. f) Averaged time course of relative changes in GCaMP6f fluorescence indicating calcium signals. The average per group of the Z scored data is shown. g) Schematic diagram of chemogenetic stimulation of peripheral afferent nerve fibers at acupoint GB34. h) Representative confocal images of c‐Fos expression in the MCHLH/ZI neurons 1 h after chemogenetic stimulation of acupoint GB34. i) Quantification of c‐Fos+ MCHLH/ZI neurons upon chemogenetic stimulation of acupoint GB34. Statistical significance was assessed by repeated‐measure one‐way ANOVA with Tukey's multiple comparison test e) or two‐tailed unpaired t‐test. ** p < 0.01. *** p < 0.001. All data are presented as mean ± SEM. Detailed statistical information is listed in Table S1 (Supporting Information).
Figure 3
Figure 3
MCHLH/ZI neuronal activity is critical for anti‐parkinsonian effects of acupuncture. a) Left, Schematic diagram of viral strategy for chemogenetic modulation of MCHLH/ZI neurons. Middle, representative confocal image of mCherry expression in LH/ZI region. Right, group information. b,c) Motor function assessed by rotarod tests b) and cylinder test c) upon chemogenetic manipulation of MCHLH/ZI neurons with or without acupuncture treatment in the MPTP model. d) Representative images of TH staining with SNpc and striatum (ST) tissues of each group. e) Numbers of TH‐positive dopaminergic neurons in the SNpc. f) Quantification of optical density of striatal TH. g,h) Memory function assessed by Y‐maze test g) and NOR test h) upon chemogenetic manipulation of MCHLH/ZI neurons with or without acupuncture treatment in the MPTP model. i) Top, Representative fEPSP traces before (black) and 55 min after theta‐burst stimulation (TBS). Bottom, time‐course of fEPSP slope change. j) Quantification of changes in the fEPSP slopes after TBS (for the last 10 min). Statistical significance was assessed by Kruskal‐Wallis ANOVA test with Dunn's multiple comparison test e) or one‐way ANOVA with Tukey's multiple comparison test. ** p < 0.01. *** p < 0.001. All data are presented as mean ± SEM. Detailed statistical information is listed in Table S1 (Supporting Information).
Figure 4
Figure 4
MCHLH/ZI→SNpc and MCHLH→HPC projections are originated from discrete neuronal subpopulations. a) Schematic diagram of viral injections for elucidating the MCHLH/ZI neuronal projections. b) 3D rendering of a cleared mouse brain showing tdTomato‐labeled MCHLH/ZI neuronal soma (left) and projections to SNpc (middle) and HPC (right). c) Schematic diagram of virus injection strategy for anatomically elucidating the MCH neuronal projections to SNpc. d) Lattice‐SIM image of synaptophysin::mRuby near the TH‐positive neurons in the SNpc. Low magnification images are displayed in Figure S5a, Supporting Information. e) Quantification of synaptophysin::mRuby‐positive dots throughout the whole SNpc. f) Schematic diagram of viral strategy for differentially labeling MCH neurons projecting to SNpc (mCherry) or HPC (EGFP). g) Representative confocal images of MCH axon fibers in SNpc or HPC originated from the soma located in LH/ZI. f, fornix. h) Intra‐LH/ZI localization and quantification of MCH neuronal subpopulations projecting to SNpc (mCherry; MCHLH/ZI→SNpc) or HPC (EGFP; MCHLH→HPC). i) Representative traces of membrane potentials recorded from MCHLH/ZI→SNpc or MCHLH→HPC neurons upon current steps (left top). j) Phase plot analyses of action potentials. k‐m) Intrinsic electrophysiological properties of MCHLH/ZI→SNpc or MCHLH→HPC neurons; AP threshold k), AP firing numbers upon depolarizing current step l), rebound AP numbers upon hyperpolarizing current steps (m). Statistical significance was assessed by unpaired two‐tailed Student's t‐test. * p < 0.05, ** p < 0.01, *** p < 0.001, NS, non‐significant. All data are presented as mean ± SEM. Detailed statistical information is listed in Table S1 (Supporting Information).
Figure 5
Figure 5
MCHLH/ZI→SNpc and MCHLH→HPC projections are responsible for motor and memory function, respectively. a) Schematic of viral strategy for projection‐specific chemogenetic manipulation of MCHLH/ZI→SNpc. b,c) Motor function assessed by rotarod tests and cylinder test. d,e) Memory function assessed by Y‐maze test and NOR test. f) Representative images of TH staining with SNpc and striatum (ST) tissues of each group. g) Numbers of TH‐positive dopaminergic neurons in the SNpc. h) Quantification of optical density of striatal TH. i) Schematic of viral strategy for projection‐specific chemogenetic manipulation of MCHLH→HPC. j,k) Motor function assessed by rotarod tests and cylinder test. l,m) Memory function assessed by Y‐maze test and NOR test. n) Representative images of TH staining with SNpc and striatum tissues of each group. o) Numbers of TH‐positive dopaminergic neurons in the SNpc. p) Quantification of optical density of striatal TH. Statistical significance was assessed by one‐way ANOVA with Tukey's multiple comparison test. * p < 0.05, ** p < 0.01, *** p < 0.001, NS, non‐significant. All data are presented as mean ± SEM. Detailed statistical information is listed in Table S1 (Supporting Information).
Figure 6
Figure 6
MCH‐MCHR1 activation is critical for multi‐therapeutic effects of acupuncture. a) Left, experimental timeline of various interventions including acupuncture, intranasal administration of MCH, and intraperitoneal administration of MCHR1 antagonist in the MPTP model. Right, group information. b,c) Motor function assessed by rotarod tests b) and cylinder test c) upon various interventions in the MPTP model. d,e) Memory function assessed by Y‐maze test d) and NOR test e) upon various interventions in the MPTP model. f) Schematic diagram of AAV‐mediated gene‐silencing of MCHR1. g,h) Motor function assessed by rotarod tests g) and cylinder test h). i,j) Memory function assessed by Y‐maze test i) and NOR test j). Statistical significance was assessed by Kruskal‐Wallis ANOVA test with Dunn's multiple comparison test i,j) or one‐way ANOVA with Tukey's multiple comparison test. * p < 0.05, ** p < 0.01, *** p < 0.001, NS, non‐significant. All data are presented as mean ± SEM. Detailed statistical information is listed in Table S1 (Supporting Information).
Figure 7
Figure 7
Acupuncture and MCHLH/ZI activation share transcriptomic signatures. a–c) Heatmap showing enriched genes in specific cell types such as DA neurons a), reactive astrocytes b), and microglia c) in the SN. d) Immunostaining with MAP2 and TH in hDA neurons treated with MPP+ and MCH. e,f) The number of MAP2‐positive e) and TH‐positive cells f). g) mRNA expressions of TH. h) Representative confocal images of GFAP‐positive astrocyte and IBA1‐positive microglia in the SNpc. i,j) Quantification of volume i) and GFAP intensity j) of each astrocyte. k,l) Quantification of volume k) and IBA1 intensity l) of each microglia. m) Three‐dimensionally rendered images of GFAP‐positive astrocytes. Red circles indicate superimposed spheres centered around astrocyte somata used for Sholl analysis. n–p) Morphometric analyses of GFAP‐positive astrocytes by Sholl analysis; Sholl intersections by distance from the soma n), total number of intersections o), and ramification index p,q) Heatmap showing glutamatergic synaptic plasticity‐related genes in the HPC. r) Schematic diagram of ex‐vivo field recording for LTP measurement at SC‐CA1 synapse. s) Top, Representative fEPSP traces before (black) and 40 min after theta‐burst stimulation (TBS). Bottom, time‐course of fEPSP slope change. t) Quantification of changes in the fEPSP slopes after TBS (for the last 10 min). The expression profiles of expanded marker gene sets for dopaminergic neurons a), reactive astrocytes b), microglia c), and glutamatergic synaptic plasticity q) are shown in Figures S8f–h and S10f of the Supporting Information. Statistical significance was assessed by Kruskal‐Wallis ANOVA test with Dunn's multiple comparison test k,l,o,p), two‐way ANOVA with Tukey's multiple comparison test n), or one‐way ANOVA with Tukey's multiple comparison test. * p < 0.05, ** p < 0.01, *** p < 0.001, NS, non‐significant. All data are presented as mean ± SEM. Detailed statistical information is listed in Table S1 (Supporting Information).

References

    1. Tysnes O. B., Storstein A., J. Neural Transm. 2017, 124, 901. - PubMed
    1. Armstrong M. J., Okun M. S., JAMA, J. Am. Med. Assoc. 2020, 323, 548. - PubMed
    1. a) Park H. K., Lee H., Neurol Res. 2010, 32, 3;
    2. b) Kaptchuk T. J., Ann. Intern. Med. 2002, 136, 374. - PubMed
    1. Liu S., Wang Z., Su Y., Qi L., Yang W., Fu M., Jing X., Wang Y., Ma Q., Nature 2021, 598, 641. - PMC - PubMed
    1. a) Li K., Xu S., Wang R., Zou X., Liu H., Fan C., Li J., Li G., Wu Y., Ma X., Chen Y., Hu C., Liu X., Yuan C., Ye Q., Dai M., Wu L., Wang Z., Wu H., EClinicalMedicine 2023, 56, 101814; - PMC - PubMed
    2. b) Pereira C. R., Machado J., Rodrigues J., de Oliveira N. M., Criado M. B., Greten H. J., Healthcare (Basel) 2022, 10; - PMC - PubMed
    3. c) Noh H., Kwon S., Cho S. Y., Jung W. S., Moon S. K., Park J. M., Ko C. N., Park S. U., Complement Ther. Med. 2017, 34, 86. - PubMed

LinkOut - more resources