Clinical Trial
. 2024 Aug;17(8):e13896.
doi: 10.1111/cts.13896.

Using exploratory pharmacokinetic and pharmacodynamic analyses to predict the probability of flu-like symptoms in healthy volunteers and patients with chronic hepatitis B treated with the toll-like receptor 7 agonist ruzotolimod

Affiliations
Clinical Trial

Using exploratory pharmacokinetic and pharmacodynamic analyses to predict the probability of flu-like symptoms in healthy volunteers and patients with chronic hepatitis B treated with the toll-like receptor 7 agonist ruzotolimod

Qiudi Jiang et al. Clin Transl Sci. 2024 Aug.

Abstract

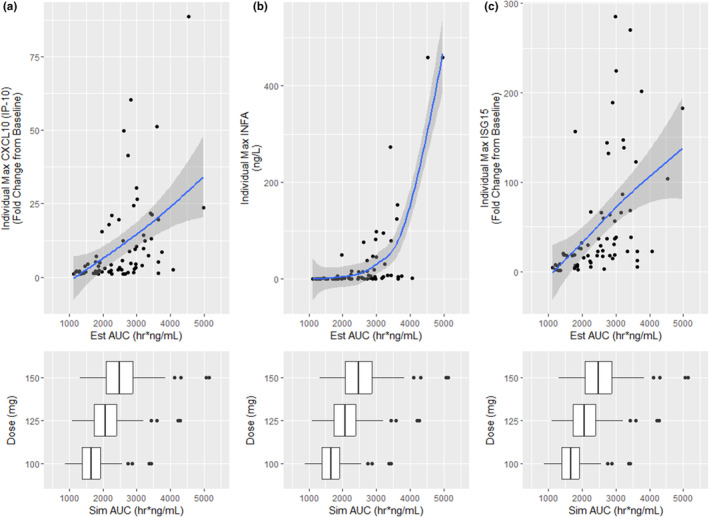
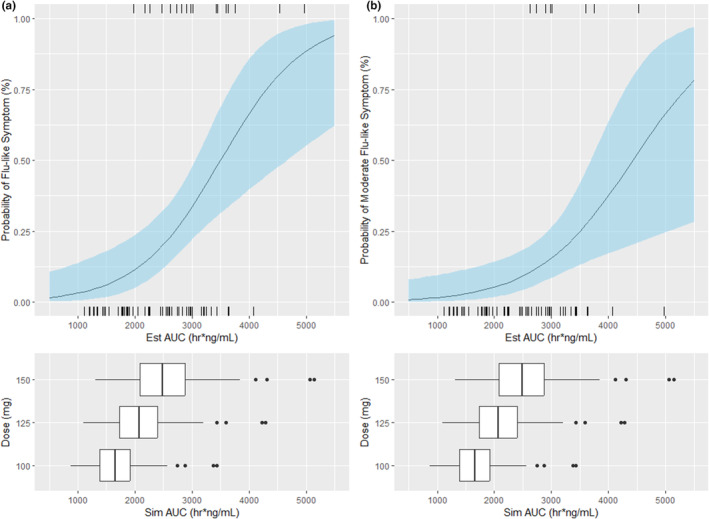
Ruzotolimod (Toll-like receptor 7 (TLR7) agonist, RG7854) is an oral, small molecule immuno-modulator activating the TLR 7 and is being evaluated in patients with CHB. As with other TLR7 agonists, the study drug-related adverse events of flu-like symptoms have been reported in some participants during phase I studies with ruzotolimod. An exploratory analysis of the relationship between pharmacokinetic (PK)/pharmacodynamic (PD) and flu-like symptoms was performed in participants from two phase I studies including both healthy volunteers and NUC-suppressed CHB patients who received either single or multiple ascending doses of orally administered ruzotolimod. Linear and logistic regression were used to explore potential relationships between dose, flu-like symptoms, PK, and PD. Generalized linear regression was performed to predict the probability of flu-like symptoms of all intensities at different RO7011785 (the active metabolite of the double prodrug ruzotolimod) PK exposure. This analysis showed that single or multiple doses of ruzotolimod at ⩾100 mg, the immune PD (IFN-α, neopterin, IP-10, and the transcriptional expression of ISG15, OAS-1, MX1, and TLR7) responses increase with the RO7011785 PK exposure, which increases linearly with the doses from 3 mg to 170 mg of ruzotolimod. The analysis also showed that the probability of flu-like symptoms occurrence increases with PD responses (IFN-α and IP-10). Dose reduction of ruzotolimod can be an effective way to reduce the magnitude of PD response, thus reducing the probability of study drug-related flu-like symptoms occurrence at all intensity in the participants who are highly sensitive to PD activation and intolerant to flu-like symptoms.


Conflict of interest statement

Q.J., Y.C., D.D., S.R., R.U., K.G. and M.T. are employees of F. Hoffmann‐La Roche, and Y.Z., J.F.G. and Y.J. are former employees of F. Hoffmann‐La Roche. All of them have no competing interests for this work.

Figures

FIGURE 1
FIGURE 1
Dose linearity of C max (a) and AUCinf (b) across NP39305 and YP39553. The point and line plots represent the relationship between the dose and PK exposure (C max and AUCinf). The gray area represents the 95% confidence interval. AUCinf, area under the plasma concentration–time curve from time 0 to infinity; C max, Maximum plasma concentration.
FIGURE 2
FIGURE 2
RO7011785 AUCinf versus PD response with simulated PK AUCinf in all participants of MAD cohorts and NUC‐treated CHB patients cohorts. The point and line plots at the top represent the relationship between AUCinf and PD response. The box plots at the bottom represent the simulated AUCinf at each dose level and the gray area represents the 95% confidence interval. AUCinf, area under the plasma concentration–time curve from time 0 to infinity; Est AUC, Empirical Bayesian Estimates of AUCinf based on the popPK model; MAD, multiple ascending doses; PD, Pharmacodynamics; PK, pharmacokinetics; Sim AUC, simulated AUCinf based on the popPK model.
FIGURE 3
FIGURE 3
RO7011785 AUCinf versus PD response with simulated PK AUCinf in all participants of MAD and NUC‐treated CHB patients with flu‐like symptoms. The point and line plots at the top represent the relationship between AUCinf and PD response, while the red points and lines represent participants without flu‐like symptoms and the blue ones represent participants with the symptom. The stars are subjects with flu‐like symptoms at a severity of moderate or higher. The box plots at the bottom represent the simulated AUCinf at each dose level and the gray area represents the 95% confidence interval. AUCinf, area under the plasma concentration–time curve from time 0 to infinity; Est AUC, Empirical Bayesian estimates of AUCinf based on the popPK model; MAD, multiple ascending doses; PD, pharmacokinetics; Sim AUC, simulated AUCinf based on the popPK model.
FIGURE 4
FIGURE 4
PD response of biomarkers IFN α, IP10, and ISG15 versus probability of flu‐like symptoms in participants with any intensity (a) and with moderate or severe flu‐like symptoms (b) in the MAD cohorts and NUC‐treated CHB patients cohorts. Participants with any intensity of FLS were defined as 100% probability of FLS in (a–c), while in (d–f), only participants with moderate or severe FLS were defined as 100% probability of FLS. Black lines and blue areas represent the regression lines and their 95% confidence intervals. CHB, chronic hepatitis B; MAD, multiple ascending doses; PD, pharmacodynamics.
FIGURE 5
FIGURE 5
RO7011785 AUCinf versus probability of flu‐like symptoms for all participants with any intensity (a) and participants with moderate or severe flu‐like symptoms (b) in MAD cohorts and NUC‐treated CHB patients cohorts. Participants with any level of FLS were defined as 100% probability of FLS in (a), while in (b), only participants with moderate or higher FLS were defined as 100% probability of FLS. Black lines and blue areas represent the regression lines and their 95% confidence intervals. AUCinf, area under the plasma concentration–time curve from time 0 to infinity; CHB, chronic hepatitis B; Est AUC, Empirical Bayesian estimates of AUCinf based on the popPK model; MAD, multiple ascending doses; Sim AUC, simulated AUCinf based on the popPK model.

Similar articles

References

    1. World Health Organization . Hepatitis B . Updated on 18 July. https://www.who.int/news‐room/fact‐sheets/detail/hepatitis‐b
    1. Mehta P, Reddivari AKR. Hepatitis. StatPearls; 2020.
    1. Lok AS, Zoulim F, Dusheiko G, Ghany MG. Hepatitis B cure: from discovery to regulatory approval. J Hepatol. 2017;67:847‐861. - PubMed
    1. Fisicaro P, Barili V, Rossi M, et al. Pathogenetic mechanisms of T cell dysfunction in chronic HBV infection and related therapeutic approaches. Front Immunol. 2020;11:849. - PMC - PubMed
    1. Schinazi RF, Ehteshami M, Bassit L, Asselah T. Towards HBV curative therapies. Liver Int. 2018;38(Suppl 1):102‐114. - PMC - PubMed

Publication types

MeSH terms

LinkOut - more resources