. 2024 Oct;11(40):e2403177.
doi: 10.1002/advs.202403177. Epub 2024 Aug 9.

PRMT6 Epigenetically Drives Metabolic Switch from Fatty Acid Oxidation toward Glycolysis and Promotes Osteoclast Differentiation During Osteoporosis

Affiliations

PRMT6 Epigenetically Drives Metabolic Switch from Fatty Acid Oxidation toward Glycolysis and Promotes Osteoclast Differentiation During Osteoporosis

Wenxiang Chu et al. Adv Sci (Weinh). 2024 Oct.

Abstract

Epigenetic regulation of metabolism profoundly influences cell fate commitment. During osteoclast differentiation, the activation of RANK signaling is accompanied by metabolic reprogramming, but the epigenetic mechanisms by which RANK signaling induces this reprogramming remain elusive. By transcriptional sequence and ATAC analysis, this study identifies that activation of RANK signaling upregulates PRMT6 by epigenetic modification, triggering a metabolic switching from fatty acids oxidation toward glycolysis. Conversely, Prmt6 deficiency reverses this shift, markedly reducing HIF-1α-mediated glycolysis and enhancing fatty acid oxidation. Consequently, PRMT6 deficiency or inhibitor impedes osteoclast differentiation and alleviates bone loss in ovariectomized (OVX) mice. At the molecular level, Prmt6 deficiency reduces asymmetric dimethylation of H3R2 at the promoters of genes including Ppard, Acox3, and Cpt1a, enhancing genomic accessibility for fatty acid oxidation. PRMT6 thus emerges as a metabolic checkpoint, mediating metabolic switch from fatty acid oxidation to glycolysis, thereby supporting osteoclastogenesis. Unveiling PRMT6's critical role in epigenetically orchestrating metabolic shifts in osteoclastogenesis offers a promising target for anti-resorptive therapy.

Keywords: PRMT6; fatty acids oxidation; glycolysis; metabolic reprogramming; osteoclastogenesis.


Conflict of interest statement

The authors declare no conflict of interest.

Figures

Figure 1
Figure 1
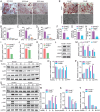
Omics analysis reveals an upregulation of PRMT6 in response to RANK signaling activation. A) An osteoclast differentiation model was constructed through inducing mouse bone marrow monocytes/macrophages (BMMs) with RANKL, followed by RNA‐sequencing analysis. Principal Component Analysis (PCA) demonstrated distinct segregation of samples 24 h post‐RANKL induction from those in pre‐induction states, underscoring significant gene expression alterations driven by RANK signaling activation. B) Volcano plot illustrating differentially expressed genes (DEGs) in BMMs before and after 24 h of RANKL induction (FC ≥ 2, p ≤ 0.05). C) Gene Ontology (GO) enrichment analysis reveals significantly enriched biological processes, with a focus on GO terms related to metabolic regulation and molecular mechanisms, which are highlighted and presented. D) The Venn diagram showcasing the intersection among the ten biological processes of interest, aimed at identifying candidate genes common to both metabolic regulation and molecular mechanism control. E,F) Quantification of gene expression for Prmt6 (E) and Auts2 (F), highlighting two genes previously unidentified in osteoclastogenesis, as derived from the core of the Venn diagram analysis. G–I) In vitro gene expression analysis of Prmt6 (G), Ctsk (H), and Mmp9 (I) in RANKL‐induced BMMs as assessed by quantitative PCR. J) Representative Western blot showing the expression levels of PRMT6 during the differentiation of BMMs into osteoclasts, induced by RANKL. K) Quantitative analysis of PRMT6 protein levels at different time points during osteoclastogenesis. L) Immunohistochemical staining showing the localization and increased expression of PRMT6 in bone sections from ovariectomized (OVX) mice compared to sham‐operated controls. M) Quantitative analysis of PRMT6 expression levels in bone tissue, derived from immunohistochemical staining intensities.
Figure 2
Figure 2
PRMT6 deficiency inhibits RANKL‐induced osteoclast differentiation and activation in vitro. A) The PRMT6 inhibitor (EPZ020411) suppressed TRAP+ multinucleated cell (TRAP+/MNC) formation and osteoclast‐mediated pit formation in a dose‐dependent manner. B,C) Quantitative analysis of relative area (B) or number (C) of TRAP+/MNC under the administration of 0, 5.0, and 10 µm PRMT6 inhibitor. D) Quantitative analysis of osteoclast‐mediated pit formation area under the administration of PRMT6 inhibitor. E) Prmt6 knockout inhibited TRAP+ osteoclast formation and osteoclast‐mediated pit formation. F,G) Quantitative analysis of relative area (F) or number (G) of TRAP+/MNC between RANKL‐induced Prmt6+/+ and Prmt6−/− BMMs. H) Quantitative analysis of the area of pit formation on bovine bone slices, cultured with RANKL‐induced Prmt6+/+ or Prmt6−/− BMMs. I–K) Analysis of osteoclast marker gene expression levels in RANKL‐induced BMMs, showing a significant reduction in Acp5 (I), Ctsk (J), and Mmp9 (K) following Prmt6 knockout. L) Prmt6 knockout resulted in decreased protein expression levels of ACP5, CTSK, and MMP9 in BMMs at 4 days post‐RANKL induction. M) Quantitative analysis of the protein expression levels of ACP5, CTSK, and MMP9 in Prmt6+/+ and Prmt6−/− BMMs at 4 days post‐RANKL induction. N) Representative Western blot analysis showing the inhibition of the NF‐κB signaling pathway in BMMs induced by RANKL in the absence of Prmt6. O) Quantitative analysis of IkB protein levels in BMMs following RANKL stimulation at 30 and 60 min. Prmt6 knockout BMMs exhibit significantly higher IkB levels compared to wild‐type controls, indicating inhibited NF‐κB pathway activation. P) The analysis reveals significantly lower levels of phosphorylated p65 relative to total p65 (p‐p65/p65) in Prmt6‐deficient BMMs at both 30 and 60 min post‐RANKL induction. Q) Western blot analysis demonstrating that Prmt6 knockout significantly reduces the phosphorylation of ERK (p‐ERK) and p38 (p‐p38) in BMMs after RANKL induction, whereas the phosphorylation levels of JNK (p‐JNK) remain unaffected. R) Quantitative analysis shows significantly lower p‐ERK levels in Prmt6 knockout BMMs at 30 and 60 min following RANKL stimulation, compared to wild‐type cells. S) Similarly, Prmt6 deficiency results in markedly reduced p‐p38 levels at both time points under RANKL induction. T) The levels of p‐JNK in Prmt6‐deficient BMMs do not show significant differences compared to wild‐type cells.
Figure 3
Figure 3
Prmt6 deficiency attenuates OVX‐induced bone loss and osteoclastogenesis in vivo. A) Micro‐CT images from Prmt6−/− mice and their wild‐type littermates demonstrate that Prmt6 deficiency significantly mitigates OVX‐induced trabecular bone loss with minimal impact on cortical bone. B) Quantitative analyses of trabecular and cortical bone parameters in femurs using micro‐CT, including bone mineral density (BMD), bone volume fraction (BV/TV), trabecular number (Tb.N), trabecular thickness (Tb.Th), trabecular separation (Tb.Sp), and cortical thickness (Ct. Th). C) Hematoxylin and eosin (HE) and tartrate‐resistant acid phosphatase (TRAP) staining of decalcified sections of distal femurs from Prmt6−/− and their wild‐type littermates. HE staining (left panels) reveals reduced OVX‐induced trabecular bone loss in Prmt6−/− mice while TRAP staining (right panels) indicates fewer TRAP+ osteoclasts, marked by red arrows. D) Histomorphometric analyses of distal femurs, showing the number of osteoblasts per bone perimeter (Ob.N/B.Pm) and the osteoblast surface area per bone surface area (Ob.S/BS). E) Histomorphometric analyses of distal femurs, showing the number of osteoclasts per bone perimeter (Oc.N/B.Pm) and the osteoclast surface area per bone surface area (Oc.S/BS). F) Measurement of serum levels of C‐terminal telopeptide type 1 collagen (CTX‐1) in Prmt6+/+ and Prmt6−/− mice, with and without OVX treatment.
Figure 4
Figure 4
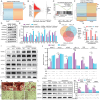
Prmt6 deficiency reduces the HIF‐1 signaling pathway in RANKL‐induced BMMs. A) ATAC‐seq showed the number of accessible chromatin regions (peaks) in Prmt6−/− compared to Prmt6+/+ BMMs post‐12‐h RANKL stimulation, indicating altered chromatin accessibility. B) KEGG enrichment analysis for genes associated with differential peaks between Prmt6−/− and Prmt6+/+ BMMs post‐12‐h RANKL stimulation. A log2|Fold change| > 1 between Prmt6−/− and Prmt6+/+ RPM values indicates the differential peaks, with proximal genes considered associated. C) A Volcano plot illustrating DEGs (Fold change >= 1.2, FDR <= 0.01) between Prmt6−/− and Prmt6+/+ cells upon 24‐h RANKL stimulation, derived from RNA‐seq data. D) The Top 12 significantly enriched KEGG pathways based on the DEGs between Prmt6−/− and Prmt6+/+ cells, as identified from RNA‐seq data, reveal key pathways impacted by Prmt6 deficiency. E) RNA‐seq data analysis shows significantly downregulated pathways in the KEGG signaling transduction category and the Glycolysis/Gluconeogenesis pathway in Prmt6−/− BMMs compared to Prmt6+/+ counterparts. F) A heatmap displays genes within the HIF‐1 signaling pathway, contrasting Prmt6−/− and Prmt6+/+ BMMs after 24 h of RANKL stimulation, underscoring the downregulation of these HIF‐1 signaling genes. G) qPCR analysis validated the decreased gene expression in Prmt6−/− cells relative to Prmt6+/+ cells following 24 h of RANKL induction. H) Western blot analysis demonstrating that Prmt6 knockout leads to a decreased protein expression level of HIF‐1α during in vitro osteoclastogenesis induced by RANKL. I) Quantitative analysis confirming that Prmt6 knockout results in significantly decreased protein expression levels of HIF‐1α in BMMs during RANKL‐induced osteoclastogenesis. J) The inhibition of HIF‐1α using Acriflavine significantly reduces the formation of TRAP+ osteoclasts, demonstrating the crucial role of HIF‐1α in osteoclastogenesis. K,L) Quantitative analysis demonstrated the inhibitory effect of Acriflavine on TRAP+ osteoclast formation. M) TRAP staining shows that HIF‐1α overexpression partially rescues the formation of TRAP+ osteoclasts in Prmt6‐deficient BMMs. N,O) Quantitative analysis indicates that HIF‐1α overexpression partially rescues the relative area (N) and number (O) of TRAP+ osteoclasts in Prmt6‐deficient BMMs. P) Western blot analysis shows that HIF‐1α overexpression partially rescues the protein levels of osteoclast markers ACP5, CTSK, and MMP9 in Prmt6‐deficient BMMs. Q) Quantitative analysis demonstrates that HIF‐1α overexpression partially rescues the protein levels of osteoclast markers ACP5, CTSK, and MMP9 in Prmt6‐deficient BMMs.
Figure 5
Figure 5
Prmt6 deficiency inhibits glycolysis in RANKL‐induced BMMs. A) GSEA analysis revealed significantly inhibited glycolysis in Prmt6 / BMMs compared to Prmt6+/+ BMMs following 24‐h RANKL stimulation. B) qPCR confirmed that Prmt6 deficiency significantly reduced the expression of glycolysis‐related genes in BMMs after 24 h of RANKL induction. C) Schematic of the enzymes and metabolites involved in the glycolysis pathway. D) A heatmap displayed the proteomic profiling of glycolytic enzymes, illustrating significant upregulation in response to RANKL in wild‐type BMMs, an effect mitigated by Prmt6 deficiency. E) Comparative analysis of glycolytic enzyme expression (HK1, PFKM/L, PKM, and LDHA) between Prmt6−/− and Prmt6+/+ BMMs during RANKL stimulation, corroborating the findings from proteomic profiling. F) Quantitative analysis shows that Prmt6 deficiency significantly inhibits RANKL‐induced expression of glycolytic enzymes (HK1, PFKM/L, PKM, and LDHA). G) Quantification of lactate secretion in cell culture supernatants from Prmt6−/− and Prmt6+/+ BMMs under RANKL stimulation. H,I) Analysis of extracellular acidification rate (ECAR) revealed a decrease in Prmt6−/− BMMs compared to Prmt6+/+ counterparts after 24‐h RANKL stimulation. J) Inhibition of glycolysis with 2‐DG significantly abolishes the enhancement of TRAP+ osteoclast formation induced by PRMT6 overexpression during RANKL stimulation. K,L) Quantitative analysis shows that 2‐DG inhibition of glycolysis significantly abolishes the relative area (K) and number (L) of TRAP+ osteoclasts induced by PRMT6 overexpression. M) Western blot analysis indicates that 2‐DG inhibition of glycolysis significantly abolishes the elevated protein levels of osteoclast markers ACP5, CTSK, and MMP9 induced by PRMT6 overexpression. N) Quantitative analysis demonstrates that 2‐DG inhibition of glycolysis significantly abolishes the elevated protein levels of osteoclast markers ACP5, CTSK, and MMP9 induced by PRMT6 overexpression.
Figure 6
Figure 6
Prmt6 deficiency increases fatty acid oxidation (FAO) in RANKL‐induced BMMs. A) GSEA revealed an augmentation in FAO in Prmt6−/− BMMs compared to Prmt6+/+ BMMs post‐24‐h RANKL induction. B) Heatmap presenting upregulated genes involved in the FAO in Prmt6−/− BMMs post‐24‐h RANKL induction. C) RT‐qPCR analysis confirmed the upregulation of FAO‐related genes in Prmt6−/− BMMs relative to Prmt6+/+ counterparts after 24‐h RANKL stimulation. D) Western blot analysis revealed that Prmt6 deficiency significantly increased the levels of FAO‐related proteins PPARδ, CPT1a, and ACOX3 at 24 h post‐RANKL induction. E) Quantitative analysis showed that Prmt6 deficiency significantly increased the levels of FAO‐related proteins PPARδ, CPT1a, and ACOX3 at 24 h post‐RANKL induction. F) OCR quantifying FAO in 24‐h RANKL‐induced Prmt6+/+ , Prmt6−/− , Prmt6+/+ + Etomoxir, and Prmt6−/− + Etomoxir BMMs. G,H) FAO ratio at Basal (G) and Max (H) OCR levels, calculated as [OCR (Prmt6−/− ) − OCR (Prmt6−/− + Etomoxir)]/[OCR (Prmt6+/+ ) − OCR (Prmt6+/+ + Etomoxir)]. I,J) Blue fluorescence imaging and intensity quantification following FAOBlue reagent application for 40 min on RANKL‐induced Prmt6+/+ and Prmt6−/− BMMs at 24 h, showing an increased FAO activity in Prmt6−/− BMMs.
Figure 7
Figure 7
PRMT6 mediates metabolic shifts in RANKL‐induced BMMs by regulating histone epigenetic modification. A) Heatmap from ATAC‐seq analysis showing RPM across overall chromatin accessible regions (peaks) between Prmt6−/− and Prmt6+/+ BMMs after RANKL induction, suggesting increased chromatin accessibility in Prmt6−/− samples. B) A differential accessibility plot illustrating the log2 fold change in reads per accessible region against the mean reads per region, reveals that 26.3% regions exhibit increased openness (fold change > 1.3), while 11.4% show decreased accessibility (fold change < −1.3) in RANKL‐stimulated Prmt6−/− BMMs compared to Prmt6+/+ counterparts. C) GSEA of RNA‐seq data revealed altered histone binding in Prmt6−/− BMMs compared to Prmt6+/+ counterparts after RANKL induction, indicating the influence of PRMT6 on histone modification. D) Prmt6 deficiency counteracted RANKL‐induced upregulation of H3R2me2a modification, concurrently increasing active histone mark expression (H3K27ac, H3k56ac and H3K4me3) and reducing repressive marks (H3k27me3, H3K9me3) in Prmt6−/− compared to Prmt6+/+ BMMs during RANKL stimulation. E) Quantitative analysis indicated that at 12 h post‐RANKL induction, repressive histone markers were significantly lower, and active histone markers were significantly higher in Prmt6−/− BMMs compared to wild‐type BMMs. F) Heatmap showing enhanced chromatin accessibility for FAO genes in Prmt6−/− compared to Prmt6+/+ BMMs after RANKL stimulation, as indicated by increased RPM of associated peaks. G) Venn diagram depicting the overlap among FAO genes demonstrating both increased chromatin accessibility (ATAC‐seq) and upregulated mRNA (RNA‐seq) in Prmt6−/− BMMs relative to Prmt6+/+ counterparts following RANKL induction, alongside those downregulated mRNA (RNA‐seq) in Prmt6+/+ cells after RANKL treatment. H) ChIP‐qPCR analysis revealing significant enrichment of H3R2me2a modification at the promoters of key FAO genes including Ppard, Cpt1a, and Acox3 in RANKL‐stimulated Prmt6+/+ BMMs compared to Prmt6−/− cells. I,J) Western Blot (I) and quantitative analysis (J) show that overexpression of H3R2A, which blocks methylation at the H3R2 site, significantly increased the levels of FAO‐related proteins (PPARδ, CPT1a, and ACOX3) and significantly decreased the levels of glycolysis‐related proteins (HIF‐1α, PKM, and LDHA) after 24 h of RANKL induction. Under the condition of PRMT6 inhibition with EPZ020411, blocking H3R2 methylation did not significantly affect the expression levels of FAO‐related proteins, which remained relatively high, nor did it significantly affect the expression levels of glycolysis‐related proteins, which remained relatively low. K) TRAP staining indicates that overexpression of H3R2A, blocking methylation at the H3R2 site, significantly inhibited the formation of TRAP+ osteoclasts. L,M) Western Blot (L) and quantitative analysis (M) show that overexpression of H3R2A, blocking methylation at the H3R2 site, significantly inhibited the expression of osteoclast markers ACP5, CTSK, and MMP9 induced by RANKL. This effect was completely abolished by the inhibition of PRMT6 with EPZ020411.
Figure 8
Figure 8
PRMT6 inhibitor (EPZ020411) treatment protects against OVX‐induced osteoporosis and osteoclastogenesis in vivo. A) Micro‐CT images of femurs from Sham, OVX, and OVX mice treated with EPZ020411 at low (LD) or high dose (HD) demonstrate that EPZ treatment significantly mitigates OVX‐induced trabecular bone loss, while its impact on cortical bone remains minimal. B) Micro‐CT derived parameters, including bone mineral density (BMD), bone volume fraction (BV/TV), trabecular number (Tb.N), trabecular thickness (Tb.Th), trabecular separation (Tb.Sp), and cortical thickness (Ct. Th) for Sham, OVX, and OVX + EPZ treated groups. C) Hematoxylin and eosin (HE) and tartrate‐resistant acid phosphatase (TRAP) stained sections of distal femurs. Upper panels: HE staining reveals the attenuation of OVX‐induced trabecular bone loss following EPZ treatment; Lower panels: TRAP staining, with red arrows highlighting TRAP+ osteoclasts, demonstrates a decrease in OVX‐induced osteoclast formation as a result of EPZ intervention. D) Quantitative analyses of osteoblast number per bone perimeter (Ob.N/B.Pm) and osteoblast surface area per bone surface area (Ob.S/BS) in distal femurs across all groups. E) Quantitative analyses of osteoclast number per bone perimeter (Oc.N/B.Pm) and osteoclast surface area per bone surface area (Oc.S/BS) in distal femurs across all groups. F) The serum level of C‐terminal telopeptide type 1 collagen (CTX‐1) was measured by ELISA assay for each group.
Figure 9
Figure 9
Schematic of PRMT6‐mediated epigenetic regulation in metabolic reprogramming during osteoclastogenesis. RANKL‐induced upregulation of PRMT6 leads to the asymmetric dimethylation of H3R2 at the promoters of key fatty acid oxidation (FAO) genes such as Ppard, Acox3, and Cpt1a. This epigenetic modification constricts genomic accessibility for FAO genes, thus inhibiting FAO activity. The reduction in FAO alleviates its suppressive effect on glycolysis, synergizing with PRMT6's promotion of HIF‐1 signaling‐dependent glycolysis to enhance cellular glycolytic activity. Consequently, a metabolic shift from FAO to glycolysis occurs, a transition that significantly contributes to osteoclast differentiation and activation.

References

    1. McDonald M. M., Khoo W. H., Ng P. Y., Xiao Y., Zamerli J., Thatcher P., Kyaw W., Pathmanandavel K., Grootveld A. K., Moran I., Butt D., Nguyen A., Corr A., Warren S., Biro M., Butterfield N. C., Guilfoyle S. E., Komla‐Ebri D., Dack M. R. G., Dewhurst H. F., Logan J. G., Li Y., Mohanty S. T., Byrne N., Terry R. L., Simic M. K., Chai R., Quinn J. M. W., Youlten S. E., Pettitt J. A., et al., Cell 2021, 184, 1940. - PMC - PubMed
    1. Novack D. V., Teitelbaum S. L., Annu. Rev. Pathol. 2008, 3, 457. - PubMed
    1. Park S., Heo J. S., Mizuno S., Kim M., An H., Hong E., Kang M. G., Kim J., Yun R., Park H., Noh E. H., Lee M. J., Yoon K., Kim P., Son M., Pang K., Lee J., Park J., Ooshima A., Kim T. J., Park J. Y., Yang K. M., Myung S. J., Bae H., Lee K. M., Letterio J., Park S. H., Takahashi S., Kim S. J., Metabolism 2023, 151, 155746. - PubMed
    1. Eastell R., O'Neill T. W., Hofbauer L. C., Langdahl B., Reid I. R., Gold D. T., Cummings S. R., Nat. Rev. Dis. Primers 2016, 2, 16069. - PubMed
    1. Boyle W. J., Simonet W. S., Lacey D. L., Nature 2003, 423, 337. - PubMed

Substances

LinkOut - more resources