. 2024 Oct;11(38):e2401502.
doi: 10.1002/advs.202401502. Epub 2024 Aug 9.

Multifaceted Proteome Analysis at Solubility, Redox, and Expression Dimensions for Target Identification

Affiliations

Multifaceted Proteome Analysis at Solubility, Redox, and Expression Dimensions for Target Identification

Amir A Saei et al. Adv Sci (Weinh). 2024 Oct.

Abstract

Multifaceted interrogation of the proteome deepens the system-wide understanding of biological systems; however, mapping the redox changes in the proteome has so far been significantly more challenging than expression and solubility/stability analyses. Here, the first high-throughput redox proteomics approach integrated with expression analysis (REX) is devised and combined with the Proteome Integral Solubility Alteration (PISA) assay. The whole PISA-REX experiment with up to four biological replicates can be multiplexed into a single tandem mass tag TMTpro set. For benchmarking this compact tool, HCT116 cells treated with auranofin are analyzed, showing great improvement compared with previous studies. PISA-REX is then applied to study proteome remodeling upon stimulation of human monocytes by interferon α (IFN-α). Applying this tool to study the proteome changes in plasmacytoid dendritic cells (pDCs) isolated from wild-type versus Ncf1-mutant mice treated with interferon α, shows that NCF1 deficiency enhances the STAT1 pathway and modulates the expression, solubility, and redox state of interferon-induced proteins. Providing comprehensive multifaceted information on the proteome, the compact PISA-REX has the potential to become an industry standard in proteomics and to open new windows into the biology of health and disease.

Keywords: auranofin; immunology; interferon; lupus; mass spectrometry; oxidation and reduction.


Conflict of interest statement

The authors declare no conflict of interest.

Figures
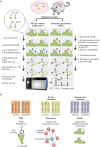
Figure 1
Figure 1
PISA‐REX workflow and experiment design. a) The REX sample preparation protocol for one condition is shown. A given biological sample is divided into two portions. One portion intended for expression analysis is processed according to the routine proteomics workflow, with full reduction of Cys with DTT and alkylation with IAA. The other portion devoted to redox analysis is first labeled with IAA, and after removal of IAA, DTT is added to reduce the disulfide bonds and reversibly oxidized Cys and block them with NEM. b) The experimental design for inclusion of PISA and REX proteomics samples within a TMTpro‐18plex set‐up. The expected information obtained from each type of analysis is shown. In biological systems where a higher variation is expected, e.g., patient samples, this experimental design can be adapted to include more replicates of any dimensions including REX.
Figure 2
Figure 2
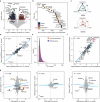
Benchmarking PISA‐REX. a) A 2 h treatment with auranofin induces massive changes in the redox state of the proteome. P values were calculated using a two‐sided Student's t‐test. Peptides with an absolute log2FC > 0.25 and p‐value less than 0.01 are highlighted. b) Waterfall plot of the top targets ranked across all three dimensions upon auranofin treatment (all proteins have a Fisher p‐value < 0.05 across all three dimensions). The pie piece size is proportional to the ranking of each protein in the respective dimension (the lower the ranking, the bigger the piece). c) Radarplots depict the redox, solubility, and expression changes of top proteins GCLM and TXNRD1 upon auranofin treatment (the radarplots range from log2FC −2.5 to 2.5; the coloring is stochastic). d) Correlation of protein abundance changes calculated using actual expression channels or those inferred from the non‐Cys peptides in REX (REXpression) in dataset 2. Only peptides passing significance in REXpression were used. Proteins with p‐value <0.05 across both analyses were used. e) The distribution of CV between replicates for REXpression versus expression in dataset 2. f) Correlation between FCs obtained from normalization of REX data to the expression channels versus to the sum of non‐Cys peptides from the same REX channels in dataset 2. Peptides with p‐value < 0.05 across both analyses were used. g) The scatterplot of different facets highlights proteins changing in different dimensions (the cognate target TXNRD1 is shown in green circles). Proteins or peptides with an absolute log2FC of > 0.25 and p‐value < 0.05 across both dimensions are highlighted. Expression and REX experiments were performed in 3 replicates and PISA experiments in 2 replicates.
Figure 3
Figure 3
IFN‐α induces massive oxidation and upregulation of cellular proteins, along with changes in protein solubility. a) The extent of ROS generation across different IFN‐α concentrations (data are represented as mean ± SD). b) Redox changes in the proteome upon IFN‐α treatment. Peptides with an absolute log2FC > 0.5 and p‐value less than 0.01 are highlighted. c) The oxidation of three STAT1 peptides upon IFN‐α treatment. Boxplots: Center line‐median; box limits contain 50% of data; upper and lower quartiles, 75% and 25%; maximum‐greatest value excluding outliers; minimum‐least value excluding outliers; outliers‐more than 1.5 times of the upper and lower quartiles. Expression d) and solubility/solubility e) changes in the proteome upon IFN‐α treatment. Proteins with an absolute log2FC > 0.5 and p‐value less than 0.01 or 0.05 are highlighted in panels d and e. f) Top ranking proteins across all three dimensions (all proteins have a combined Fisher p‐value < 0.05). The pie piece size is proportional to the ranking of each protein in the respective dimension—larger sector for higher ranking. g) The change in the redox state, solubility, and expression of top‐ranking proteins. The radarplots range from log2FC −2.5 to 2.5. All experiments were performed in 3 independent biological replicates (PISA assay in 2 replicates), and p‐values were calculated using a two‐sided Student's t‐test.
Figure 4
Figure 4
PISA‐REX for studying a mouse model of lupus. a–c) Changes in the redox state, solubility, and expression level of proteins in pDC cells isolated from Ncf1m1j/m1j mice versus wt littermates stimulated with IFN‐α in cell culture. The highlighted outliers have an absolute log2FC higher than 0.5 and p‐value less than 0.05. NCF2 is added due to its relevance to NCF1. d) The top targets ranked across three dimensions. The pie piece size is proportional to the ranking of each protein in the respective dimension. e) The changes in the redox state, solubility and expression level of top targets. The radarplots range from log2FC −2.5 to 2.5. The f) redox state of four NCF1 peptides, g) the change in the solubility of NFKB1 and NFKB2, and redox state of NFKB1 h) in Ncf1‐mutant versus wt cells stimulated with IFN. i) Phosphorylation of IRF3 in dendritic cells within peripheral blood from 3‐month‐old BQ.Yaa (n = 8) and BQ.Ncf1m1j/m1j.Yaa (n = 6) mice. j) The differential solubility, k) REXpression, and l) redox state of proteins as representative ISGs, in Ncf1‐mutant versus wt cells stimulated with IFN. m) Expression of STAT1 and p‐STAT1 in pDCs within peritoneal exudate cells from B10.Q, B10.Q.Ncf1m1j/m1j , and Ncf1m1j/m1j.MNtg mice (of each n = 4) at day 3 post pristane injection. Representative histograms are presented. Results are shown as mean ± SEM. Statistical significance is determined by the Two‐tailed Mann–Whitney U test in (i) and one‐way analysis of variance with Tukey's multiple comparison test in (m). For all other panels, significance is calculated by two‐sided Student's t‐test with unequal variance. All experiments were performed in at least 3 independent biological replicates (PISA assay in 2 replicates), unless otherwise specified. Boxplots: Center line‐median; box limits contain 50% of data; upper and lower quartiles, 75% and 25%; maximum‐greatest value excluding outliers; minimum‐least value excluding outliers; outliers‐more than 1.5 times of the upper and lower quartiles.

References

    1. Saei A. A., Gullberg H., Sabatier P., Beusch C. M., Johansson K., Lundgren B., Arvidsson P. I., Arnér E. S. J. J., Zubarev R. A., Redox Biol. 2020, 32, 101491. - PMC - PubMed
    1. Savitski M. M. F., Reinhard F. B. M., Franken H., Werner T., Savitski M. M. F., Eberhard D., Molina D. M., Jafari R., Dovega R. B., Klaeger S., Kuster B., Nordlund P., Bantscheff M., Drewes G., Science 2014, 346, 1255784. - PubMed
    1. Molina D. M., Jafari R., Ignatushchenko M., Seki T., Larsson E. A., Dan C., Sreekumar L., Cao Y., Nordlund P., Science 2013, 341, 84. - PubMed
    1. Gaetani M., Sabatier P., Saei A. A., Beusch C. M., Yang Z., Lundström S. L., Zubarev R. A., J. Proteome Res. 2019, 18, 4027. - PubMed
    1. Sabatier P., Beusch C. M., Saei A. A., Aoun M., Moruzzi N., Coelho A., Leijten N., Nordenskjöld M., Micke P., Maltseva D., Tonevitsky A. G., Millischer V., Villaescusa J. C., Kadekar S., Gaetani M., Altynbekova K., Kel A., Berggren P. O., Simonson O., Grinnemo K. H., Holmdahl R., Rodin S., Zubarev R. A., Nat. Commun. 2021, 12, 6558. - PMC - PubMed

LinkOut - more resources