. 2024 Sep 25;9(9):e0025124.
doi: 10.1128/msphere.00251-24. Epub 2024 Aug 9.

Two cyanobacterial species exhibit stress responses when grown together in visible light or far-red light

Affiliations

Two cyanobacterial species exhibit stress responses when grown together in visible light or far-red light

Ting-Shuo Nien et al. mSphere. .

Abstract

Although most cyanobacteria grow in visible light (VL; λ = 400-700 nm), some cyanobacteria can also use far-red light (FRL; λ = 700-800 nm) for oxygenic photosynthesis by performing far-red light photoacclimation. These two types of cyanobacteria can be found in the same environment. However, how they respond to each other remains unknown. Here, we reveal that coculture stresses FRL-using Chlorogloeopsis fritschii PCC 9212 and VL-using Synechocystis sp. PCC 6803. No significant growth difference was found in Synechocystis sp. PCC 6803 between the coculture and the monoculture. Conversely, the growth of Chlorogloeopsis fritschii PCC 9212 was suppressed in VL under coculture. According to transcriptomic analysis, Chlorogloeopsis fritschii PCC 9212 in coculture shows low transcript levels of metabolic activities and high transcript levels of ion transporters, with the differences being more noticeable in VL than in FRL. The transcript levels of stress responses in coculture were likewise higher than in monoculture in Synechocystis sp. PCC 6803 under FRL. The low transcript level of metabolic activities in coculture or the inhibition of cyanobacterial growth indicates a possible negative interaction between these two cyanobacterial strains.IMPORTANCEThe interaction between two cyanobacterial species is the primary focus of this study. One species harvests visible light, while the other can harvest far-red and visible light. Prior research on cyanobacteria interaction concentrated on its interactions with algal, coral, and fungal species. Interactions between cyanobacterial species were, nevertheless, rarely discussed. Thus, we characterized the interaction between two cyanobacterial species, one capable of photosynthesis using far-red light and the other not. Through experimental and bioinformatic approaches, we demonstrate that when one cyanobacterium thrives under optimal light conditions, it stresses the remaining cyanobacterial species. We contribute to an ecological understanding of these two kinds of cyanobacteria distribution patterns. Cyanobacteria that utilize far-red light probably disperse in environments with limited visible light to avoid competition with other cyanobacteria. From a biotechnological standpoint, this study suggests that the simultaneous cultivation of two cyanobacterial species in large-scale cultivation facilities may reduce the overall biomass yield.

Keywords: coculture; cyanobacteria; far-red light photoacclimation (FaRLiP); negative interaction; transcriptomic analysis.


Conflict of interest statement

The authors declare no conflict of interest.

Figures

Fig 1
Fig 1
Microscopic images and experimental design. Microscopic images of (A) Synechocystis sp. PCC 6803 (Syn6803) and (B) Chlorogloeopsis fritschii PCC 9212 (Cf9212). Scale bars indicate 10 µm. (C) A schematic diagram illustrating the experimental design in this study. Light green dots represent Syn6803, which exclusively utilizes visible light for photosynthesis. Dark green solid circles represent Cf9212, which utilizes VL or FRL for photosynthesis. VL: visible light. FRL: far-red light. The methods employed in the study are shown to the right of the vertical dashed line.
Fig 2
Fig 2
Growth and pigment measurements of (A) Syn6803 and (C) Cf9212 in monoculture (light yellow in Syn6803, green in Cf9212) and coculture (purple in Syn6803, orange in Cf9212) under VL (blue background) and FRL (red background). OD750, dry weight, chlorophyll a (Chl a) per OD750, and carotenoid per OD750 were measured. (B) A schematic diagram summarizing the results in panels A and C. The red arrow indicates the value is significantly higher in coculture than in monoculture, the blue arrows indicate the values are significantly lower in coculture than in monoculture, and the dashed lines mean there is no significant difference between monoculture and coculture. (D) pH values of Cf9212 monoculture, Syn6803 monoculture, and coculture were measured at the start of culturing (0 hours), after 30 hours in VL, and after 5 days in FRL. Mann-Whitney U test was conducted based on at least three replicates. Statistical significance levels are indicated as follows: *P < 0.05, **P < 0.01, ***P < 0.001; ns, non-significant. Mono, monoculture, Co, coculture.
Fig 3
Fig 3
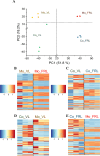
Transcriptomic analyses of Syn6803 under monoculture or coculture condition in VL or FRL. (A) PCA was performed on the transcriptomic profiles of Syn6803. Each dot represents RNA-seq data obtained from Syn6803 monoculture (Mo) or coculture (Co) under VL or FRL. The experiment was conducted in triplicate for each condition. Heatmaps of the top 500 DEGs are shown for (B) Syn6803 monoculture and (C) Syn6803 coculture under VL or FRL conditions. (D) Comparison of coculture and monoculture of Syn6803 in VL and (E) comparison of coculture and monoculture of Syn6803 in FRL. DEGs were selected based on the smallest adjusted P-values from the RNA-seq data comparison. The color scale represents the z-score values of gene expression levels, with red indicating upregulation and blue indicating downregulation in the comparison. Each row corresponds to an individual gene, and the columns represent three biological replicates for each condition.
Fig 4
Fig 4
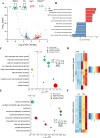
Transcriptomic profiles and gene ontology enrichment analysis of DEGs from the comparison between monoculture and coculture of Syn6803 in FRL. (A) Volcano plot of Syn6803 transcriptomic profiles in monoculture and coculture under FRL. Genes with adjusted P-values <0.05 and log2(fold change) >1 are highlighted in red (upregulated) and blue (downregulated), respectively. (B) Top 10 regulated DEGs from the comparison between monoculture and coculture of Syn6803 in FRL. Genes upregulated in coculture are marked in red, and genes downregulated in coculture are marked in blue. (C) Bubble plot of function annotations from upregulated genes in coculture. Each dot represents a function annotation from the GO database (red for biological process, blue for molecular function, and yellow for cellular component) or STRING database (green). The size of the dots is defined as the ratio of DEGs to total genes in each function annotation. The vertical dashed line represents a false discovery rate of 0.05. (D) Heatmap of type II protein secretion system-related genes. Only the differentially expressed genes are shown in the heatmap. The color scale represents the z-score values of the gene expression levels, with red indicating upregulation and blue indicating downregulation in coculture compared to monoculture. Mo, monoculture. Co, coculture.
Fig 5
Fig 5
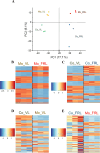
Transcriptomic analyses of Cf9212 under monoculture or coculture condition in VL or FRL. (A) PCA was performed on the transcriptomic profiles of Cf9212. Each dot represents RNA-seq data obtained from Cf9212 monoculture (Mo) or coculture (Co) under VL or FRL. The experiment was conducted in triplicate for each condition. Heatmaps of the top 500 DEGs are shown for (B) Cf9212 monoculture and (C) Cf9212 coculture under VL or FRL conditions. (D) Comparison of coculture and monoculture of Cf9212 in VL and (E) comparison of coculture and monoculture of Cf9212 in FRL. DEGs were selected based on the smallest adjusted P-values from the RNA-seq data comparison. The color scale represents the z-score values of gene expression levels, with red indicating upregulation and blue indicating downregulation in the two conditions. Each row corresponds to an individual gene, and the columns represent three biological replicates for each condition.
Fig 6
Fig 6
Transcriptomic profiles and gene ontology enrichment analysis of DEGs from the comparison between monoculture and coculture of Cf9212 in VL. (A) Volcano plot of Cf9212 transcriptomic profiles in monoculture and coculture under VL. Genes with adjusted P-values < 0.05 and log2(fold change) >1 are highlighted in red (upregulated) and blue (downregulated), respectively. (B) Top 10 regulated DEGs from the comparison between monoculture and coculture of Cf9212 in VL. Genes upregulated in coculture are marked in red, and genes downregulated in coculture are marked in blue. Bubble plot of function annotations from (C) upregulated genes and (E) downregulated genes in coculture. Each dot in panels C and E represents a function annotation from the GO database (red for biological process, blue for molecular function, and yellow for cellular component) or STRING database (green). The size of the dots is defined as the ratio of DEGs to total genes in each function annotation. The vertical dashed line represents a false discovery rate of 0.05. Heatmap of (D) ion transport-related genes from upregulated DEGs and (F) ribosome-related genes from downregulated DEGs. The z-score values of the gene expression levels are depicted on the color scale; in coculture, downregulation is indicated by blue, while upregulation is denoted by red, compared to monoculture. Mo, monoculture. Co, coculture.
Fig 7
Fig 7
The schematic diagram illustrates the conclusions of this study.

References

    1. Sinha RP, Häder D-P. 2008. UV-protectants in cyanobacteria. Plant Sci 174:278–289. doi:10.1016/j.plantsci.2007.12.004 - DOI
    1. Ho M-Y, Bryant DA. 2021. Photosynthesis | long wavelength pigments in photosynthesis, p 245–255. In Jez J (ed), Encyclopedia of biological chemistry III, 3rd ed. Elsevier, Oxford.
    1. McCree KJ. 1973. The measurement of photosynthetically active radiation. Solar Energy 15:83–87. doi:10.1016/0038-092X(73)90010-8 - DOI
    1. Zhao C, Gan F, Shen G, Bryant DA. 2015. RfpA, RfpB, and RfpC are the master control elements of far-red light photoacclimation (FaRLiP). Front Microbiol 6:1303. doi:10.3389/fmicb.2015.01303 - DOI - PMC - PubMed
    1. Gilbert IR, Jarvis PG, Smith H. 2001. Proximity signal and shade avoidance differences between early and late successional trees. Nature 411:792–795. doi:10.1038/35081062 - DOI - PubMed

LinkOut - more resources