. 2024 Jul 24;13(15):1242.
doi: 10.3390/cells13151242.

Synthetic mRNAs Containing Minimalistic Untranslated Regions Are Highly Functional In Vitro and In Vivo

Affiliations

Synthetic mRNAs Containing Minimalistic Untranslated Regions Are Highly Functional In Vitro and In Vivo

Shahab Mamaghani et al. Cells. .

Abstract

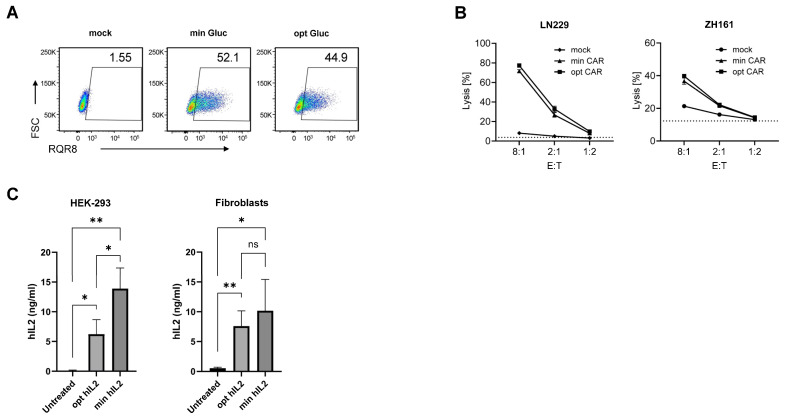
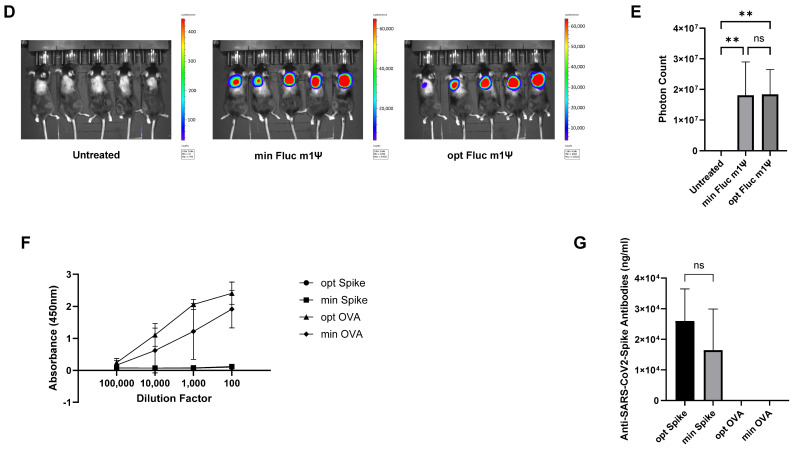
Synthetic mRNA produced by in vitro transcription (ivt mRNA) is the active pharmaceutical ingredient of approved anti-COVID-19 vaccines and of many drugs under development. Such synthetic mRNA typically contains several hundred bases of non-coding "untranslated" regions (UTRs) that are involved in the stabilization and translation of the mRNA. However, UTRs are often complex structures, which may complicate the entire production process. To eliminate this obstacle, we managed to reduce the total amount of nucleotides in the UTRs to only four bases. In this way, we generate minimal ivt mRNA ("minRNA"), which is less complex than the usual optimized ivt mRNAs that are contained, for example, in approved vaccines. We have compared the efficacy of minRNA to common augmented mRNAs (with UTRs of globin genes or those included in licensed vaccines) in vivo and in vitro and could demonstrate equivalent functionalities. Our minimal mRNA design will facilitate the further development and implementation of ivt mRNA-based vaccines and therapies.

Keywords: UTR; in vitro transcription; ivt mRNA; mRNA; untranslated regions.


Conflict of interest statement

The authors declare no conflicts of interest.

Figures

Figure 1
Figure 1
Functionality of the TISU 5′ UTR in unmodified mRNA. (A) Luciferase activity in HEK-293 cells 24 h after transfection of unmodified mRNAs containing no 5′UTR, a Kozak 5′UTR, or a TISU 5′ UTR and coding for gaussia luciferase (white bars) or firefly luciferase (grey bars). (B) Fluorescence over 48 h in HEK-293 cells after transfection of unmodified mRNAs containing no 5′UTR, a Kozak 5′UTR, or a TISU 5′ UTR and coding for ZsGreen. (A,B) Experiments were performed in triplicate and data are presented as the mean ± SD. One-way analysis of variance (ANOVA) with Tukey’s multiple comparison test was used to determine the significance between the different groups. ns = not significant, ** p < 0.01, **** p < 0.0001.
Figure 2
Figure 2
Impact of the length of the poly-A tail on the translation of the TISU 5′ UTR. Luciferase activity in HEK-293 cells 24 h after transfection of mRNAs coding for gaussia luciferase and containing a TISU 5′ UTR and different poly-A tail lengths. The experiment was performed in triplicate and data are presented as the mean ± SD. They were analyzed with one-way ANOVA. ns: not significant; ** p < 0.01; *** p < 0.001; **** p < 0.0001.
Figure 3
Figure 3
Functionality of the TISU 5′ UTR in methyl-1 pseudoU modified mRNA. (A,B) Luciferase activity in HEK-293 cells (A) and in human blood PBMCs (B) 24 h after transfection of methyl-1 PseudoU modified mRNAs containing no 5′UTR, a Kozak 5′UTR, or a TISU 5′ UTR and coding for either gaussia luciferase (white bars) or firefly luciferase (grey bars). (C) Fluorescence over 48 h in HEK-293 cells after transfection of methyl-1 PseudoU mRNAs containing no 5′UTR, a Kozak 5′UTR, or a TISU 5′ UTR and coding for ZsGreen. (AC) Experiments were performed in triplicate and data are presented as the mean ± SD. One-way ANOVA with Tukey’s multiple comparison test was used to determine the significance between the different groups. ns = not significant, * p < 0.05, *** p < 0.001, **** p < 0.0001.
Figure 4
Figure 4
Comparison of minRNA and optimized mRNAs in translating protein. (A) Schematic representation of the optimized (“opt”) and minimized (“min”) mRNAs. Depicted are the 5′ and 3′ UTRs of opt mRNA and the coding sequence (CDS) of both. minRNA lacks the conventional 5′ and 3′ UTRs and contains the 4-nucleotide-long TISU Translation Initiator of Short 5′ UTR (TISU) element. (B,C) Luciferase activity 24 h after transfection of min and opt mRNAs coding for (B) gaussia luciferase or (C) firefly luciferase in HEK-293 cells (left panels) and PBMCs (right panels). The mRNAs were unmodified or had full replacement of U residues by modified uracils (PseudoU “ψ”, methyl-1 Pseudo U “m1ψ”, or methoxy U “moU”). (D) Fluorescence in HEK-293 cells over 48 h after transfection of unmodified or methyl-1 pseudoU modified mRNAs coding for ZsGreen. (B,D) Experiments were performed in triplicate and data are presented as the mean ± SD. (B,C) Two-way or (D) one-way ANOVA with Tukey’s multiple comparison test was used to determine the significance between the different groups. ns = not significant, * p < 0.05, *** p < 0.001.
Figure 5
Figure 5
minRNA design coding for therapeutic proteins. (A,B) Human T cells were mock transfected or transfected with min or opt mRNA coding for NKG2D-CAR-T2A-RQR8. (A) Flow cytometry analysis for RQR8 surface expression 24 h after transfection. RQR8-positive cells were detected using anti-CD34-PE antibody (RQR8; PE: phycoerythrin) and forward scatter (FSC). (B) Flow cytometry quantifications of glioma cells surface-stained with PKH26 and incubated for 24 h with human T cells at different E:T ratios. Tumor cell viability was assessed using Zombie Violet and cell lysis was determined as the percentage of death in the population of labeled tumor cells. Unspecific background lysis is represented by dotted lines. (C) minRNA and optimized mRNA coding human IL-2 were transfected into HEK-293 or human primary fibroblasts. Supernatants were measured 96 h later for IL-2 production by ELISA. Experiments were performed in triplicate and data presented as the mean ± SD. An unpaired, two-tailed Student’s t-test was used to determine the significance between the different groups. ns = not significant, * p < 0.05, ** p <0.01. (D) Representative IVIS images of mice untreated or injected subcutaneously with mRNA coding for firefly luciferase with either the opt or min mRNA design. Regions of interest were quantified for average luminescence (counts) (IVIS Living Image 4.0) (E) Quantification of the photon flux shown in (D). (F,G) ELISA quantification of serum antibodies against ovalbumin or spike in mice injected subcutaneously with LNP containing min or opt mRNA coding ovalbumin or spike. (EG) N = 5 mice per group. Data are presented as the mean ± SD. (E) One-way ANOVA with Tukey’s multiple comparison test or (G) an unpaired, two-tailed Student’s t-test was used to determine the significance between the different groups. ns = not significant, ** p < 0.01.
Figure 5
Figure 5
minRNA design coding for therapeutic proteins. (A,B) Human T cells were mock transfected or transfected with min or opt mRNA coding for NKG2D-CAR-T2A-RQR8. (A) Flow cytometry analysis for RQR8 surface expression 24 h after transfection. RQR8-positive cells were detected using anti-CD34-PE antibody (RQR8; PE: phycoerythrin) and forward scatter (FSC). (B) Flow cytometry quantifications of glioma cells surface-stained with PKH26 and incubated for 24 h with human T cells at different E:T ratios. Tumor cell viability was assessed using Zombie Violet and cell lysis was determined as the percentage of death in the population of labeled tumor cells. Unspecific background lysis is represented by dotted lines. (C) minRNA and optimized mRNA coding human IL-2 were transfected into HEK-293 or human primary fibroblasts. Supernatants were measured 96 h later for IL-2 production by ELISA. Experiments were performed in triplicate and data presented as the mean ± SD. An unpaired, two-tailed Student’s t-test was used to determine the significance between the different groups. ns = not significant, * p < 0.05, ** p <0.01. (D) Representative IVIS images of mice untreated or injected subcutaneously with mRNA coding for firefly luciferase with either the opt or min mRNA design. Regions of interest were quantified for average luminescence (counts) (IVIS Living Image 4.0) (E) Quantification of the photon flux shown in (D). (F,G) ELISA quantification of serum antibodies against ovalbumin or spike in mice injected subcutaneously with LNP containing min or opt mRNA coding ovalbumin or spike. (EG) N = 5 mice per group. Data are presented as the mean ± SD. (E) One-way ANOVA with Tukey’s multiple comparison test or (G) an unpaired, two-tailed Student’s t-test was used to determine the significance between the different groups. ns = not significant, ** p < 0.01.

References

    1. Sahin U., Kariko K., Tureci Ö. mRNA-Based Therapeutics – Developing a New Class of Drugs. Nat. Rev. Drug Discov. 2014;13:759–780. doi: 10.1038/nrd4278. - DOI - PubMed
    1. Kruger K., Grabowski P.J., Zaug A.J., Sands J., Gottschling D.E., Cech T.R. Self-splicing RNA: Autoexcision and autocyclization of the ribosomal RNA intervening sequence of tetrahymena. Cell. 1982;31:147–157. doi: 10.1016/0092-8674(82)90414-7. - DOI - PubMed
    1. Melton D., Krieg P., Rebagliati M., Maniatis T., Zinn K., Green M. Efficientin vitrosynthesis of biologically active RNA and RNA hybridization probes from plasmids containing a bacteriophage SP6 promoter. Nucleic Acids Res. 1984;12:7035–7056. doi: 10.1093/nar/12.18.7035. - DOI - PMC - PubMed
    1. Krieg P.A., Melton D.A. Functional messenger RNAs are produced by SP6in vitrotranscription of cloned cDNAs. Nucleic Acids Res. 1984;12:7057–7070. doi: 10.1093/nar/12.18.7057. - DOI - PMC - PubMed
    1. Wolff J.A., Malone R.W., Williams P., Chong W., Acsadi G., Jani A., Felgner P.L. Direct gene transfer into mouse muscle in vivo. Science. 1990;247:1465–1468. doi: 10.1126/science.1690918. - DOI - PubMed

Publication types

Grants and funding

LinkOut - more resources