. 2024 Jul 31;13(15):1287.
doi: 10.3390/cells13151287.

Regulatory B Cells Expressing Granzyme B from Tolerant Renal Transplant Patients: Highly Differentiated B Cells with a Unique Pathway with a Specific Regulatory Profile and Strong Interactions with Immune System Cells

Affiliations

Regulatory B Cells Expressing Granzyme B from Tolerant Renal Transplant Patients: Highly Differentiated B Cells with a Unique Pathway with a Specific Regulatory Profile and Strong Interactions with Immune System Cells

Nicolas Sailliet et al. Cells. .

Abstract

The aim of our study was to determine whether granzyme B-expressing regulatory B cells (GZMB+ B cells) are enriched in the blood of transplant patients with renal graft tolerance. To achieve this goal, we analysed two single-cell RNA sequencing (scRNAseq) datasets: (1) peripheral blood mononuclear cells (PBMCs), including GZMB+ B cells from renal transplant patients, i.e., patients with stable graft function on conventional immunosuppressive treatment (STA, n = 3), drug-free tolerant patients (TOL, n = 3), and patients with antibody-mediated rejection (ABMR, n = 3), and (2) ex-vivo-induced GZMB+ B cells from these groups. In the patient PBMCs, we first showed that natural GZMB+ B cells were enriched in genes specific to Natural Killer (NK) cells (such as NKG7 and KLRD1) and regulatory B cells (such as GZMB, IL10, and CCL4). We performed a pseudotemporal trajectory analysis of natural GZMB+ B cells and showed that they were highly differentiated B cells with a trajectory that is very different from that of conventional memory B cells and linked to the transcription factor KLF13. By specifically analysing GZMB+ natural B cells in TOLs, we found that these cells had a very specific transcriptomic profile associated with a reduction in the expression of HLA molecules, apoptosis, and the inflammatory response (in general) in the blood and that this signature was conserved after ex vivo induction, with the induction of genes associated with migration processes, such as CCR7, CCL3, or CCL4. An analysis of receptor/ligand interactions between these GZMB+/- natural B cells and all of the immune cells present in PBMCs also demonstrated that GZMB+ B cells were the B cells that carried the most ligands and had the most interactions with other immune cells, particularly in tolerant patients. Finally, we showed that these GZMB+ B cells were able to infiltrate the graft under inflammatory conditions, thus suggesting that they can act in locations where immune events occur.

Keywords: B cells; kidney; lymphocyte; regulation; tolerance; transplantation.


Conflict of interest statement

The authors declare that the research was conducted in the absence of any commercial or financial relationships that could be construed as potential conflicts of interest.

Figures
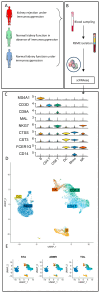
Figure 1
Figure 1
Single-cell RNA sequencing of PBMC from kidney-transplanted patients. Schematic representation of the experiment. (A) scRNAseq was performed on PBMCs from kidney-transplanted patients (STA = 3/TOL = 3/ABMR = 3). (B) Identical sampling methods were performed for all patients. PBMCs were sequenced using multiplexed CITE-seq protocols. (C) Genes identifying immune cell sub-populations are shown in violin plots. (D,E) UMAP represents the main populations of NK/CD4 T cells/CD8 T cells/DC/monocytes and B cells in blood from transplanted patients. Each dot represents a cell, and each group of coloured dots represents one cell population. UMAPs show all cells of the dataset (D) or are split according to the group of patients (E).
Figure 2
Figure 2
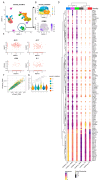
Single-cell sequencing gene expression across B cell clusters. (A) UMAP representation of PBMC clusters made using seurat FindClusters() function. Clusters 5 and 7 were associated with MS4A1+ B cells. (B) UMAP representation of the PBMC Clusters 5 and 7 sub-clusterization leading to the identification of 6 B cell sub-clusters. (C) UMAP of GZMB expression in B cells. Cluster 3 was identified as GZMB+ B cells. (D) Dotplot representation of DEG in GZMB+ B cell Cluster 3 and GZMB B cell Clusters 0, 1, 2, 4, and 5. Only the DEGs within each group of patients are shown. Dots are coloured based on the average expression of the gene in the cluster, and the dot size represents the percentage of cells expressing the gene. (E) Scatter plots showing the co-expression of MS4A1 (CD20) with either NKG7, KLRD1, CD160, or CD247 in Cluster 3. (F) Scatter plot of the quality control metrics “nFeatures_RNA” and “nCounts_RNA” used to determine cell doublets. (G) Aggregated average expression levels of each gene of the regulatory B cell signature described by Dubois et al. [37] at the single-cell level, subtracted by the aggregated expression of 100 control features, within B cell clusters. Differences were defined as statistically significant when p < 0.01 (*), p < 0.001 (**), and p < 0.0001 (****).
Figure 3
Figure 3
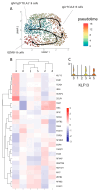
Single-cell RNA sequencing trajectory analysis of B cells: (A) UMAP of B cell trajectories using Monocle v3. TCL1A+ IgD+ IgM+ B cells were chosen as the origin cell cluster, and the arrows highlight the trajectories. Cells are coloured according to their differentiated state, ranging from blue (naive) to red (terminally differentiated). (B) Heatmap of the significantly enriched target gene sets’ downstream transcription factors grouped according to the B cell clusters. (C) Violin plot of KLF13 expression across B cell clusters.
Figure 4
Figure 4
Characterisation of TOL GZMB+ B cells’ specific genes. DEGs in TOL patients compared to STA and ABMR within each B cell cluster were summarised in an UpSetPlot representing the number of DEGs in different B cell clusters. Solid black dots represent clusters, and genes differentially expressed in several B clusters are indicated by two or more dots connected by a line. The vertical bar plot indicates the number of DEGs representing each combination, while the horizontal bar plot indicates the number of DEGs between TOL and other groups in each B cell cluster.
Figure 5
Figure 5
Single-cell RNA sequencing from GZMB+ B cells generated in vitro. (A) Schematic representation of the groups. RNA sequencing was performed on ex-vivo-induced GZMB+ B cells from kidney-transplanted patients (STA, TOL, ABMR) prior to scRNAseq. (B) GZMB+ B cells or GZMB B cells were generated from sorted blood B cells for 3 days prior to scRNAseq. (C,D) UMAP representing the clustering of B cells according to the experimental design in all groups and per group, and violin plot showing the aggregated average expression levels of each gene of the regulatory B cell signature described by Dubois et al. [37] at the single-cell level, subtracted by the aggregated expression of 100 control features within B cell clusters. Each dot represents a cell, and each colour represents either the GZMB B cells (unstimulated B cells) or the GZMB+ B cells (stimulated B cells) across UMAPs. UMAPs show all cells of the dataset (C) or are split according to the clinical groups (D). Differences were defined as statistically significant when p < 0.0001 (****).
Figure 6
Figure 6
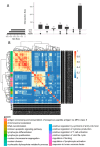
DEG specific to induced GZMB+ B cells from TOL. (A) DEGs in GZMB+ B cells compared to GZMB B cells within groups were summarised in an UpSetPlot with the number of DEGs between GZMB+ and GZMB B cells. Solid black dots represent groups, and genes differentially expressed in several groups are indicated by two or more dots connected by a line. The vertical bar plot indicates the number of DEGs representing each combination, while the horizontal bar plot indicates the number of DEGs between GZMB+ and GZMB B cells in each group. (B) Similarity matrix of the 198 ontologies associated with the 316 differentially expressed genes common to all groups.
Figure 7
Figure 7
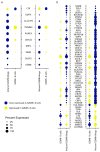
Induced GZMB+ B cells’ and natural GZMB+ B cells’ gene overlap. (A) The signatures of GZMB+ B cells generated from the two datasets of induced GZMB+ B cells (316 genes) and natural GZMB+ B cells (114 genes) have been crossed. The 10 resulting genes are common to natural and induced GZMB+ B cells and common to TOL, STA, and ABMR. (B) The signatures of GZMB+ B cells in TOL generated from the two datasets of induced GZMB+ B cells (449 genes) and natural GZMB+ B cells (397 genes) have been crossed. The 56 resulting genes are common to natural and induced GZMB+ B cells from TOL. The expression levels are shown by dotplots. The width of the dots represents the percentage of expressing cells for each condition. Genes upregulated in GZMB+ B cells are associated with blue dots, and genes downregulated in GZMB+ B cells are associated with yellow dots.
Figure 8
Figure 8
Natural GZMB+ B cells ligand–receptor pairs formed with blood immune cells. Nichenet analysis was performed, and communications contributing to signalling from GZMB and GZMB+ B cells to other immune cells are shown in mushroom plots as ligand (blue) and receptor (red) expression across clusters. Each plot is associated with one population of target cells. The size of the semi-circles represents the percentage of cells expressing the gene, and the colour intensity represents the relative expression across B cell clusters (ligand) and immune populations (receptor).
Figure 9
Figure 9
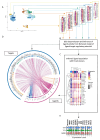
GZMB+/− B cell communication with blood immune cells in TOL. (A) DEGs between TOL and STA or ABMR among dendritic cells (yellow), monocytes (dark blue), CD8 T (dark green), CD4 T (light blue), NK (vermilion), and B cells (orange) were used to infer ligand activity based on the Nichenet model. Only the 50 most common DEGs are represented in the dotplots. (B) Nichenet uses correlation matrix of ligand–target regulatory potential generated from public databases to infer ligand and receptor activity. (C) Ligands predicted to be associated with the transcriptional profile in TOL were then visualised within B cell clusters, as represented with dotplots. (D) Circos plot visualisation of predicted ligands on GZMB+ and GZMB B cell clusters and their targets on the different immune populations. The width of the arrows represents the strength of the interactions according to the Nichenet model. Target genes are coloured according to the immune population in which they are differentially expressed (same colours as Figure 7A). Arrows are coloured according to the B cell cluster overexpressing the associated ligand (same colours as Figure 7C). Only the 2000 strongest associations are represented (ligand to target pairs, represented by the arrows). (E) Expressions of ligands assigned to GZMB+ B cell Cluster 3 are represented by violin plots.
Figure 10
Figure 10
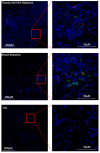
GZMB+ B cells infiltrate the graft under inflammatory conditions. IHC staining using the OPAL multiplex system in one representative biopsy of patient with plasma-cell-rich rejection (first row), mixed rejection (second row), tolerance (third row), and stability (last row) at 50 and 200 µM. Enlargement of one representative CD19+ GZMB+ cell was performed for all patients. For all images, the 3 fluorescence channels are merged to form one picture coloured by canal (DAPI—blue; CD19—green; GZMB—red).
Figure 10
Figure 10
GZMB+ B cells infiltrate the graft under inflammatory conditions. IHC staining using the OPAL multiplex system in one representative biopsy of patient with plasma-cell-rich rejection (first row), mixed rejection (second row), tolerance (third row), and stability (last row) at 50 and 200 µM. Enlargement of one representative CD19+ GZMB+ cell was performed for all patients. For all images, the 3 fluorescence channels are merged to form one picture coloured by canal (DAPI—blue; CD19—green; GZMB—red).

References

    1. Adams D.H., Sanchez-Fueyo A., Samuel D. From Immunosuppression to Tolerance. J. Hepatol. 2015;62:S170–S185. doi: 10.1016/j.jhep.2015.02.042. - DOI - PubMed
    1. Ashton-Chess J., Giral M., Brouard S., Soulillou J.-P. Spontaneous Operational Tolerance After Immunosuppressive Drug Withdrawal in Clinical Renal Allotransplantation. Transplantation. 2007;84:1215–1219. doi: 10.1097/01.tp.0000290683.54937.1b. - DOI - PubMed
    1. Benítez C., Londoño M.-C., Miquel R., Manzia T.-M., Abraldes J.G., Lozano J.-J., Martínez-Llordella M., López M., Angelico R., Bohne F., et al. Prospective Multicenter Clinical Trial of Immunosuppressive Drug Withdrawal in Stable Adult Liver Transplant Recipients: Hepatology. Hepatology. 2013;58:1824–1835. doi: 10.1002/hep.26426. - DOI - PubMed
    1. Taubert R., Danger R., Londoño M.-C., Christakoudi S., Martinez-Picola M., Rimola A., Manns M.P., Sánchez-Fueyo A., Jaeckel E. Hepatic Infiltrates in Operational Tolerant Patients After Liver Transplantation Show Enrichment of Regulatory T Cells Before Proinflammatory Genes Are Downregulated. Am. J. Transplant. 2016;16:1285–1293. doi: 10.1111/ajt.13617. - DOI - PubMed
    1. Guinn M.T., Szuter E.S., Yokose T., Ge J., Rosales I.A., Chetal K., Sadreyev R.I., Cuenca A.G., Kreisel D., Sage P.T., et al. Intragraft B Cell Differentiation during the Development of Tolerance to Kidney Allografts Is Associated with a Regulatory B Cell Signature Revealed by Single Cell Transcriptomics. Am. J. Transplant. 2023;23:1319–1330. doi: 10.1016/j.ajt.2023.05.036. - DOI - PMC - PubMed

Publication types

LinkOut - more resources