. 2024 Oct 15;30(20):4701-4713.
doi: 10.1158/1078-0432.CCR-24-1835.

HER2 Antibody-Drug Conjugates Are Active against Desmoplastic Small Round Cell Tumor

Affiliations

HER2 Antibody-Drug Conjugates Are Active against Desmoplastic Small Round Cell Tumor

Tom Zhang et al. Clin Cancer Res. .

Abstract

Purpose: Desmoplastic small round cell tumor (DSRCT) is a rare but highly aggressive soft tissue sarcoma that arises in the abdominopelvic cavity of young males. Since the discovery of EWSR1::WT1 fusion as the driver of DSRCT, no actionable genomic alterations have been identified, limiting disease management to a combination of surgery, chemotherapy, and radiation, with very poor outcomes. Herein, we evaluated ERBB2/HER2 expression in DSRCT as a therapeutic target.

Experimental design: ERBB2/HER2 expression was assessed in clinical samples and patient-derived xenografts (PDX) using RNA sequencing, RT-qPCR, and a newly developed HER2 IHC assay (clone 29D8). Responses to HER2 antibody-drug conjugates (ADC)-trastuzumab deruxtecan (T-DXd) and trastuzumab emtansine-were evaluated in DSRCT PDX, cell line, and organoid models. Drug internalization was demonstrated by live microscopy. Apoptosis was evaluated by Western blotting and caspase activity assays.

Results: ERBB2/HER2 was detectable in DSRCT samples from patients and PDXs, with higher sensitivity RNA assays and improved IHC detectability using clone 29D8. Treatment of ERBB2/HER2-expressing DSRCT PDX, cell line, and organoid models with T-DXd or trastuzumab emtansine resulted in tumor regression. This therapeutic response was long-lasting in T-DXd-treated xenografts and was mediated by rapid HER2 ADC complex internalization and cytotoxicity, triggering p53-mediated apoptosis and growth arrest. Xenograft regression was associated with bystander payload effects triggering global tumor niche responses proportional to HER2 status.

Conclusions: ERBB2/HER2 is a therapeutic target in DSRCT. HER2 ADCs may represent novel options for managing this exceptionally aggressive sarcoma, possibly fulfilling an urgent and historically unmet need for more effective clinical therapy.


Conflict of interest statement

Conflict of Interest Statements

Tom Zhang, Christopher A. Febres-Aldana, Zebing Liu, Jenna-Marie Dix, Ryan Cheng, Raymond G. Dematteo, Allan JW Lui, Inna Khodos, Leo Gili, Marissa S. Mattar, Jeanine Lisanti, Charlene Kwong, Irina Linkov, Murray J. Tipping, Elisa de Stanchina, and Igor Odintsov report no potential conflicts of interest.

Romel Somwar received research grants from Helsinn Healthcare, SA, LOXO Oncology, Elevation Oncology, and Merus, all unrelated to this study.

Marc Ladanyi received advisory board compensation from Boehringer Ingelheim, AstraZeneca, Bristol-Myers Squibb, Takeda, and Bayer, and research support from LOXO Oncology, Elevation Oncology, and Helsinn Healthcare.

Figures
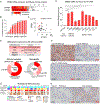
Figure 1.
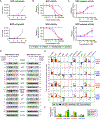
Figure 1.. Detection of ERBB2/HER2 expression in DSRCT
(A) Heatmap of ERBB2 and NTRK3 mRNA normalized expression (Nexp) by targeted RNA sequencing across 36 DSRCT clinical samples. Expression normalized using four housekeeping genes (CHMP2A, GPI, RAB7A, and VCP). Boxplot indicating the median Nexp, interquartile range, and calculated minimum and maximum values.**, P<0.01. (B) Cumulative frequency (percentage) of normalized ERBB2 expression by one-unit bins. (C) Correlation of ERBB2 and NTRK3 normalized expression. Red dots depicting cases with ERBB2 Nexp higher than NTRK3. (D) Relative ERBB2 mRNA expression following RT-qPCR of RNA obtained from various DSRCT cell lines and PDXs. ERBB2 expression normalized to GAPDH and compared to CHP100 as the negative control (ERBB2-negative Ewing Sarcoma [ES] cell line). Results represent the mean ± SE of three replicate determinations in one experiment. Arrows, DSRCT models used in downstream experiments. **, P<0.01; ***, P<0.001; ****, P<0.0001. (E) Detection and scoring of HER2 protein expression in DSRCT. Scoring criteria based on the intensity and extent of either complete or incomplete HER2 plasma membrane labeling, top panel. Detection rate of HER2 using clone 29D8 in DSRCT clinical samples (N=29) and xenografts (N=19), bottom panel. Characterization of clone 29D8 IHC shown in Supplementary Figure S3. (F) Examples of DSRCT with high, low, or ultralow HER2 expression. Red arrow depicting faint incomplete plasma membrane expression of HER2. (G) Scores, intensity, and extent of multiregional HER2 expression using clone 29D8 across 12 clinical cases, top panel. Post-NAC, post-neoadjuvant chemotherapy; POD, progression of disease; LN, lymph node. (H) Microphotographs of case #1 showing HER2 expression in the peritoneal tumor compared to liver metastasis.
Figure 2.
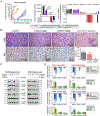
Figure 2.. HER2-ADC efficacy in DSRCT cell lines
(A) Cell growth of BER- and BOD-DSRCT cells treated with 100 nM of either T-DXd or T-DM1 in complete growth media and counted at 48 h intervals. Data points on the growth curve represent the mean cell count ± SD of four replicates. (B) Cell viability of BER- and BOD-DSRCT cells treated with increasing doses of T-DXd, TDM-1, or Trastuzumab for 96 h. Viability measured using AlamarBlue dye. Results represent the mean ± SD of two independent measurements. (C) Relative caspase 3/7 activity in BER- and BOD-DSRCT cells treated with increasing doses of T-DXd, TDM-1, or Trastuzumab for 96 h. Results represent the mean ± SD of three independent measurements. (D) Western blot profiling of apoptosis and cell cycle markers using whole cell extracts from DSRCT cell lines treated with 100nM T-DXd or T-DM1 for 24 and 48 h. (E) Quantitation of western blot shown in panel D. Densitometry signals quantified and normalized to corresponding loading controls followed by normalization to baseline levels. Relative total protein levels at each time point compared to baseline displayed as log2 of fold change. Results represent the mean ± SD of two independent measurements. *, P<0.05; **, P<0.01; ***, P<0.001; ****, P<0.0001. (F) Densitometry signal quantitation of phospho-p53 (serine 15) normalized to total p53 levels for the same treatment condition and compared to baseline. **, P<0.01.
Figure 3.
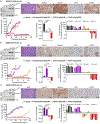
Figure 3.. BER-DSRCT xenograft experiments and HER2 depletion following HER2-ADC
(A) Growth of BER-DSRCT xenografts in immunocompromised NSG mice treated with T-DXd (1 mg/kg or 10 mg/kg every three weeks [Q3W]), T-DM1 (15 mg/kg weekly [QW]), trastuzumab (10 mg/kg Q3W), or vehicle when tumors reached ~150 mm3, left panel. Area-under-the-curve (AUC) of tumor volume over time and fraction of tumor volume change (%) from baseline for individual xenografts (mean ± SE), middle and right panels. ****, P<0.0001. (B) Pathologic characterization of BER-DSRCT xenografts treated with one dose of T-DXd 3 mg/kg, T-DXd 10 mg/kg, or vehicle and explanted after 48 h. Yellow arrows indicate mitotic figures. Ki67 nuclear labeling quantified in ~1000 tumoral cells within hotspot regions. Panel a: higher magnification of involuting tumor being replaced by collagen deposition (niche hyalinization). (C) Western blot profiling of ERBB-RTK (HER2, HER3, and EGFR) using whole cell extracts from DSRCT cell lines treated with 100nM T-DXd or T-DM1 for 24 and 48 h. Total ERBB proteins, along with corresponding phosphoproteins, are displayed. (D) Densitometry signal quantitation total ERBB protein levels, top panels, and phospho-ERBB levels (P-HER2, P-HER3, and P-EGFR), bottom panels. Total ERBB protein levels normalized to corresponding loading controls followed by normalization to baseline levels. Relative total ERBB protein levels at each time point compared to baseline displayed as log2 of fold change. Results represent the mean ± SD of two independent measurements. Phospho-ERBB levels normalized to total ERBB protein levels for the same treatment condition and normalized to baseline levels. **, P<0.01; ***, P<0.001; ****, P<0.0001.
Figure 4.
Figure 4.. T-Dxd internalization assays by live microscopy
BER- and BOD-DSRCT cell lines were incubated with 0.1 or 1 μM T-DXd conjugated to a green fluorescent pH-sensitive dye and 1 μg/mL Hoechst nuclear stain. Z-stack images were captured using a confocal microscope at 60 min and 120 min. Representative images of merged bright-field and Z-projected fluorescent signals were analyzed to quantify intracellular green fluorescent dots corresponding to T-DXd in the endolysosomes. Data represent the number of normalized green dots per μm2 of cell surface in three fields per well.
Figure 5.
Figure 5.. T-DXd efficacy in DSRCT PDXs
Molecular (EWSR1::WT1 RT-PCR results), histologic, and immunohistochemical characterization of DSRCT PDXs (top panels) treated with T-DXd (3 mg/kg or 10 mg/kg every 3 weeks [Q3W]), trastuzumab (20 mg/kg Q3W), or vehicle beginning when tumors reached ~100–150 mm3 (bottom panels). Tumor volume progression over treatment time with area-under-the-curve (AUC) analysis, and fraction of tumor volume change (%) from baseline for individual xenografts are displayed for DSRCT-PDX-216-2a (A), DSRCT-PDX-221-1a (B), and DSRCT-PDX-210-1b (C). HEK-293T and JN-DSRCT cell lines used as negative and positive controls for RT-PCR reactions, respectively. Individual xenograft growth, animal weights, and survival curves available in Supplementary Figures S8–S10. H&E, hematoxylin and eosin; PanCK, pan-cytokeratin; SYN, synaptophysin. ****, P<0.0001.
Figure 6.
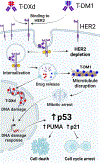
Figure 6.. Diagram depicting the mechanism of action of T-DXd and T-DM1 in DSRCT

References

    1. Gani F, Goel U, Canner JK, Meyer CF, Johnston FM. A national analysis of patterns of care and outcomes for adults diagnosed with desmoplastic small round cell tumors in the United States. J Surg Oncol. 2019;119:880–6. - PubMed
    1. Ladanyi M, Gerald W. Fusion of the EWS and WT1 genes in the desmoplastic small round cell tumor. Cancer Res. 1994;54:2837–40. - PubMed
    1. Gerald WL, Haber DA. The EWS–WT1 gene fusion in desmoplastic small round cell tumor. Semin Cancer Biol. 2005;15:197–205. - PubMed
    1. Magrath JW, Sampath SS, Flinchum DA, Hartono AB, Goldberg IN, Boehling JR, et al. Comprehensive Transcriptomic Analysis of EWSR1::WT1 Targets Identifies CDK4/6 Inhibitors as an Effective Therapy for Desmoplastic Small Round Cell Tumors. Cancer Res. 2024;84:OF1–17. - PMC - PubMed
    1. Schmidt D, Köster E, Harms D. Intraabdominal desmoplastic small-cell tumor with divergent differentiation: Clinicopathological findings and DNA ploidy. Méd Pediatr Oncol. 1994;22:97–102. - PubMed

MeSH terms