. 2024 Oct;11(38):e2402795.
doi: 10.1002/advs.202402795. Epub 2024 Aug 9.

MAPK Signaling-Mediated RFNG Phosphorylation and Nuclear Translocation Restrain Oxaliplatin-Induced Apoptosis and Ferroptosis

Affiliations

MAPK Signaling-Mediated RFNG Phosphorylation and Nuclear Translocation Restrain Oxaliplatin-Induced Apoptosis and Ferroptosis

Yuqin Di et al. Adv Sci (Weinh). 2024 Oct.

Abstract

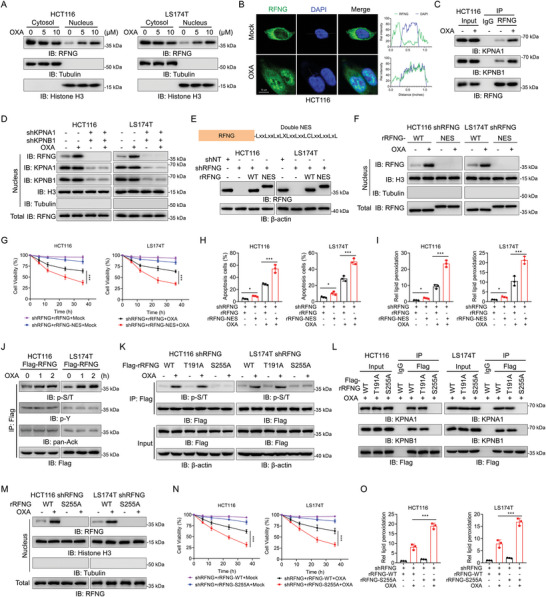
Chemotherapy resistance remains a major challenge in the treatment of colorectal cancer (CRC). Therefore, it is crucial to develop novel strategies to sensitize cancer cells to chemotherapy. Here, the fringe family is screened to determine their contribution to chemotherapy resistance in CRC. It is found that RFNG depletion significantly sensitizes cancer cells to oxaliplatin treatment. Mechanistically, chemotherapy-activated MAPK signaling induces ERK to phosphorylate RFNG Ser255 residue. Phosphorylated RFNG S255 (pS255) interacts with the nuclear importin proteins KPNA1/importin-α1 and KPNB1/importin-β1, leading to its translocation into the nucleus where it targets p53 and inhibits its phosphorylation by competitively inhibiting the binding of CHK2 to p53. Consequently, the expression of CDKN1A is decreased and that of SLC7A11 is increased, leading to the inhibition of apoptosis and ferroptosis. In contrast, phosphor-deficient RFNG S225A mutant showed increased apoptosis and ferroptosis, and exhibited a notable response to oxaliplatin chemotherapy both in vitro and in vivo. It is further revealed that patients with low RFNG pS255 exhibited significant sensitivity to oxaliplatin in a patient-derived xenograft (PDX) model. These findings highlight the crosstalk between the MAPK and p53 signaling pathways through RFNG, which mediates oxaliplatin resistance in CRC. Additionally, this study provides guidance for oxaliplatin treatment of CRC patients.

Keywords: MAPK signaling; apoptosis and ferroptosis; nuclear RFNG; oxaliplatin chemosensitivity; p53 activity.


Conflict of interest statement

The authors declare no conflict of interest.

Figures

Figure 1
Figure 1
RFNG promotes oxaliplatin chemoresistance and serves as a prognostic biomarker in CRC. A) Cell viability of HCT116 cells transfected with siCtril, siRFNG, siLFNG, or siMFNG and treated with or without 20 µm oxaliplatin (OXA) for the indicated times. B) HCT116 cells transfected with siCtril, siRFNG, siLFNG or siMFNG were treated with or without 20 µm OXA for 24 h and collected for cell death measurement. C‐E) HCT116 and LS174T cells stably expressing shNT, shRFNG‐1, or shRFNG‐2 were treated with or without 20 µm OXA for the indicated times, and cell viability was assessed (C). Cell death was measured after treatment for 24 h (D), and the IC50 of HCT116 cells was assessed after treatment for 48 h (E). F) HCT116 and LS174T cells stably expressing empty vector (EV) or RFNG were treated with or without 20 µM OXA for the indicated times, and cell viability was assessed. G) Colony formation assays were conducted to assess the proliferation of HCT116 and LS174T cells stably expressing shNT, shRFNG‐1, or shRFNG‐2. H) Representative images (left) and growth curves (right) of shNT, shRFNG‐1, or shRFNG‐2 CRC organoids treated with or without 10 µm OXA for the indicated times. I) HCT116 and LS174T cells stably expressing shNT, shRFNG, or shRFNG rescued with rRFNG‐WT or rRFNG‐ED were treated with or without 20 µm OXA for the indicated times, and cell viability was assessed. J) The mRNA expression of RFNG in normal and tumor samples from the TCGA COAD and READ databases. K) QPCR analysis of RFNG mRNA expression in 32 CRC tumor tissues and paired normal tissues. L) Immunoblotting analysis of RFNG protein expression in paired CRC tissues. M,N) Representative images (M) and IHC scores (N) of IHC staining of RFNG in CRC tissues and paired normal tissues. O,P) Kaplan‒Meier analysis of overall survival according to RFNG expression in CRC patient samples from the SYSU‐FAH cohort (O) and the TCGA COAD database (P). Q) Kaplan‒Meier analysis of overall survival according to RFNG expression in stage I+II (left) or stage III+IV (right) CRC patient samples from the TCGA COAD database. **< 0.01, ***< 0.001 (two‐way ANOVA (A, C, F, H, I), one‐way ANOVA (B, D, G), two‐tailed t test (J, K, L, N), or log‐rank test (O, P, Q)).
Figure 2
Figure 2
RFNG regulates the expression of CDKN1A and SLC7A11 to inhibit oxaliplatin‐induced apoptosis and ferroptosis. A) RNA‐seq analyses were performed in HCT116 cells stably expressing shNT or shRFNG treated with 20 µm OXA for 12 h. KEGG enrichment analysis of differentially expressed genes is shown. B) GSEA showed that the p53 pathway was enriched among the upregulated pathways in shRFNG cells. C) Heatmap displaying the expression of RFNG knockdown‐regulated p53 pathway genes according to KEGG enrichment analysis. D) HCT116 cells stably expressing shNT, shRFNG, or shRFNG were rescued with rRFNG‐WT or rRFNG‐ED, and qPCR analysis of the mRNA expression of CDKN1A and SERPINB5 was performed after treatment with 20 µm OXA for 12 h. E) Heatmap displaying the expression of indicated genes according to RNA‐seq. F–N) HCT116 and LS174T cells stably expressing shNT, shRFNG, or shRFNG rescued with rRFNG‐WT or rRFNG‐ED were treated with or without 20 µm OXA. F) QPCR analysis of the mRNA expression of SLC7A11 after treatment for 12 h. G) ChIP PCR analysis of p53 binding at the CDKN1A promoters after treatment for 12 h. H) Immunoblotting analysis of the expression of the indicated proteins after treatment for 12 h. I) Flow cytometry analysis of apoptotic cells after treatment for 24 h. J) ROS levels were assessed after treatment for 12 h. K,L) Representative images (K) and relative lipid peroxidation levels (L) were assessed by immunofluorescence using BODIPY C11 staining after treatment for 12 h. M,N) The concentrations of MDA (M) and 4‐NHE (N) were assessed after treatment for 12 h. O) HCT116 cells stably expressing shNT or shRFNG treated with 20 µm OXA plus ferrostatin‐1 (Ferr‐1) or Z‐VAD for 24 h and collected for cell death measurement. *< 0.05, **< 0.01, ***< 0.001 (one‐way ANOVA (D, F, I, J, L, M, N, O)).
Figure 3
Figure 3
The function of RFNG in promoting chemoresistance depends on WT p53. A–C) DLD1 and SW480 cells stably expressing shNT, shRFNG‐1 or shRFNG‐2 were treated with or without 50 µm OXA. A) Cell viability was assessed after treatment for the indicated times. B) Flow cytometry analysis of apoptotic cells after treatment for 24 h. C) Relative lipid peroxidation levels were assessed after treatment for 12 h. D–F) HCT116 WT (TP53 +/+) or p53 knockout (TP53 −/−) cells expressing shNT or shRFNG were treated with or without 20 µm OXA, and cell viability (D), cell apoptosis (E) and relative lipid peroxidation (F) were assessed. G) Colony formation assays were conducted to assess the proliferation of TP53 +/+ and TP53 −/− HCT116 cells stably expressing shNT or shRFNG. H–J) HCT116 TP53 +/+ cells stably expressing shNT or shRFNG were subcutaneously injected into nude mice, followed by intraperitoneal (i.p.) injection of OXA (7.5 mg kg−1) or vehicle (n = 5). Statistical analyses of tumor volumes (H), tumor images (I), and tumor weights (J) are shown. K,L) HCT116 TP53 −/− cells stably expressing shNT or shRFNG were subcutaneously injected into nude mice, followed by i.p. injection of OXA (7.5 mg kg−1) or vehicle (n = 5). Statistical analysis of the tumor volumes (K) and tumor weights (L) are shown. M) Hematoxylin‐eosin (H&E) and TUNEL staining (left) and quantification of the apoptotic index (TUNEL staining) (right) in xenograft tumors from (H). N) GSH, MDA, and 4‐HNE levels were assessed in xenograft tumors from (H). O) Kaplan‒Meier analysis of overall survival according to RFNG expression in p53 WT or p53 mutant CRC patient samples from the TCGA COAD database. P) Kaplan‒Meier analysis of overall survival according to RFNG expression in stage I+II (left) or stage III+IV (right) p53 WT CRC patient samples from the TCGA COAD database. *< 0.05, **< 0.01, ***< 0.001, n.s. = non‐significant (two‐way ANOVA (A, D, H, K), one‐way ANOVA (B, C, E, F, G, J, L, M, N), or log‐rank test (O, P)).
Figure 4
Figure 4
RFNG undergoes phosphorylation at the S255 residue and nuclear translocation upon oxaliplatin treatment. A) HCT116 and LS174T cells were treated with 5 or 10 µm OXA for 1 h, and cytosolic and nuclear fractions were collected for immunoblotting analysis. B) HCT116 cells were treated with or without 10 µm OXA for 1 h, and then immunofluorescence (IF) staining was performed. RFNG localization was indicated by an anti‐RFNG antibody, and nuclei were labeled with DAPI (left). Signal intensities and distances were quantified (right). Scale bar, 10 µm. C) HCT116 cells were treated with or without 10 µm OXA for 1 h, after which coimmunoprecipitation (co‐IP) was performed. D) HCT116 and LS174T cells stably expressing shNT and shKPNA1/shKPNB1 were treated with or without 10 µm OXA for 1 h, and cellular fractions were collected as indicated. Immunoblotting analysis was performed with indicated antibodies. E) Construction of RFNG tagged with a double nuclear export sequence (NES) at its C‐terminus (RFNG‐NES) (upper). Immunoblotting analysis of RFNG expression in HCT116 and LS174T cells stably expressing shNT, shRFNG, or shRFNG rescued with rRFNG‐WT or rRFNG‐NES (lower). F) RFNG‐knockdown HCT116 and LS174T cells stably expressing rRFNG‐WT or rRFNG‐NES were treated with or without 10 µm OXA for 1 h, and the cellular fractions were collected as indicated. Immunoblotting analysis was performed with indicated antibodies. G–I) RFNG‐knockdown HCT116 and LS174T cells stably expressing rRFNG‐WT or rRFNG‐NES were treated with or without 20 µm OXA, and cell viability (G), apoptosis (H) and relative lipid peroxidation (I) were assessed. J) HCT116 and LS174T cells stably expressing Flag‐RFNG were treated with 10 µm OXA for the indicated times, and immunoblotting analysis was performed. p‐S/T, serine/threonine phosphorylation; p‐Y, tyrosine phosphorylation; pan‐Ack, panlysine acetylation. K) RFNG‐knockdown HCT116 and LS174T cells stably expressing rRFNG‐WT, rRFNG‐T191A or rRFNG‐S255A were treated with or without 10 µm OXA for 1 h, and co‐IP was performed. L) RFNG‐knockdown HCT116 and LS174T cells stably expressing rRFNG‐WT, rRFNG‐T191A or rRFNG‐S255A were treated with 10 µm OXA for 1 h, and co‐IP was performed. M) RFNG‐knockdown HCT116 and LS174T cells stably expressing rRFNG‐WT or rRFNG‐S255A were treated with or without 10 µm OXA for 1 h, and the cellular fractions were collected as indicated. Immunoblotting analysis was performed with indicated antibodies. N,O) RFNG‐knockdown HCT116 and LS174T cells stably expressing rRFNG‐WT or rRFNG‐S255A were treated with or without 20 µm OXA, and cell viability (N) and relative lipid peroxidation (O) were assessed. *< 0.05, ***< 0.001 (two‐way ANOVA (G, N) or one‐way ANOVA (H, I, O)).
Figure 5
Figure 5
ERK phosphorylates RFNG to promote its translocation. A) HCT116 and LS174T cells were treated with 10 µm OXA for the indicated times, and immunoblotting analysis was performed. B) HCT116 and LS174T cells were treated with 5 µm or 10 µm OXA for 1 h, after which immunoblotting analysis was performed. C) RFNG‐knockdown HCT116 and LS174T cells stably expressing rRFNG‐WT or rRFNG‐S255A were treated with 5 µm or 10 µm OXA for 1 h, after which immunoblotting analysis was performed. D) HCT116 cells stably expressing Flag‐RFNG were treated with or without the indicated inhibitors for 12 h, followed by treatment with 10 µm OXA for 1 h. Immunoblotting analysis was subsequently performed. E,F) HCT116 or LS174T cells were treated with or without ERK1/2 inhibitors (ERK1/2i) for 12 h, followed by 10 µm OXA for 1 h. Co‐IP (E) and immunoblotting (F) were performed. G) HCT116 and LS174T cells stably expressing Flag‐RFNG were transfected with HA‐vector, ERK1, or ERK2 for 24 h, followed by 10 µm OXA treatment for 1 h. Co‐IP was subsequently performed. H) HCT116 and LS174T cells were treated with 10 µm OXA for 1 h, and co‐IP was performed. I–K) HCT116 and LS174T cells stably expressing shNT and shERK were treated with or without 10 µm OXA for 1 h. Immunoblotting (I), IF (J) and cellular fraction analysis (K) were performed. Scale bar, 10 µm. L–P) RFNG‐depleted HCT116 and LS174T cells stably expressing shNT or shERK were infected with rRFNG‐WT or rRFNG‐S255A and treated with 20 µm OXA. Cell viability (L), apoptosis (M, N), relative ROS levels (O) and relative lipid peroxidation (P) were assessed. *< 0.05, **< 0.01, ***< 0.001, n.s. = non‐significant (two‐way ANOVA (L), or one‐way ANOVA (M, N, O, P)).
Figure 6
Figure 6
RFNG pS255 binds to p53 and inhibits its phosphorylation. A) HCT116 and LS174T cells stably expressing Flag‐vector and RFNG were transfected with Myc‐p53 and then treated with or without 10 µm OXA for 1 h. Co‐IP was subsequently performed. B) HCT116 and LS174T cells were treated with or without 10 µm OXA for 1 h, and co‐IP was performed. C) Schematic diagram of p53 and its truncation mutants. D) HCT116 cells stably expressing Flag‐RFNG were transfected with Myc‐p53 or its truncations, and co‐IP was performed. E) HCT116 or LS174T cells stably expressing Flag‐rRFNG‐WT or rRFNG‐S255A were treated with or without 10 µm OXA for 1 h, co‐IP was performed. F) RFNG‐knockdown HCT116 or LS174T cells stably expressing rRFNG‐WT or rRFNG‐S255A were treated with 10 µm OXA for 1 h, IF analysis was performed. Scale bar, 10 µm. G,H) RFNG‐knockdown HCT116 or LS174T cells stably expressing rRFNG‐WT or rRFNG‐S255A were treated with or without 10 µm OXA for 1 h, immunoblotting analyses (G) and Co‐IP (H) were performed. I–L) RFNG‐depleted HCT116 TP53 +/+ or TP53 −/− cells were infected with rRFNG‐WT or rRFNG‐S255A and then treated with 20 µm OXA. Cell viability (I), apoptosis (J), relative ROS levels (K) and relative lipid peroxidation (L) were assessed. ***< 0.001, n.s. = non‐significant (two‐way ANOVA (I) or one‐way ANOVA (J, K, L)).
Figure 7
Figure 7
RFNG pS255 levels are negatively correlated with the efficacy of chemotherapy and the prognosis of CRC patients. A–G) RFNG‐knockdown HCT116 cells stably expressing rRFNG‐WT or S255A were subcutaneously injected into nude mice, followed by i.p. injection of OXA (7.5 mg kg−1) or vehicle (n = 5). A–C) Statistical analysis of tumor volumes (A), tumor images (B) and tumor weights (C) are shown. D, E) H&E and TUNEL staining (D) and quantification of the apoptotic index (TUNEL staining) (E) in xenograft tumors. F) The GSH and 4‐HNE levels were assessed in xenograft tumors. G) QPCR analysis of the mRNA expression of CDKN1A and SLC7A11 in the indicated xenograft tumors. H) IHC staining of human CRC clinical samples using antibodies against RFNG pS255, p53 pS15, CDKN1A, and SLC7A11. Representative images are shown. I–K) Correlation analysis of IHC staining levels between RFNG pS255 and p53 pS15 (I), RFNG pS255 and CDKN1A (J), and RFNG pS255 and SLC7A11 (K) in human CRC samples. L–N) Kaplan‒Meier analysis of overall survival according to RFNG pS255 (L), p53 pS15 (M), and SLC7A11 protein (N) levels in human CRC samples. O) Oxaliplatin (7.5 mg kg−1) treatment was tested in patient‐derived xenograft (PDX) models. Human CRC samples were collected for PDX preparation based on the histological expression of high or low levels of RFNG pS255. The results of the statistical analysis of the tumor volumes are shown. P) A proposed model of the mechanism by which RFNG is phosphorylated and translocated into the nucleus to restrain oxaliplatin‐induced apoptosis and ferroptosis in CRC cells. *< 0.05, **< 0.01, ***< 0.001 (two‐way ANOVA (A, O), one‐way ANOVA (C, E, F, G), or log‐rank test (L, M, N)).

References

    1. Woloshin S., Kramer B. S., N. Engl. J. Med. 2022, 387, 91. - PubMed
    1. Petrelli F., Labianca R., Zaniboni A., Lonardi S., Galli F., Rulli E., Rosati G., Corallo S., Ronzoni M., Cardellino G. G., Mattioli R., Mambrini A., Ciuffreda L., Banzi M., Pusceddu V., Maiello E., Zampino M., Zagonel V., Marchetti P., Corsi D., Rimassa L., Cinieri S., Sobrero A., JAMA Oncol. 2020, 6, 547. - PMC - PubMed
    1. de Gramont A., Figer A., Seymour M., Homerin M., Hmissi A., Cassidy J., Boni C., Cortes‐Funes H., Cervantes A., Freyer G., Papamichael D., Bail N. L., Louvet C., Hendler D., de Braud F., Wilson C., Morvan F., Bonetti A., J. Clin. Oncol. 2000, 18, 2938. - PubMed
    1. Crea F., Nobili S., Paolicchi E., Perrone G., Napoli C., Landini I., Danesi R., Mini E., Drug Resist. Updat. 2011, 14, 280. - PubMed
    1. Levine A. J., Nat. Rev. Cancer 2020, 20, 471. - PubMed

MeSH terms

LinkOut - more resources