. 2024 Nov 12;218(3):329-340.
doi: 10.1093/cei/uxae070.

Immune cell activity during anti-TNF treatment in patients with psoriasis and psoriatic arthritis

Affiliations

Immune cell activity during anti-TNF treatment in patients with psoriasis and psoriatic arthritis

Aleksandra Petrovic et al. Clin Exp Immunol. .

Abstract

Psoriasis is a chronic, inflammatory skin disease characterized by a dysregulated immune response and systemic inflammation. Up to one-third of patients with psoriasis have psoriatic arthritis (PsA). Targeted treatment with antibodies neutralizing tumor necrosis factor can ameliorate both diseases. We here explored the impact of long-term infliximab treatment on the composition and activity status of circulating immune cells involved in chronic skin and joint inflammation. Immune cells were analyzed by multicolor flow cytometry. We measured markers of immune activation in peripheral blood mononuclear cell populations in 24 infliximab-treated patients with psoriasis/PsA compared to 32 healthy controls. We observed a significant decrease in the frequency of both peripheral natural killer (NK) cells and their subset CD56dimCD16+ NK cells in PsA compared to healthy controls and patients with psoriasis. The latter had a strong-positive correlation with psoriasis area severity index (PASI) in these patients, while CD56brightCD16- NK cells were negatively correlated with PASI. In addition, we observed an upregulation of CD69+ intermediate CD14+CD16+ and CD69+ classical CD14+CD16- monocytes in PsA and increased activity of CD38+ intermediate CD14+CD16+ monocytes in patients with psoriasis. Compared to healthy controls, psoriasis patients demonstrated shifts of the three B-cell subsets with a decrease in transitional CD27-CD38high B cells. Our exploratory study indicates a preserved pathophysiological process including continuous systemic inflammation despite clinical stability of the patients treated with infliximab.

Keywords: B cells; flow cytometry; infliximab; psoriasis; psoriatic arthritis; systemic inflammation.


Conflict of interest statement

The authors declare no conflict of interest.

Figures

Graphical Abstract
Graphical Abstract
Figure 1:
Figure 1:
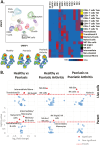
patient groups and healthy controls display differences in frequencies of PBMC subsets. (A) Cell subsets. Cells were gated by scatter properties (SSCA vs FSCA), then single cells (FSCH vs FSCA; SSCH vs SSCA), followed by live cells (SSCA, PO). Each sample was then sampled down to 200 000 live cell events. All samples were concatenated together. Samples belonging to healthy controls (HC), psoriasis (PsO), and psoriatic arthritis (PsA) patients were than identified, and 200 000 events from each group were clustered using a UMAP algorithm using all parameters except PO and scatter properties to visualize the live cells on a 2D plain. Parental populations (CD4+ T cells, CD8+ T cells, monocytes, B cells, and NK cells) are indicated. Each cell subset identified by manual gating (see Supplementar Fig. S1) is indicated by color. Pseudo-color density plots indicate distribution of cells with areas of highest density indicated in red and lowest in blue. Heatmap of log transformed median marker intensity normalized to a range of 0 to 1 of the 13 markers for each of the 18 identified populations indicated on the righthand side of the figure. (B) Results of comparisons of cell frequencies normalized to total live cells, between the 3 groups are summarized in volcano plots and given in the top row, and results of comparisons of cell frequencies normalized to their respective parent (B, monocytes, CD4+ T cells, CD8+ T cells, and NK cells), between the 3 groups are given in the bottom row. Significant values (P ≤ 0.05) are indicated as red circles, and cell designations are given for significant values and those approaching significant. (C) Comparisons between the groups displayed in violin plots show frequency in NK- and B-cell populations and subsets
Figure 1:
Figure 1:
patient groups and healthy controls display differences in frequencies of PBMC subsets. (A) Cell subsets. Cells were gated by scatter properties (SSCA vs FSCA), then single cells (FSCH vs FSCA; SSCH vs SSCA), followed by live cells (SSCA, PO). Each sample was then sampled down to 200 000 live cell events. All samples were concatenated together. Samples belonging to healthy controls (HC), psoriasis (PsO), and psoriatic arthritis (PsA) patients were than identified, and 200 000 events from each group were clustered using a UMAP algorithm using all parameters except PO and scatter properties to visualize the live cells on a 2D plain. Parental populations (CD4+ T cells, CD8+ T cells, monocytes, B cells, and NK cells) are indicated. Each cell subset identified by manual gating (see Supplementar Fig. S1) is indicated by color. Pseudo-color density plots indicate distribution of cells with areas of highest density indicated in red and lowest in blue. Heatmap of log transformed median marker intensity normalized to a range of 0 to 1 of the 13 markers for each of the 18 identified populations indicated on the righthand side of the figure. (B) Results of comparisons of cell frequencies normalized to total live cells, between the 3 groups are summarized in volcano plots and given in the top row, and results of comparisons of cell frequencies normalized to their respective parent (B, monocytes, CD4+ T cells, CD8+ T cells, and NK cells), between the 3 groups are given in the bottom row. Significant values (P ≤ 0.05) are indicated as red circles, and cell designations are given for significant values and those approaching significant. (C) Comparisons between the groups displayed in violin plots show frequency in NK- and B-cell populations and subsets
Figure 2:
Figure 2:
expression of activation markers CD38, CD69, CD107a, and HLA-DR on immune cells. Degree of expression was examined using the 95 percentiles of the MFI. T and NK subsets, and NKT cells were examined for CD38, CD69, CD107a, and HLA-DR. Monocytes were examined for CD38, CD69 and HLA-DR. B-cell subsets were examined for CD38 and HLA-DR. (A) MFI measurements of CD38, CD69, CD107a, and HLA-DR are shown using a UMAP clustering for each sample subtype. (B) Results of comparison between each sample group of 95 percentiles of CD38, CD69, CD107a, and HLA-DR expression in different cell subsets. Cell designations are given for significant values (P ≤ 0.05), tags are colored based on marker. (C) Expression of activation markers CD69, CD107a, and CD38 between the 3 groups displayed in violin plots
Figure 2:
Figure 2:
expression of activation markers CD38, CD69, CD107a, and HLA-DR on immune cells. Degree of expression was examined using the 95 percentiles of the MFI. T and NK subsets, and NKT cells were examined for CD38, CD69, CD107a, and HLA-DR. Monocytes were examined for CD38, CD69 and HLA-DR. B-cell subsets were examined for CD38 and HLA-DR. (A) MFI measurements of CD38, CD69, CD107a, and HLA-DR are shown using a UMAP clustering for each sample subtype. (B) Results of comparison between each sample group of 95 percentiles of CD38, CD69, CD107a, and HLA-DR expression in different cell subsets. Cell designations are given for significant values (P ≤ 0.05), tags are colored based on marker. (C) Expression of activation markers CD69, CD107a, and CD38 between the 3 groups displayed in violin plots
Figure 3:
Figure 3:
correlation of cell subsets with PASI in patients with PsA. (A) Very strong negative correlation of CD56brightCD16- NK cells with PASI. (B) Strong positive correlation of CD56dimCD16+ NK cells with PASI. (C) Very strong positive correlation of CD8+ TCM cells with PASI

References

    1. Boehncke WH, Schön MP.. Psoriasis. Lancet 2015, 386, 983–94. doi:10.1016/S0140-6736(14)61909-7 - DOI - PubMed
    1. Griffiths CE, Barker JN.. Pathogenesis and clinical features of psoriasis. Lancet 2007, 370, 263–71. doi:10.1016/S0140-6736(07)61128-3 - DOI - PubMed
    1. Griffiths CEM, Armstrong AW, Gudjonsson JE, Barker J.. Psoriasis. Lancet 2021, 397, 1301–15. - PubMed
    1. Henseler T, Christophers E.. Psoriasis of early and late onset: characterization of two types of psoriasis vulgaris. J Am Acad Dermatol 1985, 13, 450–6. doi:10.1016/s0190-9622(85)70188-0 - DOI - PubMed
    1. Luan L, Han S, Wang H, Liu X.. Down-regulation of the Th1, Th17, and Th22 pathways due to anti-TNF-α treatment in psoriasis. Int Immunopharmacol 2015, 29, 278–84. doi:10.1016/j.intimp.2015.11.005 - DOI - PubMed