. 2024 Aug 9;9(98):eadk9872.
doi: 10.1126/sciimmunol.adk9872. Epub 2024 Aug 9.

The human CD47 checkpoint is targeted by an immunosuppressive Aedes aegypti salivary factor to enhance arboviral skin infectivity

Affiliations

The human CD47 checkpoint is targeted by an immunosuppressive Aedes aegypti salivary factor to enhance arboviral skin infectivity

Alejandro Marin-Lopez et al. Sci Immunol. .

Abstract

The Aedes aegypti mosquito is a vector of many infectious agents, including flaviviruses such as Zika virus. Components of mosquito saliva have pleomorphic effects on the vertebrate host to enhance blood feeding, and these changes also create a favorable niche for pathogen replication and dissemination. Here, we demonstrate that human CD47, which is known to be involved in various immune processes, interacts with a 34-kilodalton mosquito salivary protein named Nest1. Nest1 is up-regulated in blood-fed female A. aegypti and facilitates Zika virus dissemination in human skin explants. Nest1 has a stronger affinity for CD47 than its natural ligand, signal regulatory protein α, competing for binding at the same interface. The interaction between Nest1 with CD47 suppresses phagocytosis by human macrophages and inhibits proinflammatory responses by white blood cells, thereby suppressing antiviral responses in the skin. This interaction elucidates how an arthropod protein alters the human response to promote arbovirus infectivity.


Conflict of interest statement

Competing interests: The authors declare that they have no competing interests.

Figures

Fig. 1.
Fig. 1.. Characterization of Nest1 expression in the mosquito.
(A) Nest1 relative expression in salivary glands (SG), midgut (M), and ovaries (OV) of female Aedes aegypti by qRT-PCR and protein immunoblot. (B) Nest1 relative expression in salivary glands after sugar or blood meal at 0 (immediately after), 6, and 24 hours after feeding by qRT-PCR. (C) Nest1 relative expression in salivary glands in male and female mosquitoes after a sugar meal. (D) Nest1 relative expression after ZIKV intrathoracic infection. Relative expression of Nest1 8 and 10 dots per inch (dpi) in ZIKV-infected and noninfected mosquitoes. Ten to 15 mosquitoes per group were used in every experiment. qRT-PCR relative expression was analyzed using Rp49 as a housekeeping gene. These values represent the means ± SEM from a single experiment and are representative of two independent experiments. The P value is displayed in the graph and was determined using Student’s t test. Asterisks represent significant difference between samples (***P < 0.001).
Fig. 2.
Fig. 2.. Nest1-ZIKV replication kinetics in the human skin.
(A) One thousand FFUs of ZIKV Mex I44 and 3 μg of Nest1 protein were combined, incubated for 1 hour, and intradermally inoculated into the human skin (n = 4) for each group. Groups included (i) buffer, (ii) Nest1, (iii) ZIKV + buffer, and (iv) ZIKV + Nest1. Buffer (150 mM NaCl and 10 mM Hepes) in which Nest1 protein was collected was used as a negative control. (B and C) Graphs represent ZIKV FFU in skin samples (B) and culture media samples (C) in 24-hour intervals until 4 days after infection. Quantification of viral loads was calculated by real-time qRT-PCR using a standard curve in which FFUs were normalized to μg RNA by isolating RNA from a known high-titer ZIKV stock. The standard curve was generated by plotting log10 FFUs (from the known titer virus) as a function of Ct value obtained. Sample Ct values were applied to the standard curve to calculate the log10 FFUs, which were normalized to μg of RNA to account for variations in total RNA mass from different skin samples. These values represent the means ± SEM from a single experiment. The P value is displayed in the graph and was determined using Student’s t test. Asterisks represent significant difference between samples (*P < 0.05 and **P < 0.01). ns, not significant.
Fig. 3.
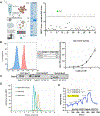
Fig. 3.. Characterization of the Nest1-CD47 interaction.
(A) REAP diagram for the identification of protein-protein interactions. Schematic of the yeast-display screen. A library of yeast cells, each displaying a single human protein encoded by a uniquely barcoded plasmid, was pooled and mixed with surface biotinylated Nest1 expressed in Expi293F cells. The REAP library was scaled to a 96-well magnetic separation format for this screen. Magnetic separation using streptavidin microbeads followed by NGS was used to identify yeast displaying proteins that bound to the Nest1 protein. Plasmid DNA was isolated and sequenced to identify the proteins. The Nest1 REAP screening identified human CD47 as a potential binding candidate. The score for each gene is defined as the overall enrichment for that gene (relative to the unselected library) multiplied by the percentage of barcodes associated with the gene that was enriched (defined as logFC > 0). (B) Mean fluorescence intensity (MFI) for the CD47-Nest1 interaction (red peak) and inhibition of Nest1-CD47 binding by the SIRPA variant CV-1 (blue peak) (left) and MFI values under increasing concentrations of rNest1 protein (right). (C) Representative immunoblot showing coimmunoprecipitation assay of Fc-tagged human CD47 with Nest1. Nest1 presence was analyzed in input, flow-through (FT), first wash (W1), last wash (W3), and immune-precipitated protein (IP) using rabbit anti-Nest1 serum and anti-rabbit HRP antibody. AeSNAP mosquito protein as prey was used as a negative control as well as the absence of CD47 bait incubated with Nest1. (D) SEC analysis for the Nest1-CD47 interaction. The Nest1-CD47 complex (blue peak) was formed by incubating 1.2× molar excess of CD47 with Nest1 and incubated at RT for 45 min before injecting onto an ENrich SEC 70 column (Bio-Rad). Equivalent molar amounts of CD47 and Nest1 were injected separately to compare with the elution volume of the complex. (E) SPR analysis of the Nest1-CD47 interaction. Single-cycle kinetics and affinity measurements were performed on a BIAcore T200 instrument using a Biotin CAPture kit (Cytiva). RU, response units.
Fig. 4.
Fig. 4.. Biophysical characterization of the Nest1-CD47 interaction.
(A) The Nest1-CD47 interaction is abrogated in the presence of CV-1 by SPR. Nest1 (100 nM) was flowed over immobilized CD47-Fc (biotinylated) on a Biotin CAPture chip and allowed to dissociate completely (left). Two sequential injections of 50 nM CV-1 were then used (red trace followed by blue trace) to saturate CD47 (middle) without any measurable dissociation, followed by a 10 nM injection of Nest1 (right). (B) Amino acid sequence of Nest1 protein, secretion signal peptide (yellow), and predicted coiled-coil domains (green) are shown (Eukaryotic Linear Motif resource) (top). CD47-Fc binding to yeast expressing different Nest1 constructs was measured by flow cytometry (bottom). The C-terminal region (amino acids 126 to 316) of Nest1 protein is responsible for the Nest1-CD47 interaction. FLAG-PE measures the display of Nest1 on yeast. (C) Structural modeling illustrating interaction epitopes identified for Nest1 and CD47 by HDX-MS. Epitope segments with lower and higher hydrogen-deuterium exchange are highlighted in pink and yellow, respectively, relative to uncomplexed Nest1 and CD47. Images were generated using PyMOL. Nest1 was modeled using the crystal structure of LIPS-2 [Protein Data Bank (PDB) 7TDR]. The CD47:SIRPA coordinates are from PDB 2JJS.
Fig. 5.
Fig. 5.. Phagocytosis assay of RBCs by different human immune cells and relative expression of proinflammatory cytokines in white blood cells.
(A and B) Blood-derived human primary macrophages and macrophage-like THP-1 and U937 human cell lines were used in these experiments. Phagocytosis activity was measured 4 hours after stimulation (A). Phagocytosis assay with Nest1 and GlycA-preincubated RBCs (B). Blue bars, no treatment; yellow bars, Nest1 treatment; purple bars, GlycA); orange bars, Nest1+GlycA. These values represent the means ± SEM of three replicates from a single experiment. The P value is displayed in the graph and was determined using Student’s t test. Experiments with THP-1 and human primary macrophages are representative of two or three independent experiments. (C) Relative expression of proinflammatory cytokines (IFN-γ, IL-2, TNF, IL-12p40, IL-8, and IL-6) and anti-inflammatory cytokines (IL-13, IL-4, IL-5, and IL-1RA) from human white blood cells from four different donors. Expression was measured by qRT-PCR in nontreated and Nest1-treated human white blood cells 24 hours after stimulation. Cells were stimulated in triplicate, and the measurements of four different donors were pooled. Human GAPDH was used as a housekeeping gene. These values represent the means ± SEM of three replicates from a single experiment. Asterisks represent significant difference between samples, calculated by Student’s t test (*P < 0.05, **P < 0.01, and ***P < 0.001).
Fig. 6.
Fig. 6.. Transcriptomic analysis in human skin samples treated with buffer, Nest1, ZIKV (ZIKV buffer), and Nest1+ZIKV (ZIKV Nest1).
(A, B, F, and G) Principal components assays and volcano plots for the DEGs after Nest1 and ZIKV+Nest1 treatments compared with control buffer and ZIKV buffer, respectively. The gene names can be found in data file S1. PCA reveals the similarity between samples based on the distance matrix. Samples were projected to a 3D plane spanned by their first three principal components. The percentage of the total variance per direction is shown in the label. The global transcriptional change across the groups compared was visualized by volcano plots. Each data point in the scatter plot represents a gene. The log2 FC of each gene is represented on the x axis versus the −log10 of its adjusted P value on the y axis. Genes with an adjusted P value less than 0.05 and a log2 FC greater than 1 are indicated by red dots. These represent up-regulated genes. Genes with an adjusted P value of less than 0.05 and a log2 FC less than 1 are indicated by green dots (down-regulated genes). RNA-seq, RNA sequencing. (C and H) A biclustering heatmap was used to visualize the expression profile of the top 30 DEGs sorted by their adjusted P value by plotting their log2 transformed expression values in samples. (D and I) Significant DEGs were clustered by their gene ontology (functions, top; pathways, bottom). Red bars represent up-regulated functions. Green bars represent down-regulated functions and pathways, and the enrichment of gene ontology terms was tested using Fisher’s exact test (GeneSCF v1.1-p2). (E and J) Upstream regulation analysis. Color legend: light red, buffer; light blue, Nest1; dark red, ZIKV buffer; dark blue, ZIKV Nest1.

References

    1. Caraballo H, King K, Emergency department management of mosquito-borne illness: Malaria, dengue, and West Nile virus. Emerg. Med. Pract. 16, 1–23 (2014). - PubMed
    1. Barillas-Mury C, Ribeiro JMC, Valenzuela JG, Understanding pathogen survival and transmission by arthropod vectors to prevent human disease. Science 377, eabc2757 (2022). - PubMed
    1. Cheng G, Liu Y, Wang P, Xiao X, Mosquito defense strategies against viral infection. Trends Parasitol. 32, 177–186 (2016). - PMC - PubMed
    1. Vogt MB, Lahon A, Arya RP, Kneubehl AR, Spencer Clinton JL, Paust S, Rico-Hesse R, Mosquito saliva alone has profound effects on the human immune system. PLOS Negl. Trop. Dis. 12, e0006439 (2018). - PMC - PubMed
    1. Champagne DE, Smartt CT, Ribeiro JM, James AA, The salivary gland-specific apyrase of the mosquito Aedes aegypti is a member of the 5′-nucleotidase family. Proc. Natl. Acad. Sci. U.S.A. 92, 694–698 (1995). - PMC - PubMed

Publication types