. 2024 Aug 9;10(32):eadl4893.
doi: 10.1126/sciadv.adl4893. Epub 2024 Aug 9.

3D chromatin architecture, BRD4, and Mediator have distinct roles in regulating genome-wide transcriptional bursting and gene network

Affiliations

3D chromatin architecture, BRD4, and Mediator have distinct roles in regulating genome-wide transcriptional bursting and gene network

Pawel Trzaskoma et al. Sci Adv. .

Abstract

Discontinuous transcription is evolutionarily conserved and a fundamental feature of gene regulation; yet, the exact mechanisms underlying transcriptional bursting are unresolved. Analyses of bursting transcriptome-wide have focused on the role of cis-regulatory elements, but other factors that regulate this process remain elusive. We applied mathematical modeling to single-cell RNA sequencing data to infer bursting dynamics transcriptome-wide under multiple conditions to identify possible molecular mechanisms. We found that Mediator complex subunit 26 (MED26) primarily regulates frequency, MYC regulates burst size, while cohesin and Bromodomain-containing protein 4 (BRD4) can modulate both. Despite comparable effects on RNA levels among these perturbations, acute depletion of MED26 had the most profound impact on the entire gene regulatory network, acting downstream of chromatin spatial architecture and without affecting TATA box-binding protein (TBP) recruitment. These results indicate that later steps in the initiation of transcriptional bursts are primary nodes for integrating gene networks in single cells.


Figures

Fig. 1.
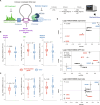
Fig. 1.. StochasticGene infers genome-wide rates of transcriptional kinetics.
(A) Bayesian inference of the parameters of a two-state telegraph model of transcriptional bursting for scRNA-seq (10x Genomics) or smRNA-FISH data with mRNA half-lives as an input to StochasticGene. The two-state stochastic telegraph model is fitted to scRNA-seq or smRNA-FISH histograms for each gene. The model scheme is depicted in a box outlined by dashed lines and comprises transitions between an inactive OFF state and an active ON state, during which mRNA is emitted. There are four parameters: the ON rate, kon (OFF to ON transition), OFF rate, koff (ON to OFF transition), eject rate, keject (mRNA creation rate), and decay rate, kdecay (reflecting the mRNA disappearance rate). From these rates, we calculate the OFF time as 1/ kon (in minutes) and the “burst size,” keject/koff, which corresponds to the mean number of mRNA produced while in the ON state. (B) Correlation of inferred rates (log10) with scRNA-seq and smRNA-FISH (merged two smRNA biological replicates) in serum-activated HCT-116 cells. Pearson R and Reduced Major Axis (RMA) R2 as shown. Blue lines represent regression fit, n = 14. Error bars represent MAD (median absolute deviation), colored by mean scRNA-seq expression. (C) Correlation of rates (log10) inferred from two scRNA-seq biological replicates in serum-activated HCT-116 cells is grouped by mean expression. Pearson R as shown, P < 2.2 ×10⁻¹⁶. The sample sizes for different mean expression groups are as follows: n (rep1 and rep2 < 1 mean expr.) = 1250; n (1 < rep1 and rep2 < 5 mean expr.) = 4294; n (rep1 and rep2 > 5 mean expr.) = 2017; and n (all) = 7779. (A) created with BioRender.com.
Fig. 2.
Fig. 2.. Regulatory genes burst more frequently than HK ones.
(A to D) Comparison of HK (in red) and TF genes (in blue) in terms of (A) expression, (B) mRNA decay, (C) OFF duration, and (D) burst size in a steady-state HCT-116 cells [median values shown for each category, Kolmogorov–Smirnov (KS) test, P values as shown]. Two biological replicates are shown. The same decay rates, inferred from merged three biological replicates, were used for both scRNA-seq replicates; n (rep1: HK and TF) = 506 and 129; n (rep2: HK and TF) = 403 and 105 genes; 95% CI for the two replicates are shown. (E) Representative examples of TF and HK genes: scRNA-seq mRNA histograms with two-state telegraph model fits to scRNA-seq data (dashed lines) and, based on median posterior rates, inferred OFF time duration and burst size +/− estimation uncertainty based on MAD.
Fig. 3.
Fig. 3.. The impact of MYC and enhancers on bursting validate the transcriptome-wide approach.
(A to C) Knockout (KO) of Myc affects burst size in splenic B cells: (A) Splenic B cells were isolated from wild-type (WT) and Myc KO mice and activated in vitro for 4 hours with lipopolysaccharide (LPS) and interleukin-4 (IL-4). Bursting kinetics was inferred by fitting a two-state telegraph model to scRNA-seq data. (B) Log2 fold change (LFC) of OFF time duration of down-regulated and other genes. (C) LFC of burst size of down-regulated and other genes (two-sided paired Wilcoxon test, P values as shown, n = 63 and 477, respectively). (D) LFC of (B/ESC) OFF time duration and normalized burst size of Pim1 gene with cell type–specific set of enhancers in mouse ESC (average from two biological replicates) and activated B cells. (E) OFF time duration versus Pim1-normalized expression in different cell types, n = 12. (F) Normalized burst size versus Pim1-normalized expression in different cell types, n = 12. Blue lines represent regression fit, and P values were obtained from the linear regression model. Error bars indicate the SEM for expression and uncertainty based on MAD for OFF time and burst size. All rates were inferred using the two-state model fitted to scRNA-seq data. (A) created with BioRender.com.
Fig. 4.
Fig. 4.. Cohesin and BRD4 regulate the burst size and OFF duration, while MED26 affects the frequency.
(A) On the left is a scheme illustrating key transcription regulators that were perturbed: BRD4 (JQ1 treatment), cohesin complex [RAD21 degron (54)], and Mediator subunit interacting with TFIID (35): MED26 [MED26 degron (55)]. On the right is a scheme outlining the experimental design: HCT-116 cells were starved for 14 hours and then treated with auxin (RAD21 and MED26 degron) or 500 nM JQ1 for 6 hours in the absence of fetal bovine serum (FBS). Two hours after the addition of serum in the presence of auxin or JQ1, cells were captured, and scRNA-seq was performed. A two-state telegraph model was fitted to the scRNA-seq data to infer parameters of bursting in control and treated cells using the same decay rates for both conditions. (B) LFC of OFF time duration of significantly down-regulated genes (in red) upon RAD21 loss (n = 70), JQ1 treatment (n = 397), MED26 loss (n = 729), and other genes (in blue). Two-sided paired Wilcoxon test, P values as shown. (C) LFC of burst size of significantly down-regulated and other genes. (D) Comparison of LFC (RAD21/DMSO) expression (top), OFF time (middle), and burst size (bottom) inferred using scRNA (scRNA-seq) and smFISH (smRNA-FISH: merged two biological replicates) data. Red, significantly down-regulated genes; black, unaffected genes; blue, significantly up-regulated genes. P values from regression: log(scRNA) ~ log(smFISH); Error bars indicate the SEM for expression and uncertainty based on MAD for OFF time and burst size (n = 7 genes). (A) created with BioRender.com.
Fig. 5.
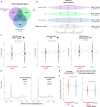
Fig. 5.. Cohesin, BRD4, and MED26 play distinct role in transcription and gene network regulation.
(A) Venn diagram of down-regulated genes in RAD21 degron, JQ1-treated, and MED26 degron HCT-116 cells. (B) Impact of tested perturbations on gene-gene correlations across single cells based on scRNA-seq (MAD, n represents number of gene pairs). (C) Impact of tested perturbations on TBP binding based on ChIP-seq [n of peaks: RAD21: 644 (down) and 18,837 (other); JQ1: 400 (down) and 8148 (other); MED26: 828 (down) and 13,104 (other), two-sided unpaired Wilcoxon test, P values as shown]. (D) PRO-seq composites of transcriptionally engaged RNA polymerases upon JQ1 treatment (left: n = 425) and MED26 perturbations (right: n = 475) at down-regulated genes; control (DMSO) in green and perturbation in magenta. (E) Formula for PRO-seq pausing index. (F) LFC pausing index upon JQ1 treatment (left violin plot) and MED26 perturbation (right violin plot); two-sided unpaired Wilcoxon test, with P values as shown. Down-regulated genes are represented in red (n = 1017 for JQ1 and 1027 for MED26 loss), while other genes are shown in blue (n = 11,235 for JQ1 and 11,407 for MED26 loss).

References

    1. Tunnacliffe E., Chubb J. R., What is a transcriptional burst? Trends Genet. 36, 288–297 (2020). - PubMed
    1. Rodriguez J., Larson D. R., Transcription in living cells: Molecular mechanisms of bursting. Annu. Rev. Biochem. 89, 189–212 (2020). - PubMed
    1. Bohrer C. H., Larson D. R., The stochastic genome and its role in gene expression. Cold Spring Harb. Perspect. Biol. 13, a040386 (2021). - PMC - PubMed
    1. Klindziuk A., Kolomeisky A. B., Understanding the molecular mechanisms of transcriptional bursting. Phys. Chem. Chem. Phys. 23, 21399–21406 (2021). - PubMed
    1. Wang Y., Ni T., Wang W., Liu F., Gene transcription in bursting: A unified mode for realizing accuracy and stochasticity. Biol. Rev. Camb. Philos. Soc. 94, 248–258 (2019). - PMC - PubMed

Publication types