. 2024 Aug 9;10(32):eadp6182.
doi: 10.1126/sciadv.adp6182. Epub 2024 Aug 9.

Integrated single-cell RNA-seq analysis reveals mitochondrial calcium signaling as a modulator of endothelial-to-mesenchymal transition

Affiliations

Integrated single-cell RNA-seq analysis reveals mitochondrial calcium signaling as a modulator of endothelial-to-mesenchymal transition

Mathilde Lebas et al. Sci Adv. .

Abstract

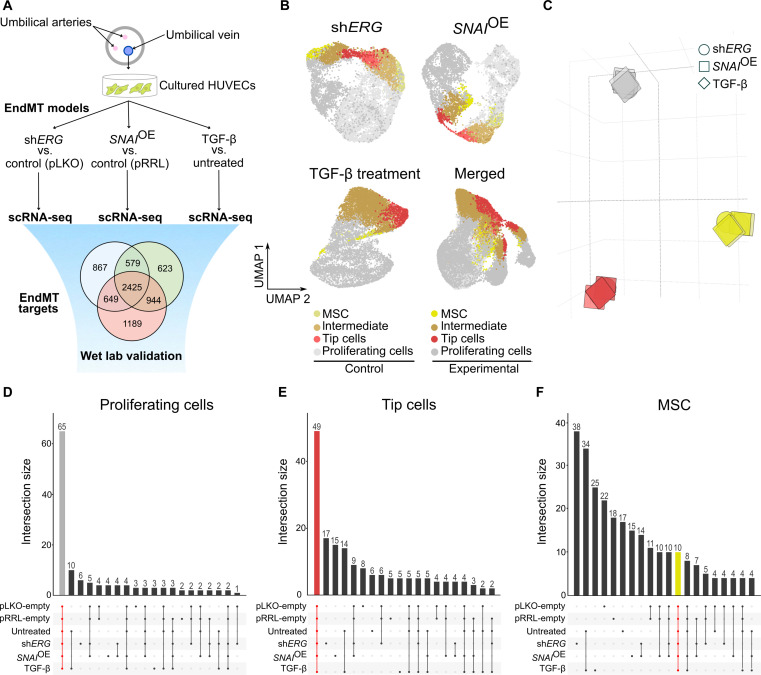
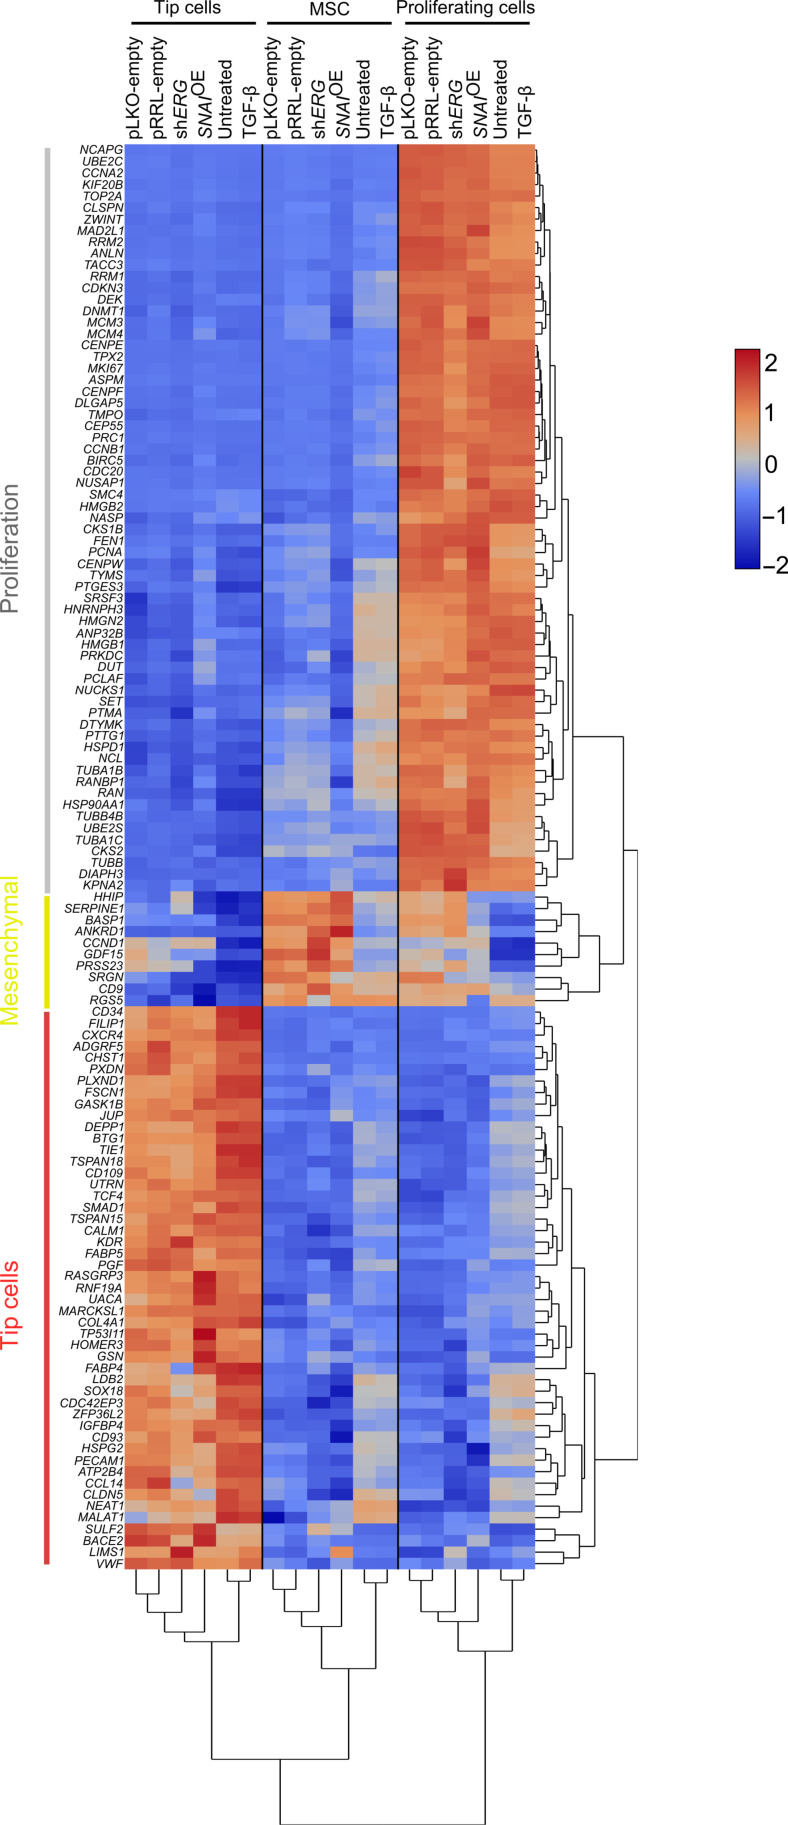
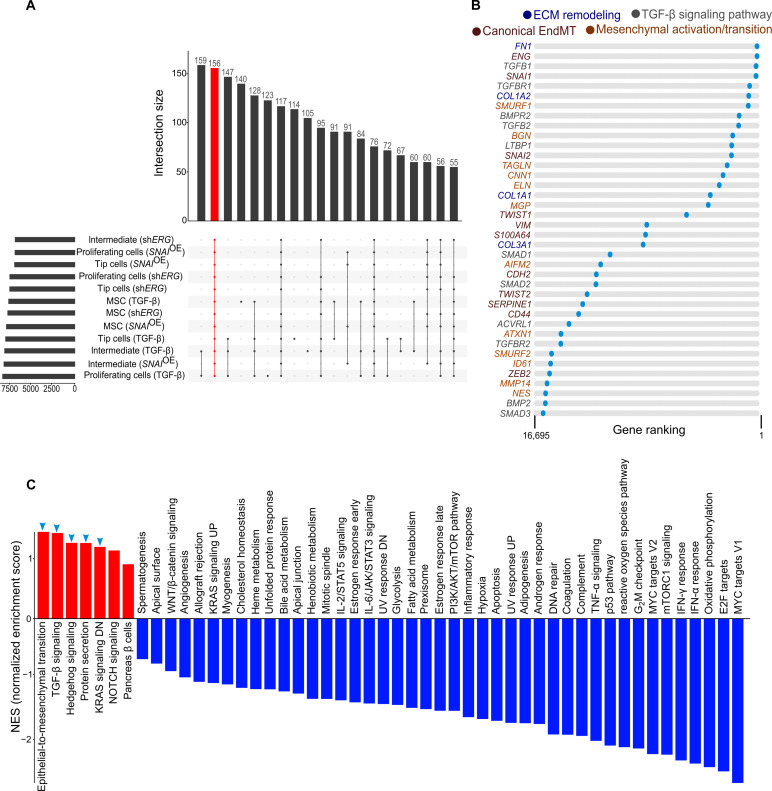
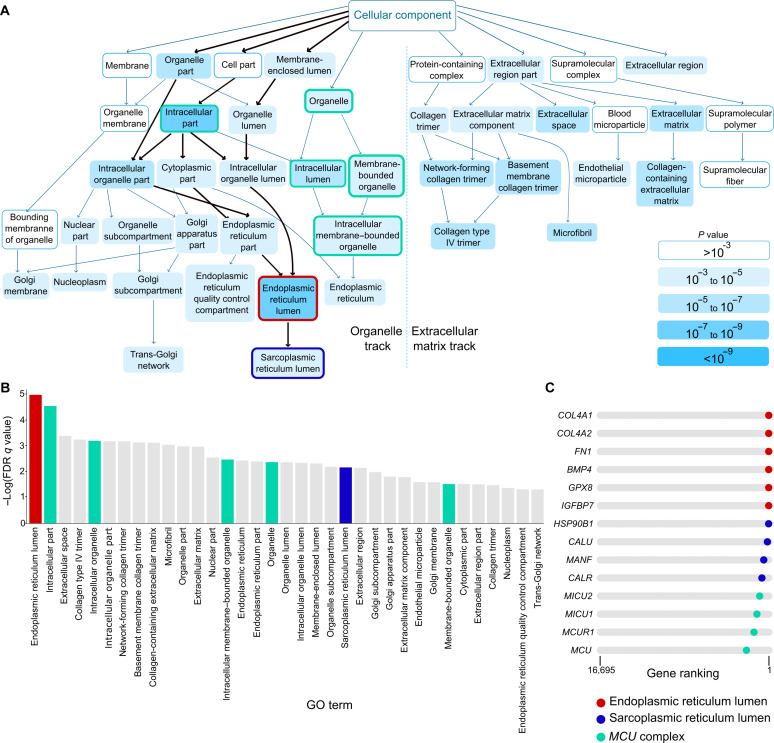
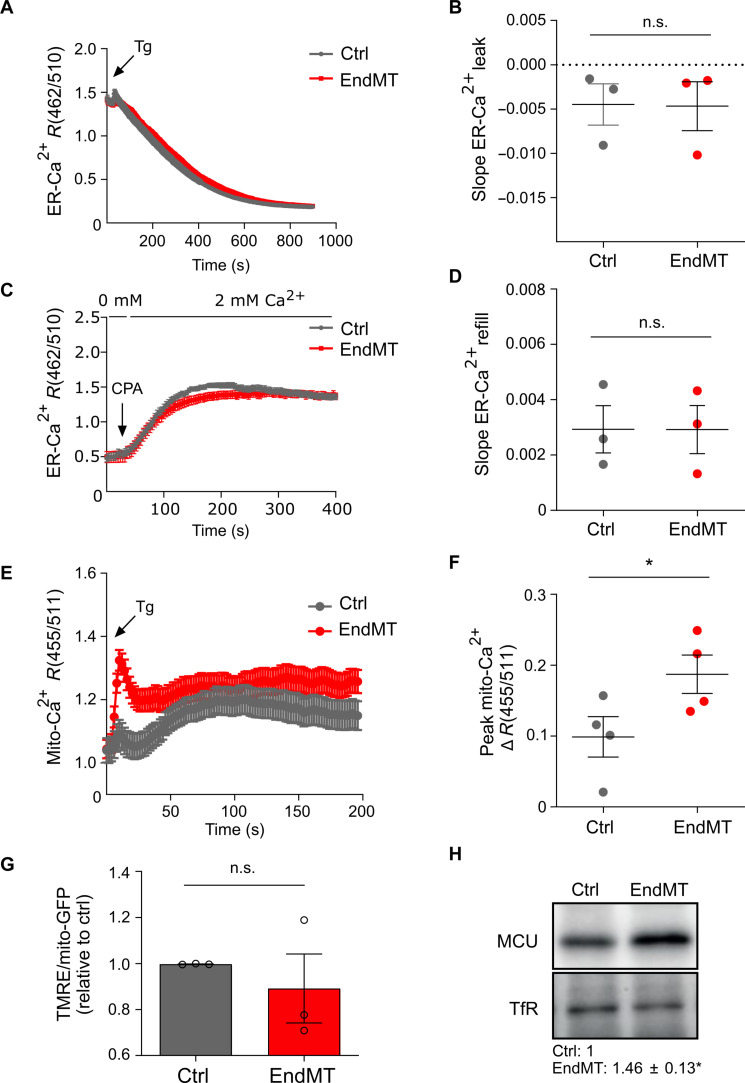
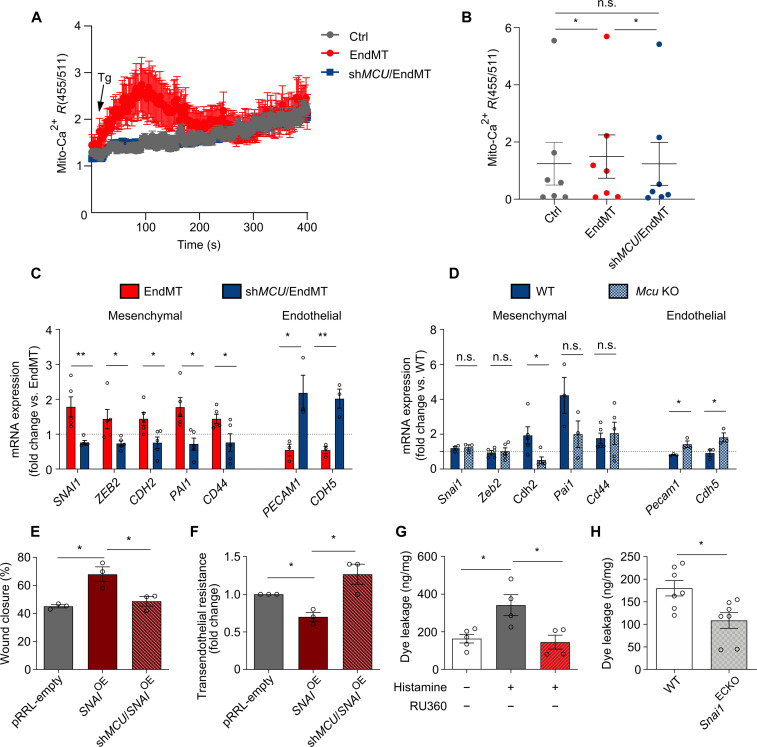
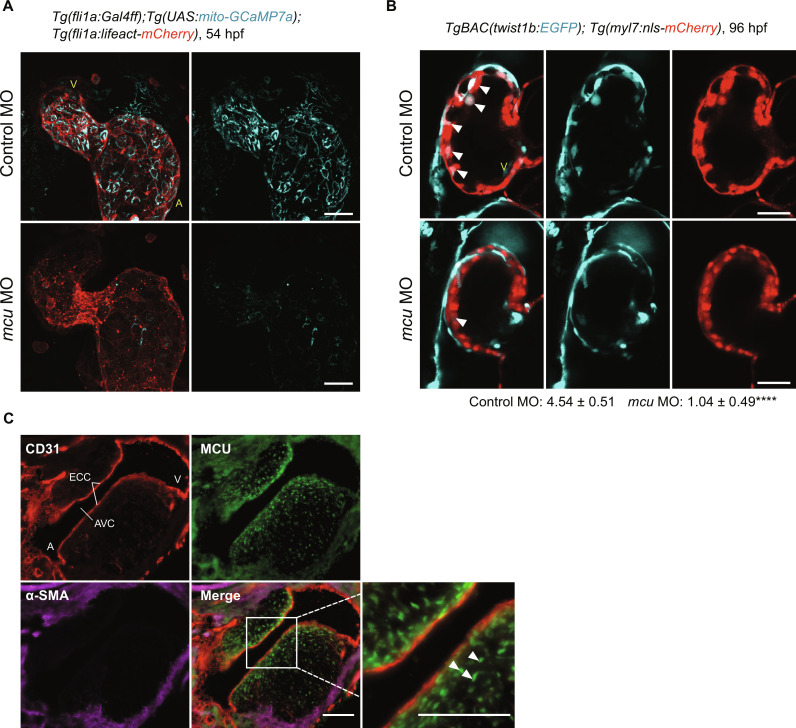
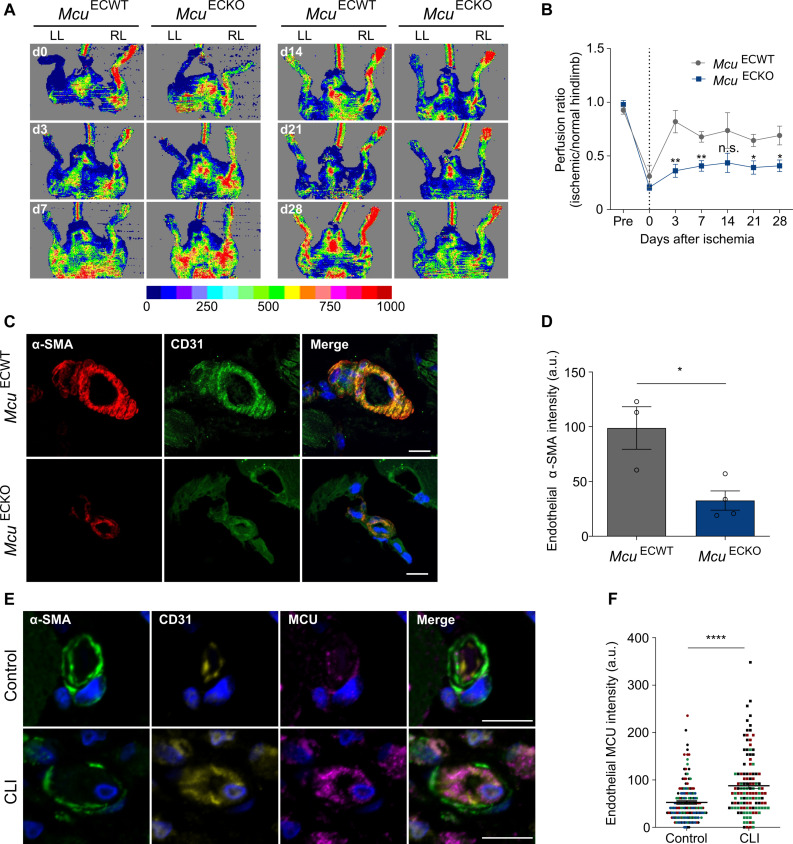
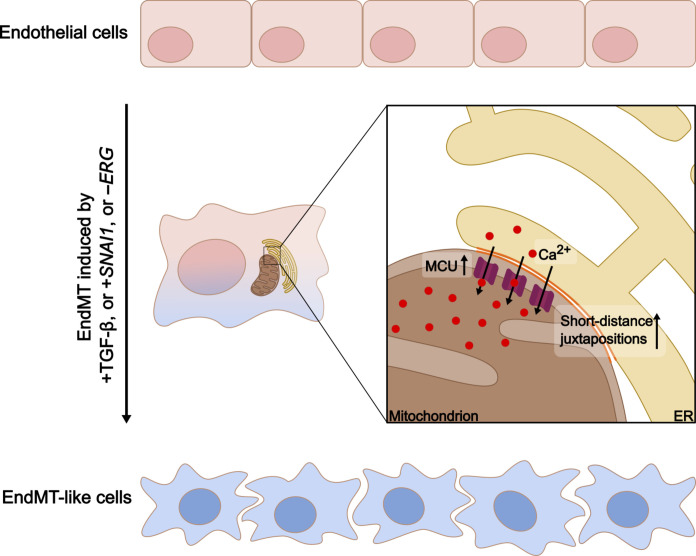
Endothelial cells (ECs) are highly plastic, capable of differentiating into various cell types. Endothelial-to-mesenchymal transition (EndMT) is crucial during embryonic development and contributes substantially to vascular dysfunction in many cardiovascular diseases (CVDs). While targeting EndMT holds therapeutic promise, understanding its mechanisms and modulating its pathways remain challenging. Using single-cell RNA sequencing on three in vitro EndMT models, we identified conserved gene signatures. We validated original regulators in vitro and in vivo during embryonic heart development and peripheral artery disease. EndMT induction led to global expression changes in all EC subtypes rather than in mesenchymal clusters. We identified mitochondrial calcium uptake as a key driver of EndMT; inhibiting mitochondrial calcium uniporter (MCU) prevented EndMT in vitro, and conditional Mcu deletion in ECs blocked mesenchymal activation in a hind limb ischemia model. Tissues from patients with critical limb ischemia with EndMT features exhibited significantly elevated endothelial MCU. These findings highlight MCU as a regulator of EndMT and a potential therapeutic target.


Figures

Fig. 1.
Fig. 1.. scRNA-seq identifies congruent marker genes across three in vitro EndMT induction models.
(A) Graphical representation of the experimental design. (B) UMAP analysis of 32,125 cultured HUVECs from ERG silencing (shERG), SNAI1 overexpression (SNAIOE), and TGF-β experiments. (C) Principal components analysis (PCA) on the pairwise Jaccard similarity coefficients between the top 100 marker genes of cultured EC phenotypes. (D) Upset plot visualization showing the number of congruent genes (65 in gray) in the top 100 proliferating cell marker genes in cultured ECs. (E) Upset plot visualization showing the number of congruent genes (49 in red) in the top 100 tip cell marker genes in cultured ECs. (F) Upset plot visualization showing the number of congruent genes (10 in yellow) in the top 100 mesenchymal cell marker genes in cultured ECs.
Fig. 2.
Fig. 2.. EndMT gene signatures are similar within each model and condition.
Heatmap and hierarchical clustering analysis of the 124 congruent marker genes of all cell states. Note: Marker genes for the intermediate cluster were not calculated since it represents a transitional phase between tip cells and MSCs.
Fig. 3.
Fig. 3.. EndMT induction induces expression changes independent of cellular differentiation state.
(A) Upset plot visualization showing the number of congruently up-regulated genes (red) in EndMT induction independent of cellular differentiation state. (B) String plots indicating canonical EndMT markers, genes involved in mesenchymal activation, ECM remodeling, and TGF-β signaling pathway as for color code. (C) Bar plot showing GSEA performed on the ranked list of genes of the cell state–independent EndMT rank-based meta-analysis for the hallmark gene sets. Up-regulated gene sets are indicated by blue arrowheads.
Fig. 4.
Fig. 4.. GO analysis reveals mitochondrial Ca2+ changes.
(A) Graph of enriched GO terms obtained by GOrilla GO enrichment analysis on the ranked list of genes of the cell state–independent EndMT rank-based meta-analysis. The organelle track and ECM track are separated by a vertical dotted line. The path to the ER/SR lumen is highlighted by bold arrows. The ER and SR lumen terms are highlighted by a red and a blue outlines, respectively. Terms that contain genes associated with mito-Ca2+ signaling are highlighted by a green outline. (B) Bar plot showing the order of terms according to adjusted P value of the GOrilla GO enrichment analysis performed on the ranked list of genes of the cell state–independent EndMT rank-based meta-analysis. The ER and SR lumen terms are highlighted in red and blue, respectively. Terms that contain genes associated with mito-Ca2+ signaling are highlighted in green. FDR, false discovery rate. (C) String plots indicating the rank of ER lumen, SR lumen, and MCU complex genes in the cell state–independent EndMT rank-based meta-analysis.
Fig. 5.
Fig. 5.. EndMT is associated with increased mitochondrial Ca2+ uptake.
(A) ER-Ca2+ imaging traces in response to Tg (2 μM) in control cells (gray trace) and EndMT-derived HUVECs (TGF-β1 stimulation; red trace) maintained in 0 mM extracellular Ca2+ solution. Traces represent the mean CEPIA ratio (462/510 nm) ± SEM of different cells from one representative experiment. (B) Mean slope ± SEM of Tg-mediated ER Ca2+ release relative to three independent experiments. n.s., no significance. (C) ER-Ca2+ imaging traces in response to cyclopiazonic acid (CPA; 20 μM) in control cells (gray trace) and EndMT-derived HUVECs (TGF-β1 stimulation; red trace) maintained in 0 mM extracellular Ca2+ solution during stimulation, followed by the addition of 2 mM extracellular Ca2+ to measure ER refill. Traces represent the mean CEPIA ratio (462/510 nm) ± SEM of different cells from one representative experiment. (D) Mean slope ± SEM of Tg-mediated ER Ca2+ release relative to three independent experiments. (E) Mito-Ca2+ imaging traces in response to Tg (2 μM) in control (gray trace) and EndMT-derived HUVECs (TGF-β1 stimulation; red trace) maintained in 0 mM extracellular Ca2+ solution. Traces represent the mean GECO ratio (455/511 nm) ± SEM of different cells from one representative experiment. (F) Mean peak amplitude ± SEM of Tg-mediated mito-Ca2+ uptake relative to four independent experiments. *P < 0.05. (G) Quantification of the intensity of the dye tetramethylrhodamine ethyl (TMRE) that stains polarized mitochondria in control and EndMT-derived HUVECs (TGF-β1 stimulation; n = 3). Values were corrected for the mitochondrial content (mito-GFP). (H) Representative expression levels and relative quantification of immunoblot for MCU in control and EndMT-derived HUVECs (TGF-β1 stimulation; n = 4). Expression levels were normalized to transferrin receptor (TfR; loading control), and they are relative to control. *P < 0.05.
Fig. 6.
Fig. 6.. MCU overexpression regulates EndMT.
(A) Mito-Ca2+ imaging traces in response to Tg (2 μM) in control HUVECs (gray trace) and EndMT-derived HUVECs (TGF-β1 stimulation) silenced or not for MCU (shMCU1) (blue and red traces, respectively) maintained in 0 mM extracellular Ca2+ solution. Traces represent the mean GECO ratio (455/511 nm) ± SEM of different cells from one representative experiment. (B) Mean peak amplitude ± SEM of Tg-mediated mito-Ca2+ uptake relative to seven independent experiments. *P < 0.05. (C) Reverse transcription polymerase chain reaction (RT-PCR) analysis of mRNA expression levels of mesenchymal and endothelial genes in control HUVECs and in HUVECs silenced for MCU before TGF-β1 stimulation. Expression values were normalized to 18S mRNA levels (n = 3 to 5). Dotted line indicates expression levels in EndMT. *P < 0.05 and **P < 0.01. (D) RT-PCR analysis of mRNA expression levels of mesenchymal and endothelial genes in wild-type (WT) and Mcu knockout (KO) ECs stimulated with TGF-β1 (n = 3 to 6). Dotted line indicates expression levels in EndMT in WT ECs. *P < 0.05. (E) Quantification of scratch wound assay using mitomycin C–treated control (empty), SNAIOE, and shMCU/SNAIOE HUVECs (n = 3). *P < 0.05. (F) Transendothelial electrical resistance analysis of control (empty), SNAIOE, and shMCU/SNAIOE HUVEC monolayers (n = 3). (G) Quantification of the Evans blue dye leakage in the ear of untreated and histamine-treated mice following vehicle or 100 μM RU360 topic application (n = 4 to 5). Values were normalized to milligrams of tissue. *P < 0.05. (H) Quantification of the Evans blue dye leakage in the ear of WT and Snai1ECKO histamine-treated mice (n = 7). Values were normalized to milligrams of tissue. *P < 0.05.
Fig. 7.
Fig. 7.. Endothelial MCU regulates EndMT during cardiac development.
(A) Representative three-dimensional stack confocal heart images of Tg (fli1a:Gal4ff);Tg(UAS:mito-GCamp7a);Tg(fli1a:lifeact-mCherry) embryo at 54 hours after fertilization (hpf) injected with the indicated control and mcu morpholino oligonucleotides (MOs) (n = 6). V, ventricle; A, atrium. Scale bars, 30 μm. (B) Representative single-scanned confocal ventricular heart images of TgBAC(twist1b:EGFP);Tg(myl7:nls-mCherry) embryo at 96 hpf. White arrowheads indicate twist1b+ cells quantified as indicated (n = 4). ****P < 0.0001. V, ventricle. Scale bars, 30 μm. (C) Representative heart micrographs of E11 mouse embryo stained for ECs (CD31; red), mural cells (α-SMA; purple), and MCU (green) (n = 5). Inset shows higher magnification of the boxed area. White arrowheads indicate MCU+ EndMT-derived cells migrating from the endocardium (CD31+) to the center of the cushion. ECC, endocardial cushions; AVC, atrioventricular canal; V, ventricle; A, atrium. Scale bars, 100 μm.
Fig. 8.
Fig. 8.. Endothelial MCU regulates pathological EndMT.
(A) Representative laser Doppler images on left limb (LL) and right limb (RL) after excision of femoral artery in the left limb in McuECWT and McuECKO mice. Imaging colors from blue to red represent increased blood flow, which is defined by the color-coded heatmap. (B) Time course of mean blood flow ratios of ischemic versus normal limb measured before (pre) surgery, immediately after surgery (day 0), and days 3, 7, 14, 21, and 28 (n = 5 to 7). Dotted line indicates the day of surgery. *P < 0.05 and **P < 0.01. (C) Confocal micrographs of blood vessels from ischemic skeletal muscles of McuECWT and McuECKO mice stained for the mesenchymal marker α-SMA (red) and the endothelial marker CD31 (green). Nuclei are counterstained with DAPI (blue). Scale bars, 20 μm. (D) Quantification of α-SMA content in CD31+ vessels shown in images (n = 3 to 4). a.u., arbitrary units. *P < 0.05. (E) Confocal micrographs of small arterioles in human skeletal muscle from individuals with or without chronic limb ischemia (CLI) stained for mural cells (α-SMA; green), ECs (CD31; yellow), and MCU (purple). Nuclei are counterstained with DAPI (blue). Scale bars, 10 μm. CLI arterioles show EC thickening that markedly narrow the vessel lumen. (F) Quantification of endothelial MCU content shown in images. Data are presented as median MCU intensity and interquartile range for 160 and 120 arterioles (n = 4 control individuals and n = 3 individuals with CLI). Colors correspond to each individual. ****P < 0.0001.
Fig. 9.
Fig. 9.. Schematic representation of the proposed signaling in EndMT.
ECs with a characteristic cobblestone morphology undergo mesenchymal activation following induction by TGF-β, SNAI1, or ERG silencing, resulting in EndMT-like cells with altered spindle-like morphology. This transition is associated with closer physical interactions between the mitochondria and ER (orange lines) and is characterized by MCU overexpression, which mediates increased mitochondrial Ca2+ entry. This Ca2+ signaling is crucial for the cellular transformations observed during EndMT.

References

    1. Dejana E., Hirschi K. K., Simons M., The molecular basis of endothelial cell plasticity. Nat. Commun. 8, 14361 (2017). - PMC - PubMed
    1. Sanchez-Duffhues G., Orlova V., Ten Dijke P., In brief: Endothelial-to-mesenchymal transition. J. Pathol. 238, 378–380 (2016). - PubMed
    1. Anderberg C., Cunha S. I., Zhai Z., Cortez E., Pardali E., Johnson J. R., Franco M., Paez-Ribes M., Cordiner R., Fuxe J., Johansson B. R., Goumans M. J., Casanovas O., ten Dijke P., Arthur H. M., Pietras K., Deficiency for endoglin in tumor vsculature weakens the endothelial barrier to metastatic dissemination. J. Exp. Med. 210, 563–579 (2013). - PMC - PubMed
    1. Lovisa S., Fletcher-Sananikone E., Sugimoto H., Hensel J., Lahiri S., Hertig A., Taduri G., Lawson E., Dewar R., Revuelta I., Kato N., Wu C. J., Bassett R. L. Jr., Putluri N., Zeisberg M., Zeisberg E. M., LeBleu V. S., Kalluri R., Endothelial-to-mesenchymal transition compromises vascular integrity to induce Myc-mediated metabolic reprogramming in kidney fibrosis. Sci. Signal. 13, eaaz2597 (2020). - PMC - PubMed
    1. Arciniegas E., Sutton A. B., Allen T. D., Schor A. M., Transforming growth factor beta 1 promotes the differentiation of endothelial cells into smooth muscle-like cells in vitro. J. Cell Sci. 103, 521–529 (1992). - PubMed

Publication types