. 2024 Oct 10;42(29):3491-3503.
doi: 10.1200/JCO.23.02238. Epub 2024 Aug 9.

Genomic Determinants of Outcome in Acute Lymphoblastic Leukemia

Affiliations

Genomic Determinants of Outcome in Acute Lymphoblastic Leukemia

Ti-Cheng Chang et al. J Clin Oncol. .

Abstract

Purpose: Although cure rates for childhood acute lymphoblastic leukemia (ALL) exceed 90%, ALL remains a leading cause of cancer death in children. Half of relapses arise in children initially classified with standard-risk (SR) disease.

Materials and methods: To identify genomic determinants of relapse in children with SR ALL, we performed genome and transcriptome sequencing of diagnostic and remission samples of children with SR (n = 1,381) or high-risk B-ALL with favorable cytogenetic features (n = 115) enrolled on Children's Oncology Group trials. We used a case-control study design analyzing 439 patients who relapsed and 1,057 who remained in complete remission for at least 5 years.

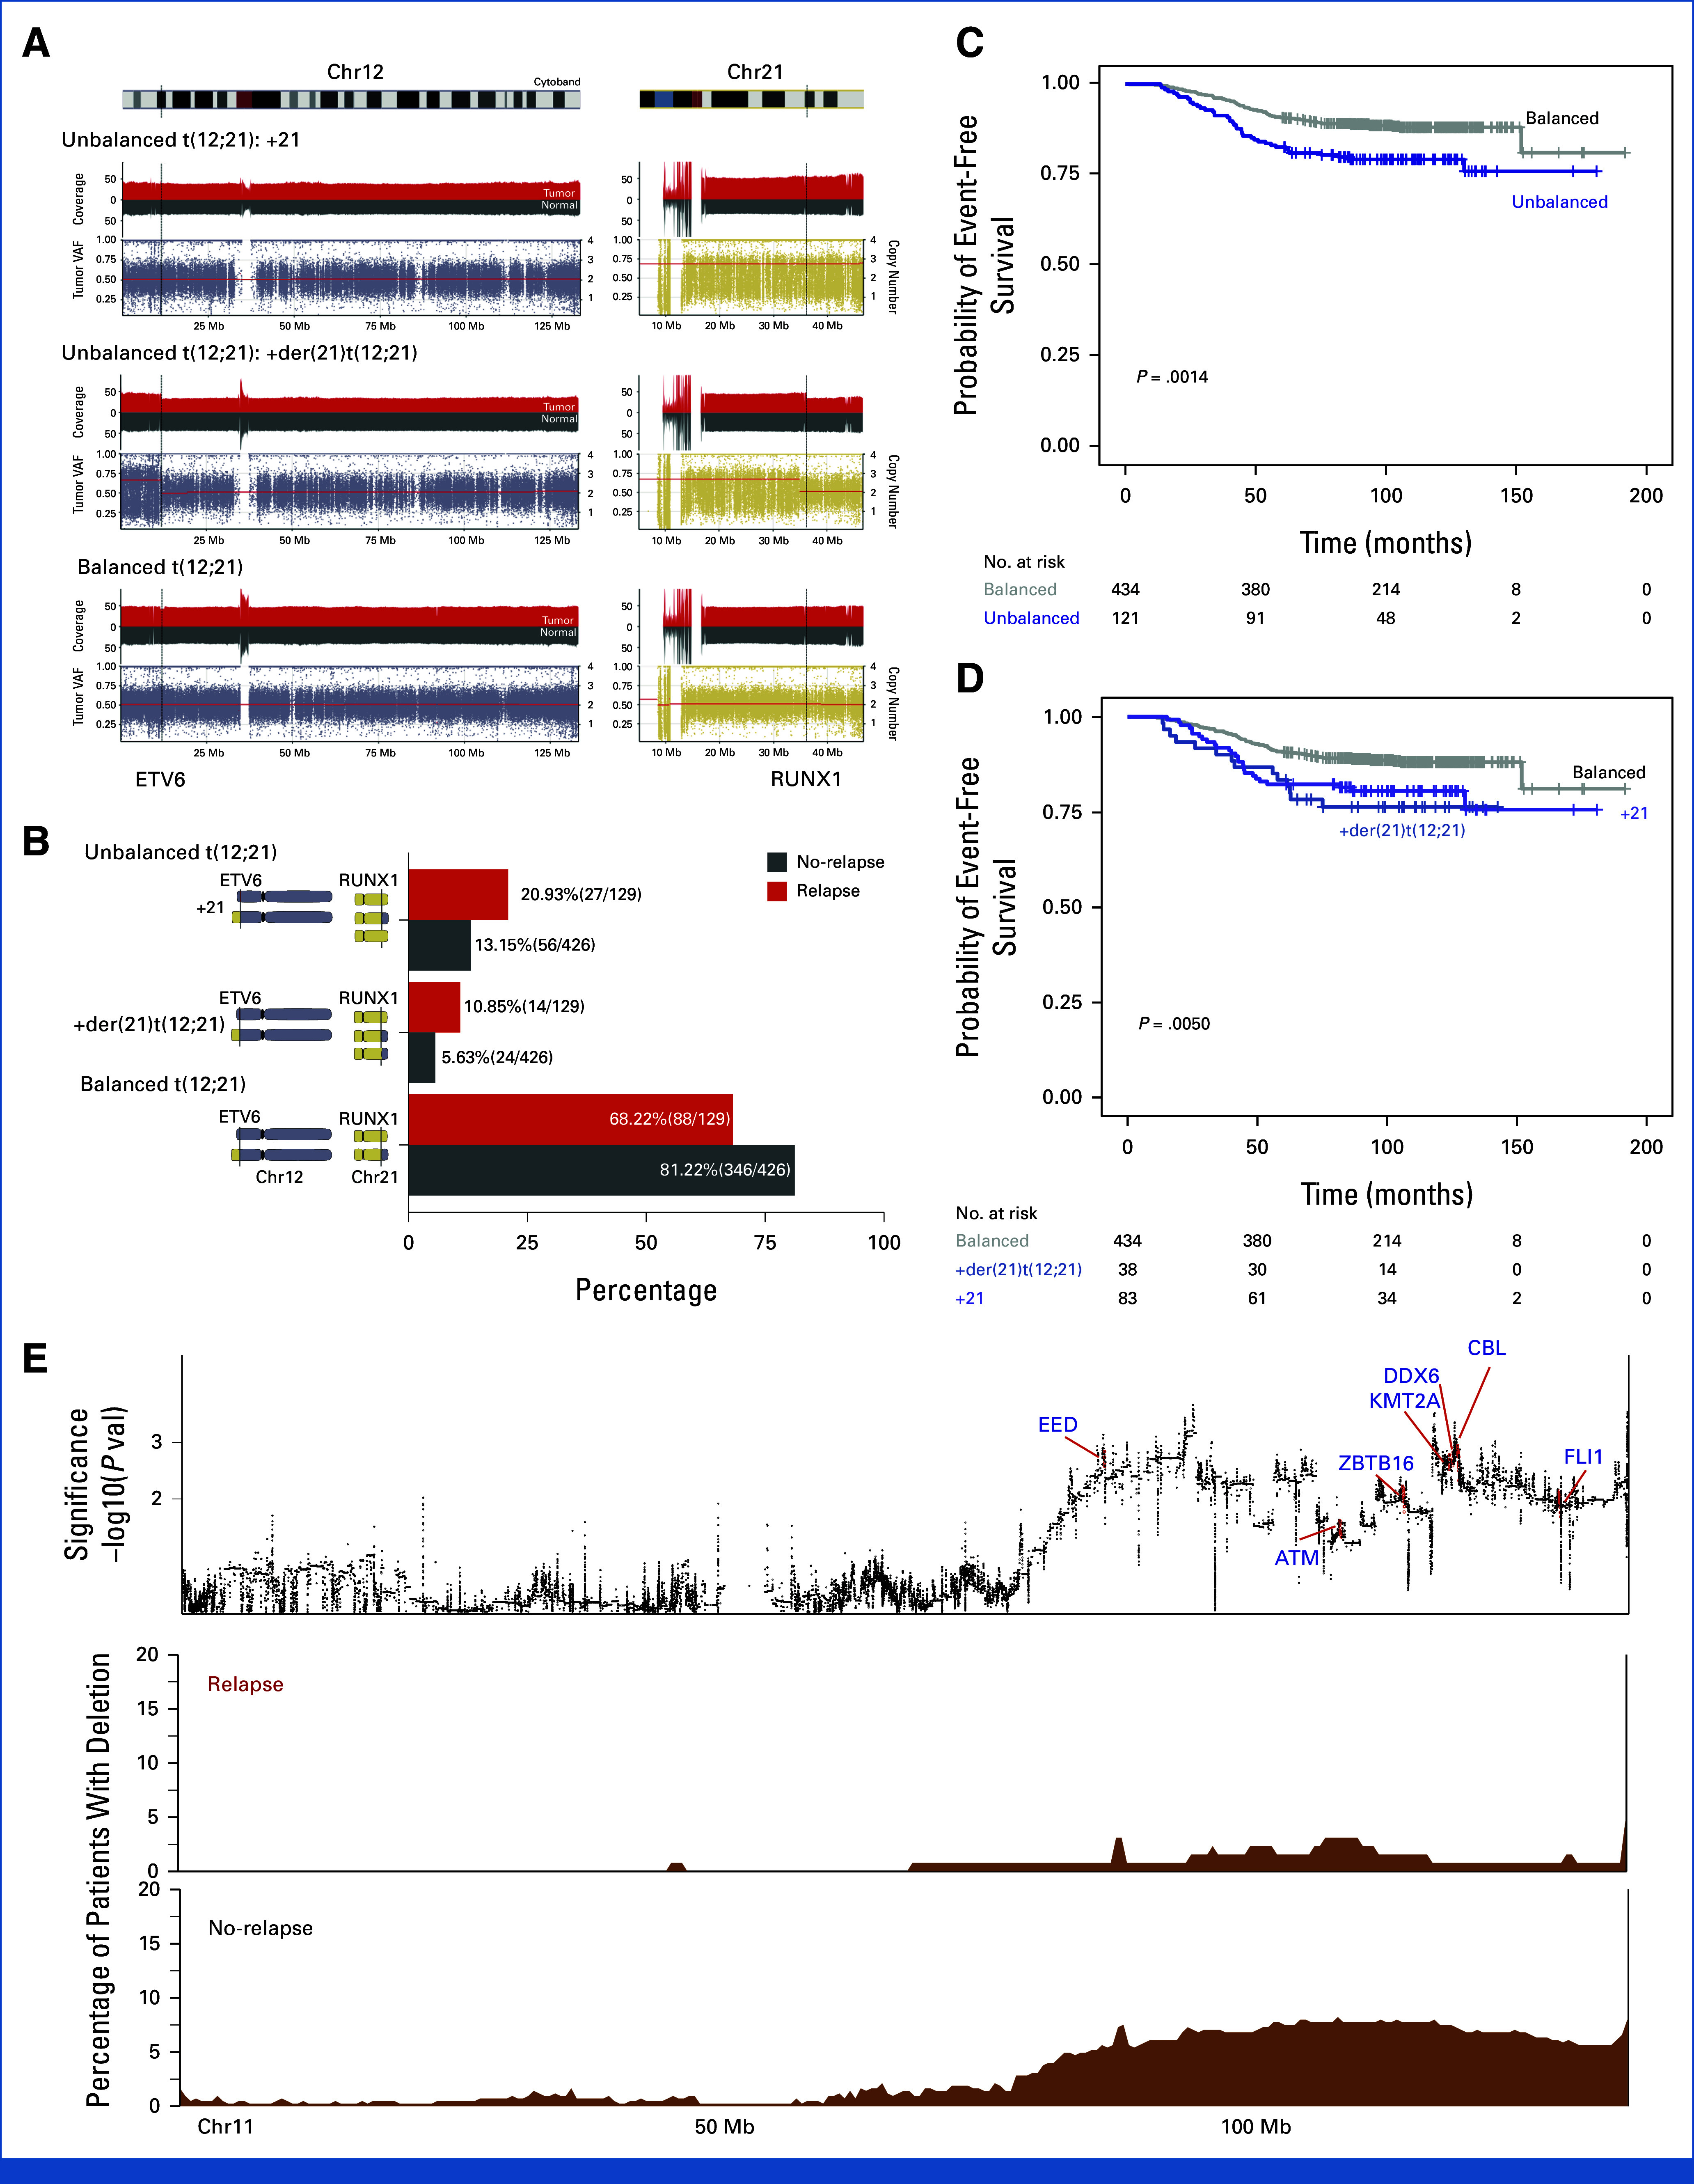
Results: Genomic subtype was associated with relapse, which occurred in approximately 50% of cases of PAX5-altered ALL (odds ratio [OR], 3.31 [95% CI, 2.17 to 5.03]; P = 3.18 × 10⁻⁸). Within high-hyperdiploid ALL, gain of chromosome 10 with disomy of chromosome 7 was associated with favorable outcome (OR, 0.27 [95% CI, 0.17 to 0.42]; P = 8.02 × 10⁻¹⁰; St Jude Children's Research Hospital validation cohort: OR, 0.22 [95% CI, 0.05 to 0.80]; P = .009), and disomy of chromosomes 10 and 17 with gain of chromosome 6 was associated with relapse (OR, 7.16 [95% CI, 2.63 to 21.51]; P = 2.19 × 10⁻⁵; validation cohort: OR, 21.32 [95% CI, 3.62 to 119.30]; P = .0004). Genomic alterations were associated with relapse in a subtype-dependent manner, including alterations of INO80 in ETV6::RUNX1 ALL, IKZF1, and CREBBP in high-hyperdiploid ALL and FHIT in BCR::ABL1-like ALL. Genomic alterations were also associated with the presence of minimal residual disease, including NRAS and CREBBP in high-hyperdiploid ALL.

Conclusion: Genetic subtype, patterns of aneuploidy, and secondary genomic alterations determine risk of relapse in childhood ALL. Comprehensive genomic analysis is required for optimal risk stratification.

Trial registration: ClinicalTrials.gov NCT00103285 NCT01190930 NCT00549848 NCT02883049 NCT00137111 NCT00075725.


Conflict of interest statement

The following represents disclosure information provided by authors of this manuscript. All relationships are considered compensated unless otherwise noted. Relationships are self-held unless noted. I = Immediate Family Member, Inst = My Institution. Relationships may not relate to the subject matter of this manuscript. For more information about ASCO's conflict of interest policy, please refer to www.asco.org/rwc or ascopubs.org/jco/authors/author-center.

Open Payments is a public database containing information reported by companies about payments made to US-licensed physicians (Open Payments).

No other potential conflicts of interest were reported.

Figures

FIG 1.
FIG 1.
Numbers of subtypes, relapse, and associated clinical features of the 1,496 analyzed MP2PRT study group. (A) Genomic subtypes and frequency relapse for the entire group; (B) Forest plots assessing contributions of clinical features and major genetic subtypes on risk of relapse. The dots represent log2 odds ratios and the lines represent the lower and upper bound of the 95% CI of the odds ratio. For risk, the reference level is the standard risk; for sex, the reference level is male; for self-identified ancestry, the reference level is Caucasian. DT, double trisomy of chromosomes 4 and 10; for age, the reference level is age <3 years; for subtype, the reference level is ETV6::RUNX1. The subtypes with sample size <10 are not shown. MP2PRT, Molecular Profiling to Predict Responses to Therapy; MRD, minimal residual disease.
FIG 2.
FIG 2.
Associations of unbalanced translocations with poor outcome and 11q deletions with favorable outcome in ETV6::RUNX1 ALL. (A) Coverage profiles and variant allele frequency distribution on chr12 and chr21 for representative cases. For each case, WGS coverage for matched tumor/normal samples is shown in the top track and variant allele frequency is shown in the bottom. The red line represents the log2 ratio of the segments. (B) Comparison of percentage of patients with balanced and unbalanced ETV6::RUNX1 translocations. Unbalanced ETV6::RUNX1 translocation was more prevalent in relapse samples (P = .0027). (C) Weighted Kaplan-Meier (KM) curves of cases with unbalanced versus balanced ETV6::RUNX1 translocations. Cases with unbalanced translocations had inferior outcome compared with those with balanced translocation. (D) Weighted KM curves with unbalanced cases subclassified into +21 and +der(21)t(12;21) groups. (E) Top, significance of chr11q deletion enrichment in nonrelapsed patients on the basis of associations between CNV (log2 ratio) and the relapse status. Putative leukemia driver genes are highlighted in blue. Bottom, percentage of cases with deletion in relapse or no-relapse of ETV6::RUNX1. Window size is 500 Kbp. CNV, copy number variations; WGS, whole genome sequencing.
FIG 3.
FIG 3.
PAX5alt genomic alterations and associations with relapse. (A) Oncoprint of PAX5alt lesions in the MP2PRT study group. (B) CNV segmentation plot and percentage of samples with PAX5 gains. (C) Weighted Kaplan-Meier curves for groups classified on the basis of granular combination types of SNV/indel, SV, and CNV. Significance values from weighted Cox regression test results are shown on the right. *P < .05. CNV, copy number variations; MP2PRT, Molecular Profiling to Predict Responses to Therapy; SNV, single nucleotide variations; SV, structural variations; WT, wild-type.
FIG 4.
FIG 4.
Association of secondary alterations with risk of relapse or MRD positivity for ALL driver genes. (A) Associations with relapse using the full group with adjustment for genomic subtypes. (B) Associations with relapse within each genomic subtype. (C) The association with EOI MRD status (MRD >0.01%) within each subtype. No significant associations with EOI MRD positivity were observed using the full study group adjusting for subtypes. FDR <0.2 and subtypes with sample size >50 were shown. EOI MRD, end of induction minimal residual disease; FDR, false discovery rate; MRD, minimal residual disease; OR, odds ratio.
FIG 5.
FIG 5.
Specific structural somatic variants of IKZF1 are enriched in patients who relapsed. (A) Regions of somatic deletion of IKZF1 (blue lines) for each patient, ordered by relapse or no-relapse. Exons are shown on the top. (B) Percentage of samples with IKZF1 deletions (DEL). Exon 4-7 and 4-8 deletions were enriched in the relapse samples. (C) Somatic IKZF1 sequence variants in the MP2PRT group. (D) Weighted KM curves for groups classified on the basis of types of exon deletions in each sample. Samples with exon 4-5 or 4-7 deletions were classified as DEL_dominant_negative; samples with other deletions were classified as DEL_other. NoDel are samples without IKZF1 deletions. The weighted Cox regression test results are shown on the right. (E, F) Weighted KM curves for MLPA-equivalent IKZF1plus. **P < .01. MLPA, multiplex ligation probe amplification; MP2PRT, Molecular Profiling to Predict Responses to Therapy.
FIG 6.
FIG 6.
CART classification model using copy number changes to predict risk of relapse for hyperdiploid ALL. (A) CART classification model using copy number changes in hyperdiploid cases. The model was built on the basis of the sample relapse status. The percentage represents the fraction of hyperdiploid patients in each group. (B) Weighted KM curves for hyperdiploid samples in MP2PRT stratified by the classes determined in the CART model. Risk table is shown at the bottom. (C) Weighted KM curves for the hyperdiploid samples in the SJCRH Total 15/16 cohorts stratified by the classes determined by the CART model. Risk table is shown at the bottom. ALL, acute lymphoblastic leukemia; CART, classification and regression tree; MP2PRT, Molecular Profiling to Predict Responses to Therapy; SJCRH, St Jude Children's Research Hospital.

References

    1. Hunger SP, Mullighan CG: Acute lymphoblastic leukemia in children. N Engl J Med 373:1541-1552, 2015 - PubMed
    1. Iacobucci I, Kimura S, Mullighan CG: Biologic and therapeutic implications of genomic alterations in acute lymphoblastic leukemia. J Clin Med 10:3792, 2021 - PMC - PubMed
    1. Harvey RC, Mullighan CG, Wang X, et al. : Identification of novel cluster groups in pediatric high-risk B-precursor acute lymphoblastic leukemia with gene expression profiling: Correlation with genome-wide DNA copy number alterations, clinical characteristics, and outcome. Blood 116:4874-4884, 2010 - PMC - PubMed
    1. Roberts KG, Li Y, Payne-Turner D, et al. : Targetable kinase-activating lesions in Ph-like acute lymphoblastic leukemia. N Engl J Med 371:1005-1015, 2014 - PMC - PubMed
    1. Rheingold SR, Ji L, Xu X, et al. : Prognostic factors for survival after relapsed acute lymphoblastic leukemia (ALL): A Children’s Oncology group (COG) study. J Clin Oncol 37, 2019. (15_suppl; abstr 10008)

Substances

Associated data