. 2024 Dec 2;14(12):2430-2449.
doi: 10.1158/2159-8290.CD-23-0866.

Epigenetic and Oncogenic Inhibitors Cooperatively Drive Differentiation and Kill KRAS-Mutant Colorectal Cancers

Affiliations

Epigenetic and Oncogenic Inhibitors Cooperatively Drive Differentiation and Kill KRAS-Mutant Colorectal Cancers

Patrick Loi et al. Cancer Discov. .

Abstract

Combined EZH2 and RAS pathway inhibitors kill KRAS-mutant colorectal cancer cells and promote durable tumor regression in vivo. These agents function by cooperatively suppressing the WNT pathway, driving differentiation, and epigenetically reprogramming cells to permit the induction of apoptotic signals, which then kill these more differentiated tumor cells.


Conflict of interest statement

P. Loi reports grants from the NIH/NCI during the conduct of the study. A.E. Schade reports grants from the American Cancer Society during the conduct of the study. M. Watanabe reports grants from Brigham and Women’s Hospital during the conduct of the study. O. Popow reports grants from Cancer Research UK and the Mark Foundation for Cancer Research during the conduct of the study. N. Gunduz reports grants from Cancer Grand Challenges during the conduct of the study. M. Giannakis reports grants from Janssen and personal fees from Nerviano Medical Sciences outside the submitted work. K. Ng reports nonfinancial support from Pharmavite, grants from Janssen, personal fees from Bayer, GlaxoSmithKline, Pfizer, CytomX, Jazz Pharmaceuticals, Revolution Medicines, AbbVie, Etiome, Seagen, CRICO, and JAMA outside the submitted work. S. Santagata reports being speaker honoraria for Novartis and Roche. K. Helin reports grants from the Cancer Research UK Grand Challenge and the Mark Foundation for Cancer Research to the SPECIFICANCER team during the conduct of the study. O.J. Sansom reports grants from AstraZeneca, Novartis, Boehringer Ingelheim, and Cancer Research Horizons outside the submitted work. K. Cichowski reports grants from Cancer Research UK and the Mark Foundation for Cancer Research during the conduct of the study, as well as other support from Erasca outside the submitted work. No disclosures were reported by the other authors.

Figures
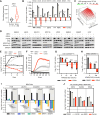
Figure 1.
Figure 1.
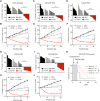
EZH2 inhibitors dramatically sensitize KRAS-mutant colorectal cancer to RAS pathway inhibitors. A,EZH2 mRNA levels in colorectal cancer tumors and matched normal colonic tissue. Sixty-six percent of colorectal cancer tumors have EZH2 expression two-fold higher (78.5% have two standard deviations higher) than the mean of normal colonic tissue. B, Proliferation assay over 5 days in a panel of KRAS-mutant colorectal cancer cell lines treated with DMSO, EZH2 inhibitor (5 μmol/L tazemetostat), MEK inhibitor (1–50 nmol/L trametinib, see “Methods”), or combination. Graph reflects the relative change in cell number (log2 fold scale to best visualize loss of cells) compared with day 0. C, Synergy plots depicting Gaddum’s non-interaction model (HSA) for LOVO cells treated with EZH2i and/or MEKi. D, Immunoblots depicting relative levels of MEK target inhibition (pERK) and EZH2 target inhibition (H3K27me3) and relevant loading controls after 16–24 hours of treatment with indicated compounds in cell lines from B. E, Proliferation assay of LOVO cells treated with EZH2i or MEKi over 14 days. Unpaired two-tailed t test between MEKi- and combo-treated cells at last timepoint. F, Percentage caspase 3/7+ (apoptotic) LOVO cells after treatment with the indicated agents over time measured by Incucyte live-cell imaging. P value determined by ANOVA. G and H, Proliferation assay in several cell lines harboring KRASG12D or KRASG12C mutations after treatment with the indicated compounds (MRTX1133—KRASG12D inhibitor in G or MRTX849—KRASG12C inhibitor in H). I, Proliferation assay of a panel of BRAFV600E-mutant colorectal cancer cell lines over 5 days treated with MEKi (trametinib), BRAFi (encorafenib), αEGFR (cetuximab), and/or EZH2i (tazemetostat). Concentrations are reported in “Methods” for each cell line. J, Proliferation assay in a panel of colorectal cancer cell lines with no activating mutations in KRAS or BRAF over 5 days, treated with EZH2i (tazemetostat) and/or MEKi (trametinib). Unless otherwise indicated, for all subfigures bars represent mean ± SD, P value measured by unpaired t test. *, P < 0.05; **, P < 0.01; ***, P < 0.001; ****, P < 0.0001. A loss of 50% of cells or a log2 fold change of −1 is denoted with a dotted line.
Figure 2.
Figure 2.
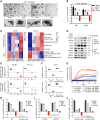
Combined suppression of EZH2 and the RAS pathway promotes tumor regression in multiple in vivo models and enhances survival. A–J, Top, waterfall plots depict change in tumor volume in KRAS-mutant colorectal cancer xenograft model LOVO (A and B), COCA74P colorectal cancer PDX (C and D), COCA9 colorectal cancer PDX (E and F), COCA4 colorectal cancer PDX (G and H), or COCA30 colorectal cancer PDX (I and J) at day 28, after 21 days of treatment with vehicle, EZH2i (tazemetostat), and/or MEKi (trametinib). Each bar represents an individual tumor. Bottom, Graphs depict maximal change in tumor volume over time compared with day 7 at the start of MEKi/vehicle treatment. Each data point represents mean ± SEM of individual tumors shown in A, C, E, G, and I. In all models, tumors were implanted subcutaneously, and established tumors were pretreated for 7 days with vehicle or EZH2i (tazemetostat) prior to treatment with additional vehicle, MEKi, and/or EZH2i treatment starting at day 7, for a total of 28 days. Axis depicts percent change in tumor volume. ****, P value < 0.0001 determined using Mann–Whitney test between MEKi- and combo-treated arms. K, Kaplan–Meier survival curve of COCA74P PDX mice treated with vehicle, MEKi (trametinib), and/or EZH2i (tazemetostat). MEKi vs. combo P = 0.002 via log rank test. Median survival for vehicle, MEKi, EZH2i, and combo is 42, 48, 46, and 77 days, respectively.
Figure 3.
Figure 3.
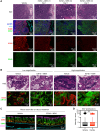
EZH2 and MEK inhibitors cooperatively suppress WNT signaling and drive differentiation. A, Representative images of vehicle-, MEKi-, EZH2i-, and combo-treated AKP tumor organoids 24 hours after combination treatment (6 days after EZH2i pretreatment). Magnification shown for EZH2i-treated organoids. Scale bars, 150 μm. B, Proliferation assay for AKP and AKPT tumor organoids after treatment with the indicated compounds for 3 days. C, ssGSEA of signatures associated with differentiated cell types using RNA-seq from LOVO and SK-CO1 cell lines treated with EZH2i and/or MEKi. Signatures composed of combined gene lists as described in refs. , . D, Immunoblot of LOVO protein lysates from cells treated with EZH2i and/or MEKi depicting expression of several proteins associated with differentiated intestinal cells (ATOH1, KRT20, KLF4, and CDX2) and stem cells (LGR5, SOX9, PROM1, and CDCA7). pERK and H3K27me3 indicate MEKi and EZH2i target inhibition, and ERK, Histone H3, and GAPDH are loading controls. Quantification indicates fold change (FC) compared with DMSO. E and F, Plots depicting ssGSEA z-scores of signatures associated with oncogenic intestinal Wnt signaling from RNA-seq data in (E) SW620 and SK-CO1 cells or (F) LOVO cells transduced with an empty vector or a construct to express a constitutively active form of β-catenin after treatment with the indicated agents (C, combination; D, DMSO; E, tazemetostat; M, trametinib). G, Caspase 3/7+ cells (apoptotic) after treatment with EZH2i and/or MEKi in LOVO cells expressing empty vector or β-catenin △90 as measured by Incucyte live-cell imaging. P value determined with two-way ANOVA between empty vector and β-catenin △90 transduced combo-treated cells. H, Proliferation of LOVO pLV β-catenin △90 cells treated with MEKi and/or EZH2i for 5 days. I, Proliferation of LOVO cells transfected with siRNAs against a control sequence or CDX2 and then treated with MEKi and/or EZH2i for 5 days. J, Proliferation of SK-CO1 cells transduced with lentivirus to express LacZ or SOX9 and then treated with MEKi and/or EZH2i for 5 days. Unless otherwise indicated, for all subfigures bars represent mean ± SD of technical replicates. P value measured by unpaired t test. *, P < 0.05; **, P < 0.01; ***, P < 0.001; ****, P < 0.0001.
Figure 4.
Figure 4.
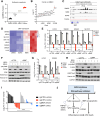
Co-suppression of EZH2 and RAS signaling selectively drives differentiation of tumors in vivo. A, Histological (H&E) and multiplexed immunofluorescent (CyCIF) imaging of cell line–derived xenograft LOVO tumors treated with vehicle or EZH2i for 7 days followed by EZH2i + MEKi for 1, 2, or 3 additional days. Imaging was conducted using antibodies against SMA (cyan; structural), panCK (blue; epithelial), SOX9 (red; stem-like), and CDX2 (green; differentiated) in merged or single channel images as indicated. B, Same as A, but using PDX COCA30 tumors treated with vehicle or EZH2i for 7 days followed by EZH2i + MEKi for 1 additional day. Low- and high-magnification images are shown. C, Multiplexed immunofluorescent imaging (CyCIF) of colon tissue from tumor bearing mice after 21 days of treatment with vehicle or EZH2i + MEKi stained with antibodies for SMA (cyan; structural), Hoechst (blue; nuclei), SOX9 (red; stem-like), CDX2 (green; differentiated), and KRT20 (magenta; differentiated). D, Quantification of Ki67 intensity in cellular compartment of colons described in C. H&E, hematoxylin and eosin.
Figure 5.
Figure 5.
Induction of the WNT pathway repressor TLE4 contributes to the therapeutic response. A, Venn diagram schematic of the number of candidate genes overlapping from CUT&RUN (differential loss of H3K27me3 between combo and DMSO) and RNA-seq [>1 log2 fold change (FC) increase between combo and DMSO] in LOVO and SW620 cell lines after filtering for statistical significance (P adj < 0.05, FDR < 0.05). B, Proliferation assays were conducted in LOVO cells transfected with the indicated siRNAs and then treated with DMSO or a combination of MEKi and EZH2i. Volcano plot depicts relative FC in cell number compared with siCTRL and P value after 5 days of drug treatment after siRNA transfection. C, Proliferation assay in LOVO cells transduced with sgRNAs against a control sequence, or two different targeting sequences against TLE4, and then treated with MEKi and/or EZH2i for 5 days. D, Immunoblot of LOVO cells transduced with sgRNAs against a control sequence or TLE4 (guide #1) and then treated with MEKi and/or EZH2i using indicated antibodies. E, Proliferation of SW620 cells transfected with siRNAs against a control sequence or TLE4 and then treated with MEKi and/or EZH2i for 5 days. F,In vivo xenograft assay with mice injected with LOVO sgCTRL or sgTLE4 cells and subsequently treated with vehicle or combination of EZH2 and MEK inhibitors. Graphs depict change in tumor volume over time compared with day 7 at the start of MEKi/vehicle treatment. Each data point represents mean ± SEM of individual tumors. ****, P value < 0.0001 determined using Mann–Whitney test between sgCTRL and sgTLE4 combo–treated arms. G, Histogram depicting H3K27me3 in LOVO cells treated with indicated compounds from CUT&RUN experiment. Genome view depicts TLE4 gene body. H, GSEA leading edge plot depicting enrichment of β-catenin–regulated signature in sgTLE4 combo treated cells vs. sgCTRL combo–treated cells. Unless otherwise indicated, for all subfigures bars represent mean ± SD of technical replicates. P value measured by unpaired t test. *, P < 0.05; **, P < 0.01; ***, P < 0.001; ****, P < 0.0001.
Figure 6.
Figure 6.
EZH2 and RAS pathway inhibitors cooperatively upregulate PRC2 targets and induce additional WNT suppressive/differentiation genes. A, Transcriptional heatmap of LOVO cells showing relative mRNA levels (P adj < 0.05, base means >10) of PRC2 targets as defined by differential loss of H3K27me3 from CUT&RUN experiments after treatment with DMSO, MEKi, and/or EZH2i [de novo upregulation = 275 genes as defined by combo vs. DMSO log2 fold change (FC) >1 and EZH2i vs. DMSO log2 FC <1; and cooperatively upregulated = 259 genes as defined by both combo vs. DMSO and EZH2i vs. DMSO > 1, with a difference >0.5]. B, Table depicting GO:BP terms associated with negative regulation of WNT signaling pathways (top) and differentiation (bottom) that are significantly enriched in the 534 de novo/cooperatively upregulated PRC2 targets. C, Table listing some cooperatively upregulated PRC2 genes that impinge on WNT and differentiation pathways. Combo vs. EZH2i FC and combo vs. DMSO FC are shown to highlight the additional effects of adding trametinib on their expression. D–F, Proliferation of LOVO cells in D, SW620 cells in E, and SK-CO1 cells in F transfected with the indicated siRNAs and then treated with DMSO or a combination of MEKi and EZH2i for 5 days. Mean ± SD of technical replicates; P value measured by unpaired t test between combo-treated conditions. *, P < 0.05; **, P < 0.01; ***, P < 0.001.
Figure 7.
Figure 7.
Apoptosis is mediated by the cooperative induction of the proapoptotic protein BMF. A, ssGSEA z-scores of Hallmarks: apoptosis signature from RNA-seq data in LOVO cell lines treated with MEKi and/or EZH2i, n = 3. B, Plot depicting all differentially expressed genes (P adj < 0.05) between combo and DMSO treatment in LOVO cells by log2 fold change (FC) and rank from the most differentially downregulated gene to the most differentially upregulated gene. Proapoptotic BCL2 family members are depicted in red, and antiapoptotic BCL2 family members are depicted in blue. BMF is the most significantly differentially expressed BCL2 family member gene in combo-treated cells. C, Histogram depicting H3K27me3 in LOVO cells treated with indicated compounds using CUT&RUN. Genome section depicts BMF locus and genomic regions upstream. D, Transcriptional heatmap depicting relative z-score normalized mRNA levels of BMF in the indicated cell lines after treatment with DMSO, MEKi, and/or EZH2i. Heatmap rows represent mRNA levels obtained from RNA-seq experiments (LS513, SW620, SK-CO1, and LOVO) and mRNA levels obtained from qRT-PCR using BMF primers (SW403, SW1116, SW837, and H747). E, Left, Proliferation of LOVO, SW620, SW403, and SK-CO1 cells transfected with siRNAs against a control sequence or BMF, and then treated with MEK and/or EZH2i for 5 days. F, Immunoblot of LOVO protein lysates with stable HA knockin at endogenous BMF locus transfected with siRNAs against a control sequence or BMF and then treated with MEKi and/or EZH2i after 16 hours. G, Proliferation of LOVO and SW620 cells transduced with sgRNAs against a control sequence or BMF and then treated with MEKi and/or EZH2i for 5 days. H, Same as F, but cells were transfected with siRNAs against a control sequence or BMF. I,In vivo xenograft assay with mice injected with LOVO sgCTRL or sgBMF cells and subsequently treated with vehicle or combination of EZH2 and MEK inhibitors. Waterfall plots depict maximal change in tumor volume after 14 days of treatment with vehicle or a combination of EZH2i (tazemetostat) and MEKi (trametinib). Each bar represents an individual tumor. ****, P value < 0.0001 determined using Mann–Whitney test between sgCTRL and sgBMF combo–treated arms. Note that the sgCTRL vehicle- and combo-treated tumors are identical to the sgCTRL tumors depicted in Fig. 5F as these studies were performed concomitantly. J, Model depicting the mechanism by which EZH2 and RAS pathway inhibitors trigger cell death through the parallel induction of differentiation and the potent upregulation of BMF, a proapoptotic regulator. Differentiation is driven by the de-repression of a network of EZH2 targets that suppress the WNT/β-catenin pathway, including TLE4, and additional genes involved in intestinal differentiation. Unless otherwise indicated, for all subfigures, bars represent mean ± SD of technical replicates. P value measured by unpaired t test. *, P < 0.05; **, P < 0.01; ***, P < 0.001; ****, P < 0.0001.

References

    1. Kuipers EJ, Grady WM, Lieberman D, Seufferlein T, Sung JJ, Boelens PG, et al. . Colorectal cancer. Nat Rev Dis Primers 2015;1:15065. - PMC - PubMed
    1. O’Connell JB, Maggard MB, Ko CY. Colon cancer survival rates with the new American joint committee on cancer sixth edition staging. J Natl Cancer Inst 2004;96:1420–5. - PubMed
    1. Brenner H, Kloor M, Pox CP. Colorectal cancer. Lancet 2014;383:1490–502. - PubMed
    1. Morel D, Jeffery D, Aspeslagh S, Almouzni G, Postel-Vinay S. Combining epigenetic drugs with other therapies for solid tumours—past lessons and future promise. Nat Rev Clin Oncol 2020;17:91–107. - PubMed
    1. Ryan MB, Corcoran RB. Therapeutic strategies to target RAS-mutant cancers. Nat Rev Clin Oncol 2018;15:709–20. - PubMed

MeSH terms

Substances