. 2024 Aug 8;187(16):4336-4354.e19.
doi: 10.1016/j.cell.2024.07.018.

LAG-3 sustains TOX expression and regulates the CD94/NKG2-Qa-1b axis to govern exhausted CD8 T cell NK receptor expression and cytotoxicity

Affiliations

LAG-3 sustains TOX expression and regulates the CD94/NKG2-Qa-1b axis to govern exhausted CD8 T cell NK receptor expression and cytotoxicity

Shin Foong Ngiow et al. Cell. .

Abstract

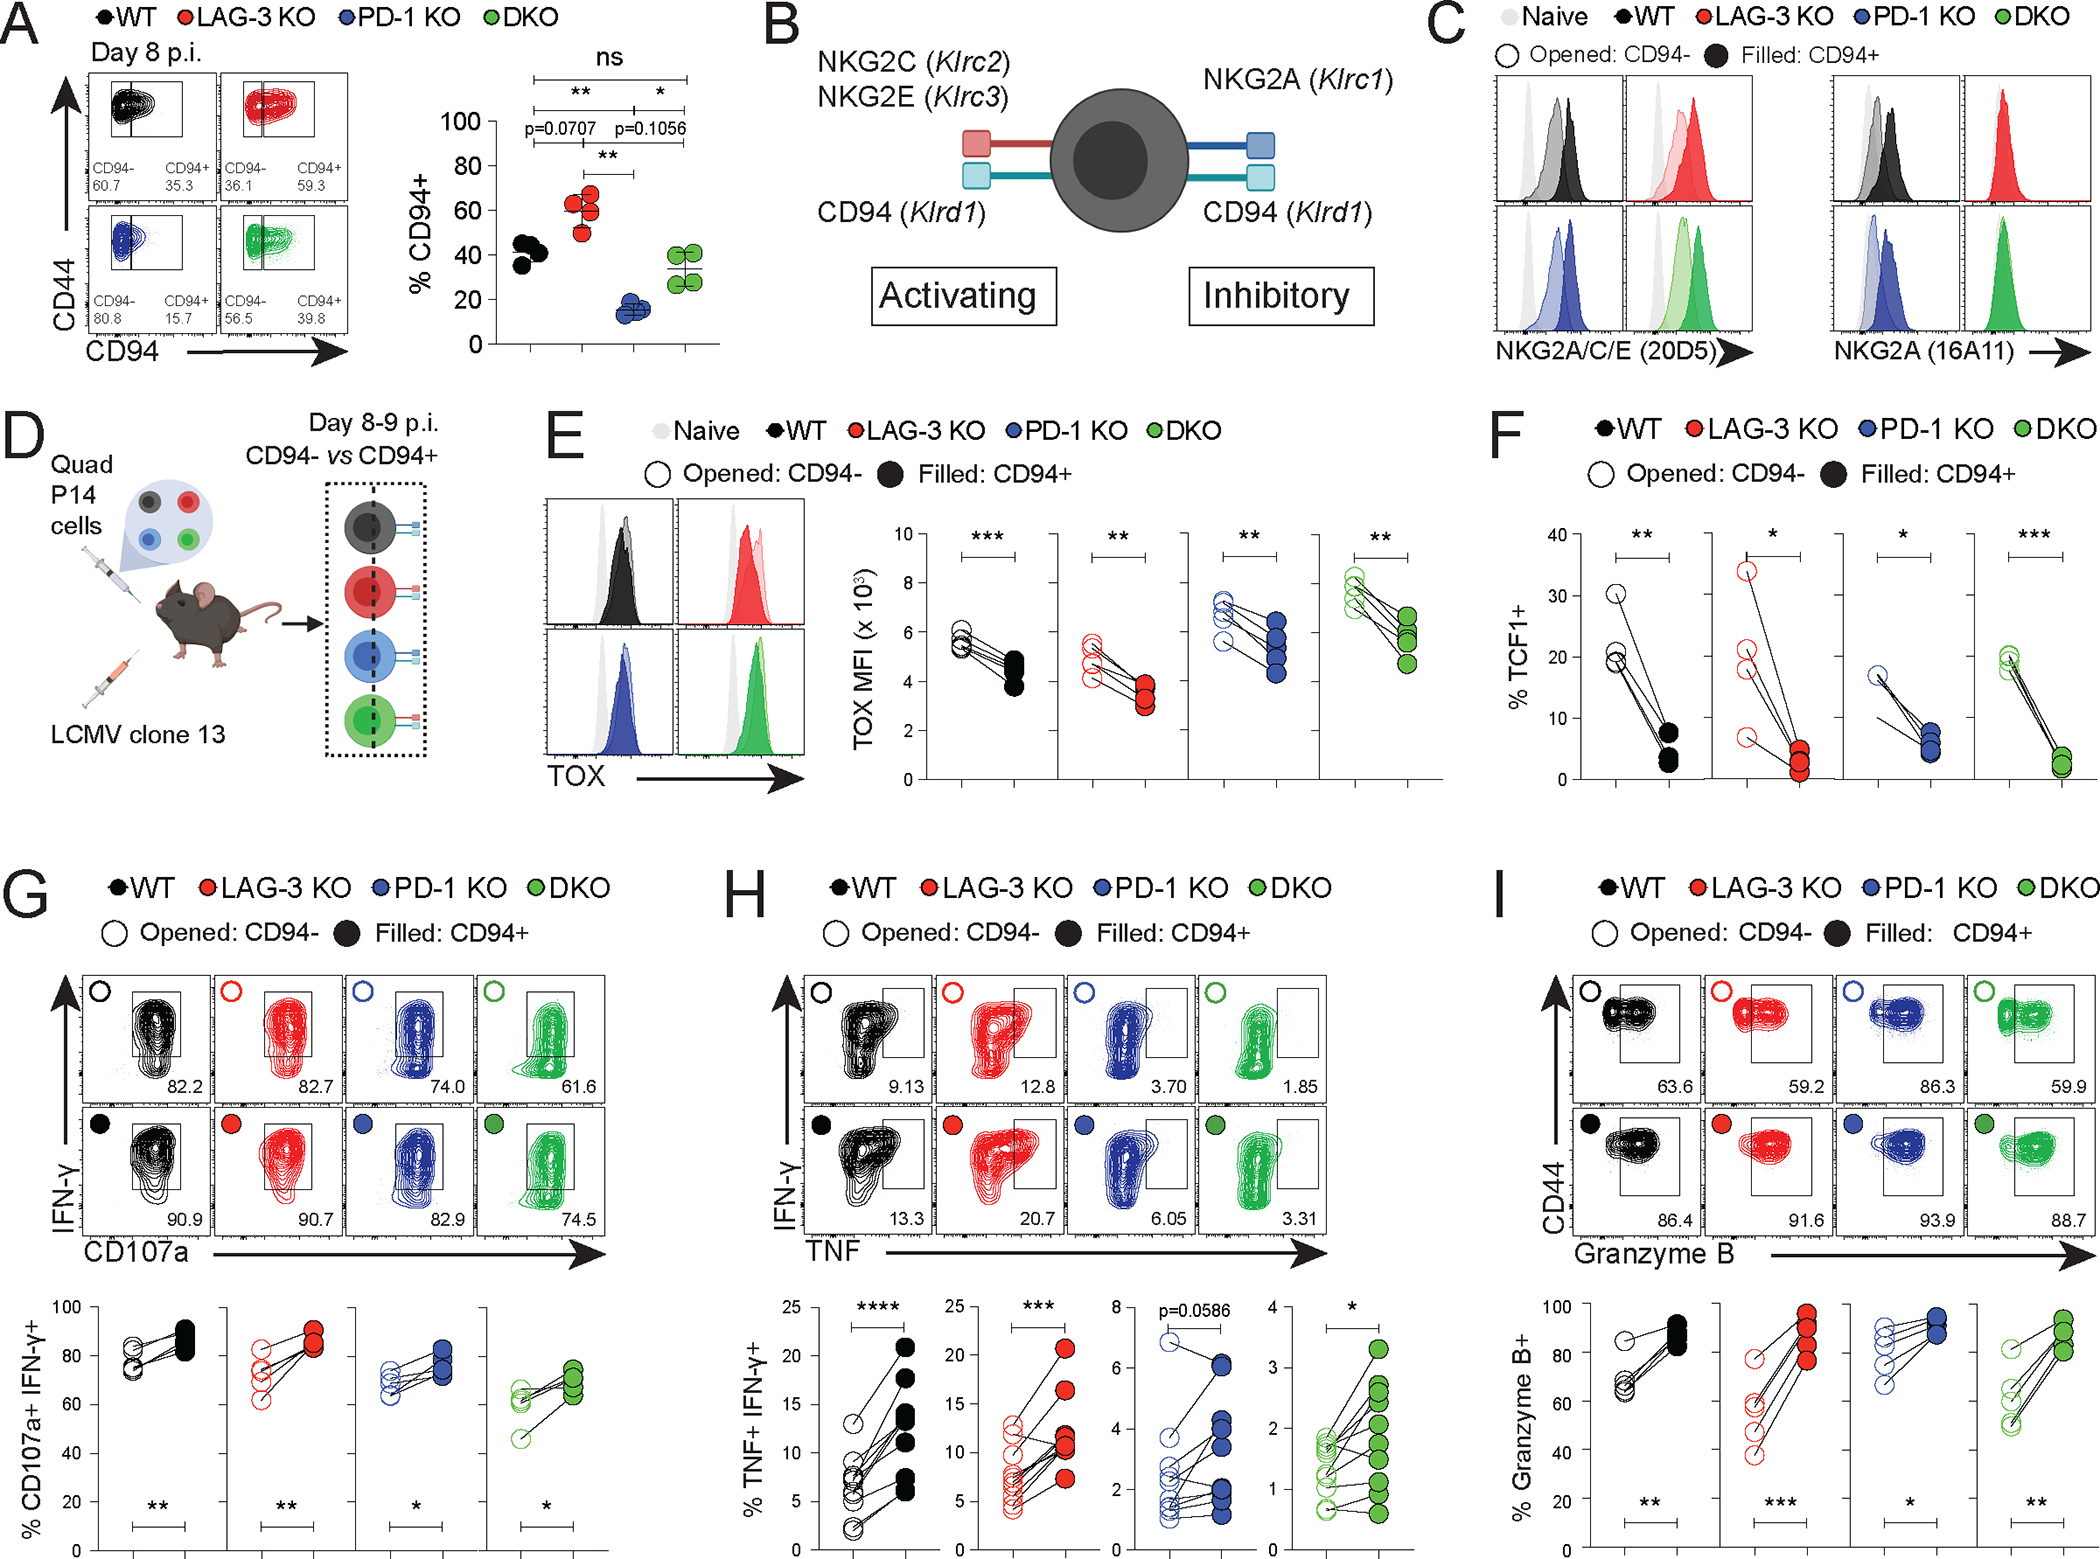
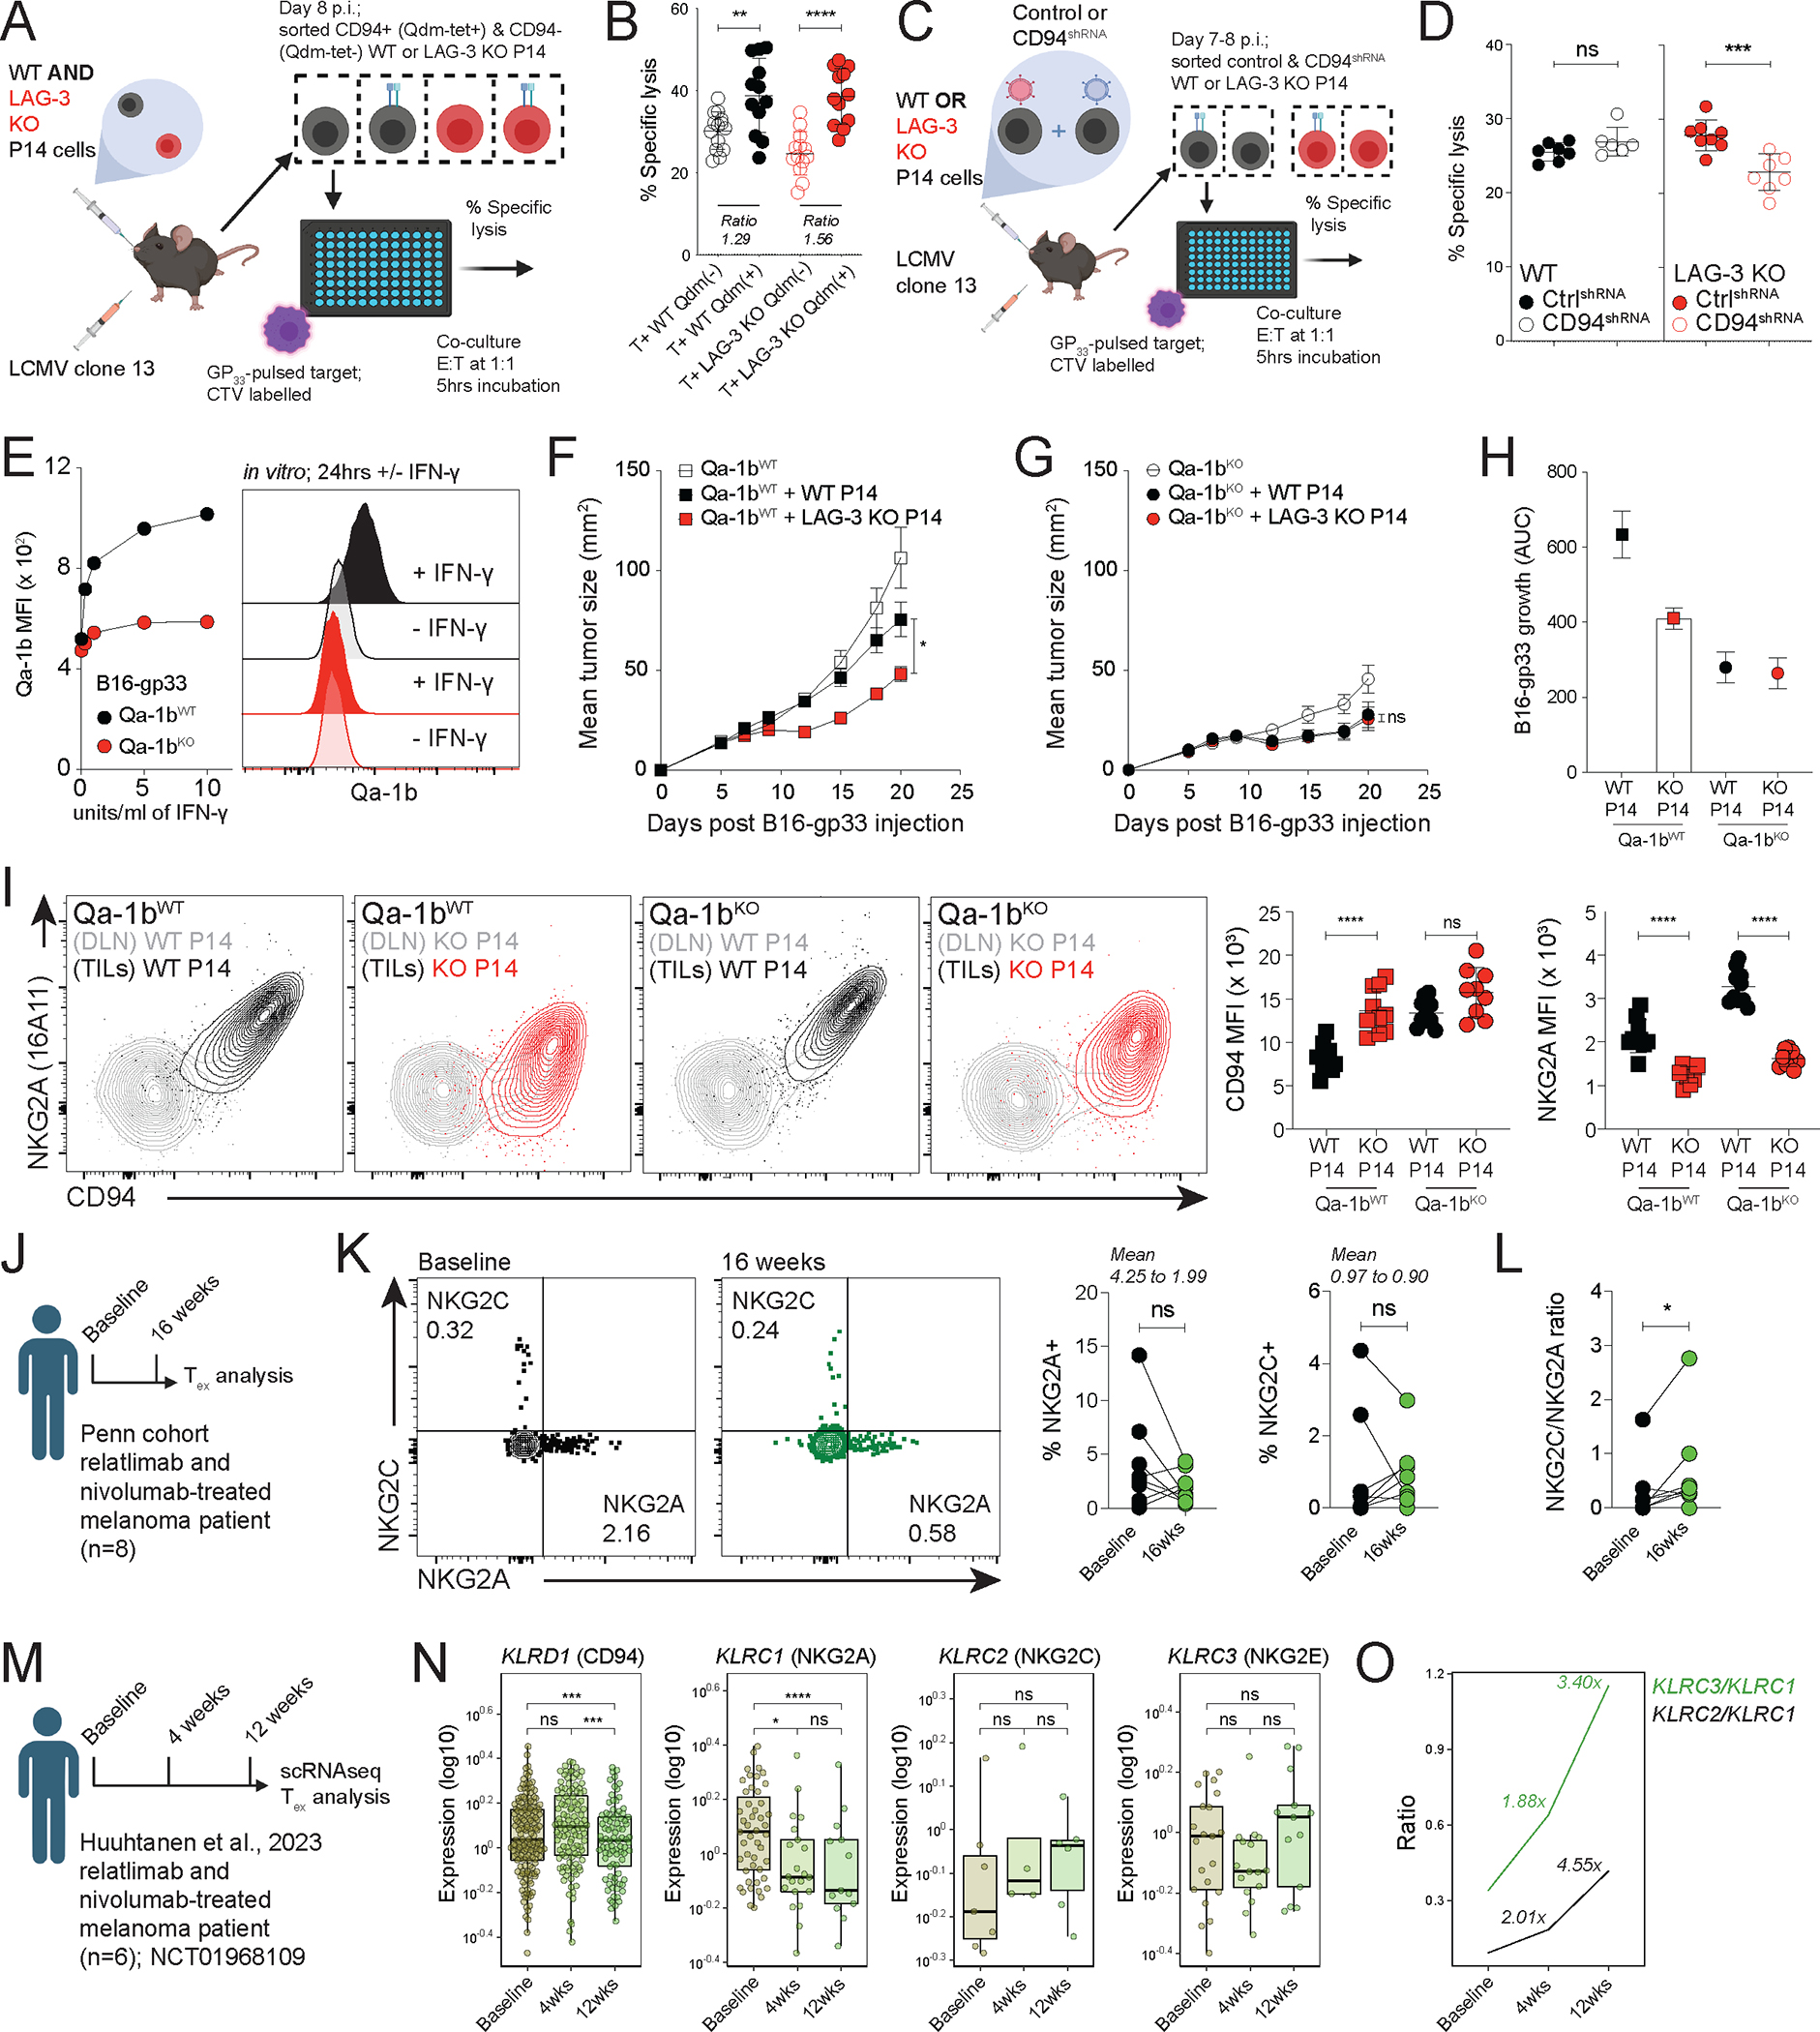
Exhausted CD8 T (Tex) cells in chronic viral infection and cancer have sustained co-expression of inhibitory receptors (IRs). Tex cells can be reinvigorated by blocking IRs, such as PD-1, but synergistic reinvigoration and enhanced disease control can be achieved by co-targeting multiple IRs including PD-1 and LAG-3. To dissect the molecular changes intrinsic when these IR pathways are disrupted, we investigated the impact of loss of PD-1 and/or LAG-3 on Tex cells during chronic infection. These analyses revealed distinct roles of PD-1 and LAG-3 in regulating Tex cell proliferation and effector functions, respectively. Moreover, these studies identified an essential role for LAG-3 in sustaining TOX and Tex cell durability as well as a LAG-3-dependent circuit that generated a CD94/NKG2+ subset of Tex cells with enhanced cytotoxicity mediated by recognition of the stress ligand Qa-1b, with similar observations in humans. These analyses disentangle the non-redundant mechanisms of PD-1 and LAG-3 and their synergy in regulating Tex cells.

Keywords: CD94; LAG-3; NKG2; NKG2A; PD-1; Qa-1b; T cell exhaustion; TOX; cancer; immunosurveillance.


Conflict of interest statement

Declaration of interests E.J.W. is a member of the Parker Institute for Cancer Immunotherapy which supported this study. E.J.W. is an advisor for Arsenal Bioscience, Coherus, Danger Bio, Janssen, New Limit, Marengo, Pluto Immunotherapeutics, Prox Biosciences, Related Sciences, Santa Ana Bio, and Synthekine. E.J.W. is a founder of and holds stock in Arsenal Biosciences. A.H.S. has patents/pending royalties on the PD-1 pathway from Roche and Novartis and has research funding from IOME, AbbVie, and Taiwan Bio. A.H.S. serves as an advisor for Selecta, Elpiscience, Monopteros, Bicara, Fibrogen, IOME, Bioentre, Corner Therapeutics, Alixia, GlaxoSmithKline, Amgen, and Janssen. D.A.A.V. has patents covering LAG-3, with others pending. D.A.A.V. is a co-founder and stockholder for Novasenta, Tizona, and Trishula; a stockholder for Oncorus and Werewolf; and has patents licensed to Bristol Myers Squibb (BMS) and Novasenta. D.A.A.V. is a scientific advisor for Tizona, Werewolf, F-Star, Bicara, Apeximmune, and T7/Imreg Bio and is a consultant for BMS, Incyte, Regeneron, Ono Pharma, Peptone, and Avidity Partners. D.A.A.V. receives research funding from BMS and Novasenta. O.K. holds stock in Arsenal Biosciences and is an employee of Orange Grove Bio. A.C.H. consults for Immunai and received research funding from BMS and Merck. J.R.G. consults for Arsenal Biosciences.

Figures

Figure 1:
Figure 1:. LAG-3 represses CD8 T cell effector functions, whereas PD-1 dampens proliferation during Tex development.
(A) Schematic for (B-G). (B) Representative flow cytometry plots and proportions of KLRG1+CD127− and CD127+KLRG1− Quad P14 cells d8 p.i. (C) Kinetics (mean ± SEM; left) and numbers (right) of Quad P14 cells in blood. (D) Numbers of Quad P14 cells in spleen. (E) Representative flow cytometry plots and proportion of Ki67+ Quad P14. (F-G) Representative flow cytometry plots, proportions, and numbers of CD107a+IFN-γ+ Quad P14 at (F) d8 and (G) d35 p.i. (H) Schematic for (I). (I) In vitro cytotoxicity of WT and KO P14 cells. (B, E, I) Representative of two experiments. (C) Data shown are pooled from three independent experiments. (D, F, G) Data shown are pooled of three (d8) or four (d35) independent experiments. (B-G, I) Dot represents individual mice/replicates. (B-G) P values calculated using paired one-way ANOVA with Tukey correction. (I) P values calculated using unpaired one-way ANOVA with Dunnett correction.
Figure 2:
Figure 2:. LAG-3 facilitates Tex differentiation and sustains TOX.
(A-B) Mean Fluorescent Intensity (MFI) of indicated IRs on P14 cells of the indicated genotypes. (C) MFI ratios of KO versus WT P14 cells of IRs shown in (A-B). (D) Representative flow cytometry plots and proportion of TBEThi and EOMEShi P14 cells of the indicated genotypes. (E) Representative flow cytometry plots, proportion, and numbers of TCF1+ Quad P14 cells. (F) Representative histograms and MFI of TOX for Quad P14 cells. (G) Schematic for (H-I). (H) TOX MFI of control and TOXOE for indicated WT and KO P14 cells at d8 p.i. (I) Proportions of control and TOXOE for WT versus KO P14 cells at d29 p.i. Grey histogram in (A-B, F): gated on CD44− naïve cells. [A-C, D(d8) F, H-I] Representative of two or more experiments. [D(d15), E] Data are pooled from two independent experiments. (D-F, H-I) Dot represent individual mice. (C) P values calculated using paired one-way ANOVA with Dunnett correction. (D-F) P values calculated using paired one-way ANOVA with Tukey correction. (H-I) P values calculated using two-tailed paired t-test.
Figure 3:
Figure 3:. LAG-3 regulates NK cytotoxic-like signature.
(A) Schematic. (B) PCA of RNA-seq data from Quad P14 cells with four biological replicates each. (C) DEGs of individual KO P14 cells compared to WT P14 cells. (D) GSEA of KO P14 cells to d8 LCMV Armstrong and cl13 geneset from. (E) Heatmap displaying top DEGs clustered using Pearson correlation. (F) Pathway enrichment analysis of KO P14 cells.
Figure 4:
Figure 4:. LAG-3 regulates the TOX/CD94 axis.
(A) Uniform Manifold Approximation and Projection (UMAP) of scRNA-seq dataset for P14 cells plotting previously described d8 LCMV Armstrong and cl13 clusters. (B) Projection of indicated KO P14 cell gene signatures [from Quad P14 cells, and] to UMAP from (A). (C) Expression of indicated genes in UMAP from (A). (D) Shared DEGs between LAG-3 KO and TOX KO P14 cells. (E) Schematic for (F-G). (F) Representative histograms and MFI of TOX for indicated P14 cells. (G) Representative histograms and proportions of CD94+ P14 cells. (H) Schematic for (I-K). Representative histograms of sorted Qdm-tet+ and Qdm-tet− WT P14 cells. (J) Representative flow cytometry plots and (K) numbers of P14 cells in mice previously transferred with sorted Qdm-tet+ and Qdm-tet− WT P14 cells. (L) Schematic for (M-N). (M) Knockdown efficiency of CD94 in WT and LAG-3 KO P14 cells at d29 p.i. (N) Representative flow cytometry plots and proportions of control and CD94shRNA of WT and LAG-3 KO P14 cells at d29 p.i.. Grey histogram in (F-G): gated on CD44− naïve cells. (E) Data are pooled from two independent experiments. (F) Data are pooled from three independent experiments. (I-K) Data are from one experiment. (M-N) Representative two or more experiments. (F-G, K, M-N) Dot represent individual mice. (F-G) P values calculated using paired one-way ANOVA with Tukey correction. (K) P values calculated using two-tailed unpaired t-test. (M, N) P values calculated using two-tailed paired t-test.
Figure 5:
Figure 5:. CD94/NKG2+ developing Tex display enhanced effector potential.
(A) Representative flow cytometry plots and proportion of CD94+ Quad P14. (B) Schematic of CD94/NKG2 receptor pairing. (C) Representative histograms for NKG2A/C/E and NKG2A expression by CD94+ and CD94− populations of the indicated Quad P14 cells. (D) Schematic for analysis in (E-I). (E) Representative histograms and MFI of TOX of indicated populations. (F) Proportion of TCF1+ cells for the indicated populations. (G-I) Representative flow cytometry plots and proportions of (G) CD107a+IFN-γ+, (H) TNF+IFN-γ+, and (I) Granzyme B+ of indicated populations. Grey histogram in (C, E): gated on CD44− naïve cells. (A, C, E-I) Representative two or more experiments. (A, E-I) Dot represent individual mice. (A) P values calculated using paired one-way ANOVA with Tukey correction. (E-I) P values calculated using two-tailed paired t-test.
Figure 6:
Figure 6:. The LAG-3 and CD94/NKG2 axis mediates Qa-1b-restricted immune surveillance.
(A) Schematic for (B). (B) In vitro cytotoxicity for the indicated WT and LAG-3 KO P14 cells. (C) Schematic for (D). (D) In vitro cytotoxicity of control and CD94shRNA versions of WT and LAG-3 KO P14 cells. (E) Qa-1b expression in Qa-1b-intact and Qa-1b-deficient B16-gp33 cells cultured with recombinant IFN-γ. Representative histograms of Qa-1b for indicated tumor cells. (F-G) Tumor growth for (F) Qa-1b-intact and (G) Qa-1b-deficient B16-gp33 cells, with adoptively transferred WT or LAG-3 KO P14 cells. (H) Summary of tumor growth from (F-G) by Area Under the Curve (AUC). (I) Representative flow cytometry plots and MFI of CD94 and NKG2A for the indicated P14 cell populations among tumor-infiltrating lymphocytes (TILs; black or red) or in draining lymph node (DLN; grey). (J) Schematic for (K-L). (K) Representative flow cytometry plots and proportions of NKG2A and NKG2C expressing Tex in patients at the indicated timepoints. (L) Ratio of NKG2C/NKG2A expression by Tex. (M) Schematic for (N-O). (N) Expression of KLRD1, KLRC1, KLRC2, and KLRC3 by Tex. (O) Ratio of KLRC2/KLRC1 and KLRC3/KLRC1 expression by Tex and fold change from baseline. (B) Data are pooled from three independent experiments. (D-H) Representative two experiments. (B, D) Dot represent replicates. (F-I) Mean of n=9–11 mice per group. (B, D) P values calculated using two-tailed unpaired t-test. (F-G, I) P values calculated using Mann-Whitney test. (K, L, N) P values calculated using Wilcoxon test.

References

    1. Wherry EJ (2011). T cell exhaustion. Nature Immunology 12, 492–499. 10.1038/ni.2035. - DOI - PubMed
    1. Wherry EJ, and Kurachi M (2015). Molecular and cellular insights into T cell exhaustion. Nature Reviews Immunology 15, 486–499. 10.1038/nri3862. - DOI - PMC - PubMed
    1. McLane LM, Abdel-Hakeem MS, and Wherry EJ (2019). CD8 T Cell Exhaustion During Chronic Viral Infection and Cancer. Annu Rev Immunol 37, 457–495. 10.1146/annurev-immunol-041015-055318. - DOI - PubMed
    1. Belk JA, Daniel B, and Satpathy AT (2022). Epigenetic regulation of T cell exhaustion. Nature Immunology 23, 848–860. 10.1038/s41590-022-01224-z. - DOI - PMC - PubMed
    1. Wherry EJ, Ha S-J, Kaech SM, Haining WN, Sarkar S, Kalia V, Subramaniam S, Blattman JN, Barber DL, and Ahmed R (2007). Molecular Signature of CD8+ T Cell Exhaustion during Chronic Viral Infection. Immunity 27, 670–684. 10.1016/j.immuni.2007.09.006. - DOI - PubMed

MeSH terms

Substances

LinkOut - more resources