. 2024 Sep 19;187(19):5393-5412.e30.
doi: 10.1016/j.cell.2024.07.019. Epub 2024 Aug 8.

Stress-sensitive neural circuits change the gut microbiome via duodenal glands

Affiliations

Stress-sensitive neural circuits change the gut microbiome via duodenal glands

Hao Chang et al. Cell. .

Abstract

Negative psychological states impact immunity by altering the gut microbiome. However, the relationship between brain states and microbiome composition remains unclear. We show that Brunner's glands in the duodenum couple stress-sensitive brain circuits to bacterial homeostasis. Brunner's glands mediated the enrichment of gut Lactobacillus species in response to vagus nerve stimulation. Cell-specific ablation of the glands markedly suppressed Lactobacilli counts and heightened vulnerability to infection. In the forebrain, we mapped a vagally mediated, polysynaptic circuit connecting the central nucleus of the amygdala to Brunner's glands. Chronic stress suppressed central amygdala activity and phenocopied the effects of gland lesions. Conversely, excitation of either the central amygdala or parasympathetic vagal neurons activated Brunner's glands and reversed the effects of stress on the gut microbiome and immunity. The findings revealed a tractable brain-body mechanism linking psychological states to host defense.

Keywords: amygdala; duodenal glands; gut microbiome; immune system; lactobacillus; microbiome; mucosal immunity; stress; vagus nerve.


Conflict of interest statement

Declaration of interests The authors declare no competing interests.

Figures

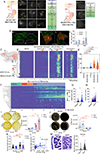
Figure 1.
Figure 1.. Vagal signals control the microbiome via the glands of Brunner
A. Left: Schematics of intravital BG imaging. Right: Calcium (GCamP6) transients with unchanging control (tdTomato) signals. Bar=100μm. B. Z-score heatmap showing robust calcium transients in BG after CCK. C. Calcium transient profile of a representative single gland. D. Maximum values (Z-scores) of calcium transient peaks. Each condition was defined as a 6 min-long timelapse stack. E. Percentage of glands activated under each condition. F. BG void scores under the saline vs. CCK conditions. G: As in panel B, but after subdiaphragmatic vagotomy. H: As in panel G, but after vagal sensory denervation. I. Maximum intensity projections of calcium transients in intact mice or after vagal lesions. Bar=100μm. J. Upper: Across-animals Z-score maximal values for all groups and conditions. Lower: equivalent for mean Z-score values. K. As in panel B. Calcium transients in the BG upon electrical stimulation of the left or right vagal nerve; VS1–4 =Vagal stimulation periods 1–4. L. Maximal calcium transient Z-scores upon electrical stimulation of the left or right vagal nerve. M. As in L for mean Z-scores. N. 7-day CCK treatment increased total Lactobacilli counts in small intestine, large intestine, and fecal, samples. O. Lactobacillus rhamnosus (ATCC 27773) counts in feces after a 7-day CCK treatment. Left: representative clones cultured in MRS plates; right: total clone count per 1-g sample/mouse, Bar=10mm. P. Left: Volcano plot comparing relative abundances of bacteria in the small intestine after 7-day CCK treatment. Cyan points represent downregulated and purple upregulated bacterial species. Right: Relative abundances of total Lactobacilli counts. Q. Same as P but for large intestine. R. 7-day CCK treatment failed to increase fecal Lactobacilli counts in BG-resected mice. S. Similar to R, but after oral inoculation with Lactobacillus rhamnosus (ATCC 27773). T. Relative abundances of total Lactobacilli after 7 days of CCK treatment in Sham- and BG-resected animals. U. 7-day CCK treatment failed to increase fecal Lactobacilli counts after vagal sensory denervation. V. Similar to U, but after oral inoculation with Lactobacillus rhamnosus (ATCC 27773). W. Relative abundances of total Lactobacilli counts after 7 days of CCK treatment in control mice and after vagal sensory denervation. X. Void scores after CCK injections in control mice and after vagal sensory denervation. All data are presented as mean ± SEM. See also Figure S1, Supplementary Movies 1 and 2.
Figure 2.
Figure 2.. Vagal efferents control Brunner’s glands
A. Left: Cholinergic innervation of BG by DMV neurons. Center and right: magnified view of selected regions. Pie plot: Percentage of BG vs. villus innervation. B. Percentage of innervated BG vs. goblet cells, the latter stained with Anti-Muc2. C. DMV synaptic endings localized on Brunner’s glands but not on overlying villi. Right: DMV synaptic endings on glands vs. villi. Data pooled from 5 mice. D. Upper: Histological cross-section through Tunica mucosa and Tela submucosa of the human duodenum. Brunner’s glands are visualized underneath the Lamina muscularis mucosae (black arrowhead), embedded in the connective tissue of the Tela submucosa. Bar=250μm. Lower: Neurites surrounding the human gland of Brunner. Bar=50μm. E. Single-cell transcriptomics of BG reveal Muc6 co-expression with the pro-secretory cholinergic receptor Chrm3. F. Simultaneous recordings of DMV single neuron activity and BG calcium transients. Top trace: single unit activity. Bar=40μV. G. DMV neuronal responses to CCK precede responses in BG. H. Opto-tagging recordings of ChAT+ DMV cells. Top trace: single neuron activity and laser pulses for cell type identification. I. Latencies for CCK-induced 50% of maximum activity in DMV neurons and BG. J. Left-Middle: Expression of an excitatory chemogenetic construct (red) in cholinergic DMV neurons (green). Right: DMV-specific ablation of cholinergic neurons. K. DMV activation (7-day CNO) increased fecal lactobacilli levels; 7-day CCK failed to increase lactobacilli levels after cholinergic DMV ablation. L. Counts of inoculated Lactobacillus rhamnosus (ATCC 27773) in feces after 7 days of CNO in mice expressing chemogenetic constructs (DMV-Gq) and after 7 days of CCK in DMV cholinergic-ablated mice (DMV-Casp). M. Relative abundances of total Lactobacilli after treatments. N. Distribution of BG void scores across groups. O. 7-day CCK failed to increase fecal Lactobacilli levels after cholinergic denervation of BG (Anti-Chat-SAP). P. Similar to O, but after the oral inoculation of Lactobacillus rhamnosus (ATCC 27773). Q. Relative abundances of total Lactobacilli. R. BG void scores Across groups. All data are presented as mean ± SEM. Bar=100μm. See also Figure S2.
Figure 3.
Figure 3.. Ablation of the glands of the Brunner leads to an immunodeficiency syndrome and to mortality upon intestinal infection
A. Strategy for cell-specific ablation of BG using diphtheria toxin (DTx) injections. B. Confocal microscopy visualization of ablation efficiency. Bar=500μm. C-D. Total number of glands/mm2 or GLP1R+ neurons/mm2 in the proximal duodenum. E-F. Normalized body weight (Left) and daily food intake (in gram, Right). G-H. Preferences of fiber-rich fatty pellets across groups. I-J. Neuronal activity levels (as indexed by Fos) in celiac ganglia (CG). Bar=200μm. K-L. Gastric distension across groups, with representative examples, Bar=1cm. M-N. Spleen morphology and germinal center sizes across groups, with representative examples, Bar=1cm (whole spleen) and =500μm (germinal center). Spleen weight indexes obtained by normalizing spleen weight to body weight (mg/g). O: Representative sections and total counts of spleen IgD+ B cells/mm2 between groups. Bar=100μm. P. Mean Ki67 fluorescent intensity (cell proliferation marker) in spleen. Q. Representative sections and zone sizes of spleen follicular dendritic cell (FDC) markers. Bar=100 μm. R. Representative sections and sizes of isolated colonic mucosal lymphoid follicles (M-ILFs) via PAS staining. Bar=100μm. S. Inoculation with the kanamycin-resistant E. coli strain EcAZ-2. T. Representative culture plates and fecal counts after inoculation with EcAZ-2. Bar=1cm. U. Survival curves following gut colonization with the pathogenic Staphylococcus xylosus (ATCC 29971), Log-rank test (Mantel-Cox), *p<0.0001. V. Blood cultures after three daily oral inoculations with S. xylosus (ATCC 29971). Bar=1cm. W. Spleen weight indexes (mg/g BW) after three daily oral inoculations of S. xylosus (ATCC 29971). X. Mortality after transplanting fecal samples from BG-DTx and BG-saline mice into C57BL/6J SPF mice after 7 days of treatment with an antibiotic cocktail (“Abx”). Log Rank (Mantel-Cox) *p<0.001. Y. As in X but for the spleen weight. Z. Preference indexes for probiotic solutions. All data are presented as mean ± SEM. See also Figure S3.
Figure 4.
Figure 4.. Probiotics and mucin restore immune functions and promote survival in animals lacking glands of Brunner
A. Brunner’s gland ablation combined with intra-cecal administration of [Lactobacillus+Bifidobacteria] probiotics. B. Neuronal (Fos) activity in celiac ganglia (CG). Bar=200μm. C. Spleen weights after probiotics. Left: Representative examples of whole spleens. Bar=1cm. Right: Spleen weight index. D. Germinal center sizes after probiotics. Left: Representative examples using HE-staining. Bar=200μm. Right: Same as C but for the germinal center size. E-F. B cell counts after probiotic exposure. E: Representative IgD immunostaining of spleen sections. Bar=100μm. F: Same as D but for IgD+ counts. G. Proliferation markers after probiotics. Same as in D but for the Ki67 signal. H. Follicular dendritic cell (FDC) light zones after probiotics. I. Size of mucosal colonic lymphoid follicles (M-ILFs) after probiotics. Bar=200μm. J. Probiotics (or saline) followed by oral inoculation with the pathogenic S. xylosus (ATCC 29971). K-L. Mortality after S. xylosus (ATCC 29971) infection (or control), log-rank test (Mantel-Cox), *p<0.001. M. Probiotic effects on E. coli proliferation after gavage of EcAZ-2. N. Brunner’s gland ablation combined with oral administration of mucin. O. CG Fos expression after mucin. Bar=200μm. P. As in C, but for mucin. Bar=1cm. Q. Same as P but for germinal center sizes. R. Same as P but for IgD+ counts. S. Similar to P but showing the Ki67 proliferation marker signal. T. Similar to P but showing follicular dendritic cell (FDC) light zones in the spleen. U. Same as in P but for colonic mucosal isolated lymphoid follicles (M-ILFs). Bar=200μm. V. Lactobacilli CFU counts across groups after mucin. W-Z. mucin ingestion rescues immunological function in mice lacking Brunner’s glands. W: Schematics of Brunner’s gland-ablated mice combined with 10% mucin in drinking water (3d), followed by 7 days of daily gavage with the pathogen S. xylosus (ATCC 29971) (combined with continued mucin availability). X-Y: As in K-L, for mucin ingestion, *p<0.001. Z. As in M for mucin ingestion. All data are presented as mean ± SEM. See also Figure S4.
Figure 5.
Figure 5.. Immune and metabolomics signatures are rescued by probiotic treatment in animals lacking the glands of Brunner
A: Relative abundance of B cells among the total pool of live CD45+ cells in mesenteric lymph node, spleen, and bone marrow samples from the experimental groups. The detailed gating strategy is shown in Figure S5A. B. B cell counts in mesenteric lymph nodes. C. Relative abundance of immature B cells from the total pool of CD45+ cells in mesenteric lymph nodes, spleen, and bone marrow. D. As in C, but for mature B cells. E. As in C, but for macrophages. F. As in C, but for natural killer (NK) cells. G. Similar to C, but for neutrophil cells. H. Similar to C, but for monocytes. I. As in C, but for dendritic cells (DCs). J. Unsupervised clustering of proteomic analyses of blood samples from the three treatment groups. K. Volcano plots of blood proteomics profiles following BG ablation. L-M. Volcano plots of blood proteomics profiles following BG ablation with probiotic administration. N. Cytokine profile following BG ablation with probiotic administration. O-S. Levels of five inflammation-related cytokines, Il1a (O), Cxcl1 (P), Cxcl9 (Q), Tnfsf12 (R), and Ccl3 (S), following BG ablation with probiotics administration. T-V. Metabolomics analysis of blood samples after BG ablation with probiotic administration. All data are presented as mean ± SEM. See also Figure S5 and Supplementary Table 2.
Figure 6.
Figure 6.. Central nucleus of the amygdala controls the intestinal microbiome via modulation Brunners glands secretion.
A. Injection of a retrograde, cell-specific polysynaptic pseudorabies (PRV) strain into the duodenal submucosa resulted in dense labeling in well-defined subcortical regions (Left), including the DMV and central nucleus of the amygdala (CeA). Most labeling, including DMV and CeA, was absent when tracing was performed after subdiaphragmatic vagotomy (Right). Bars=100μm. B. Similar injections into CeA instead labeled Nucleus Tractus Solitarius (NTS) (a), Left (b), and Right NG (c). (d) Counts of Cckar+ and PRV+ neurons in left vs. right nodose ganglia. Bars=100μm. C-D. Z-score heatmap showing BG calcium transients in response to electrical stimulation of CeA in combination with a subthreshold dose of CCK. E. Maximal Z-scores of calcium transients under different experimental conditions (300 glands analyzed from 3 mice). F-H. BG calcium transients in response to chemogenetic activation of CeA. F. Z-score heatmap showing BG calcium transients in response to chemogenetic stimulation of CeA. G-H. Maximum Z-score values for each BG. I. Lactobacilli CFU counts across experimental conditions. Bar=1cm. J. Effects of CeA stimulation and CeA stimulation + CCKlow on EcAZ-2 oral inoculation Bar=1cm. K. Spleen germinal center size after CeA chemogenetic stimulation. L. Significant linear association between Lactobacilli CFU counts and spleen germinal center sizes across conditions (n=56), Pearson *p<0.0001. M. BG mucin exhaustion after CeA activation. Left: Representative examples of BG in chemogenetic mice and controls. Bar=100μm. Right: Distribution of BG void scores in chemogenetic mice and controls. All data are presented as mean ± SEM. See also Figure S6 and Supplementary Movie 3.
Figure 7.
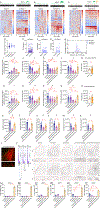
Figure 7.. Amygdalo-vagal-glandular circuits are inhibited by chronic stress and mediate stress-induced altered intestinal microbiome and immunodeficiency.
A-C. Bars=40μV. A. Top: representative traces of single CeA cell activity. Bottom: heatmap showing the Z-transform of the time-binned firing frequency of 126 CeA neurons calculated with respect to baseline under the no-stress condition. B. As in A for 110 CeA neurons calculated with respect to baseline under acute stress condition. C. As in A for 131 CeA neurons, calculated with respect to baseline under chronic stress conditions. D. Z-score values of cells under both acute and chronic stress conditions compared with the no-stress. E. Firing frequencies of 126 CeA neurons in the no stress condition compared with baseline. F. Firing frequencies of 110 CeA neurons under acute stress compared to baseline. G. As in F for 131 CeA neurons under chronic stress condition. H. Histograms of firing frequencies (Log2), representing fold changes compared with baseline. I. Lactobacilli CFU counts in fecal samples from experimental groups and conditions, i.e., no stress, acute stress, chronic stress, CeA chemogenetic inhibition (CeA-Gi+CNOip), and CeA chemogenetic activation + chronic stress (CeA-Gq+CNOip+chronic stress) mice. J. EcAZ-2 proliferation in male mice in experimental groups and conditions. K. Translocation of orally delivered pathogenic S. xylosus (ATCC 29971) into the systemic circulation in male mice of different experimental groups and conditions. L-M. Spleen characteristics of male mice in different experimental groups and conditions. L. Spleen sizes of male mice in different experimental groups and conditions. M. Spleen germinal center sizes of male mice in the experimental groups and under different conditions. N. BG void scores of the experimental groups and conditions. O. As in I, but for female mice. P. As in J, but so for female mice. Q. As in K, but for female mice. R-S. As in L-M but for female mice. T. As in N, but so for female mice. U. Lactobacilli counts after maternal separation in male pups. V. Lactobacilli CFU counts in the fecal samples of chronically stressed male mice sustaining chemogenetic activation of DMV. W. EcAZ-2 proliferation in chronically stressed male mice sustaining chemogenetic activation of DMV. X. Translocation of pathogenic bacteria into systemic circulation in chronically stressed male mice sustaining chemogenetic activation of DMV. Y-Z. Altered spleen characteristics in male mice. Y. Spleen sizes of chronically stressed male mice that sustain the chemogenetic activation of DMV. Z. Spleen germinal center sizes in chronically stressed male mice that sustain chemogenetic activation of DMV. AA. BG void scores from chronically stressed male mice that sustain chemogenetic activation of DMV. BB. As in U, but so for female mice. CC. As in V but for female mice. DD. As in W, but for female mice. EE. As in X, but so for female mice. FF. As in Y, but for female mice. GG. As in Z, but so for female mice. HH. As in AA, but so for female mice. All data are presented as mean ± SEM. See also Figure S7.

References

    1. Ley RE, Peterson DA, and Gordon JI (2006). Ecological and evolutionary forces shaping microbial diversity in the human intestine. Cell 124, 837–848. 10.1016/j.cell.2006.02.017. - DOI - PubMed
    1. Ley RE, Lozupone CA, Hamady M, Knight R, and Gordon JI (2008). Worlds within worlds: evolution of the vertebrate gut microbiota. Nat Rev Microbiol 6, 776–788. 10.1038/nrmicro1978. - DOI - PMC - PubMed
    1. Cryan JF, and Dinan TG (2012). Mind-altering microorganisms: the impact of the gut microbiota on brain and behaviour. Nat Rev Neurosci 13, 701–712. 10.1038/nrn3346. - DOI - PubMed
    1. Thaiss CA, Zmora N, Levy M, and Elinav E (2016). The microbiome and innate immunity. Nature 535, 65–74. 10.1038/nature18847. - DOI - PubMed
    1. Khosravi A, Yanez A, Price JG, Chow A, Merad M, Goodridge HS, and Mazmanian SK (2014). Gut microbiota promote hematopoiesis to control bacterial infection. Cell Host Microbe 15, 374–381. 10.1016/j.chom.2014.02.006. - DOI - PMC - PubMed

LinkOut - more resources