. 2024 Aug 20;5(8):101680.
doi: 10.1016/j.xcrm.2024.101680. Epub 2024 Aug 8.

A glia-enriched stem cell 3D model of the human brain mimics the glial-immune neurodegenerative phenotypes of multiple sclerosis

Affiliations

A glia-enriched stem cell 3D model of the human brain mimics the glial-immune neurodegenerative phenotypes of multiple sclerosis

Francesca Fagiani et al. Cell Rep Med. .

Abstract

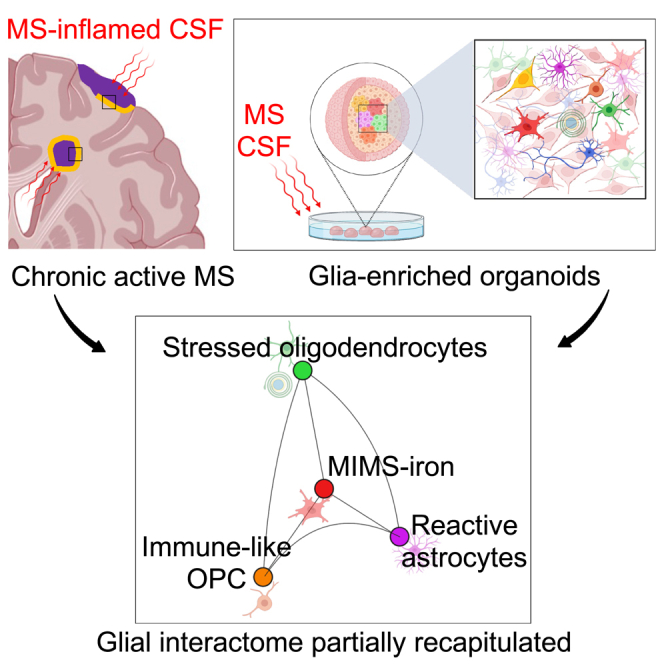
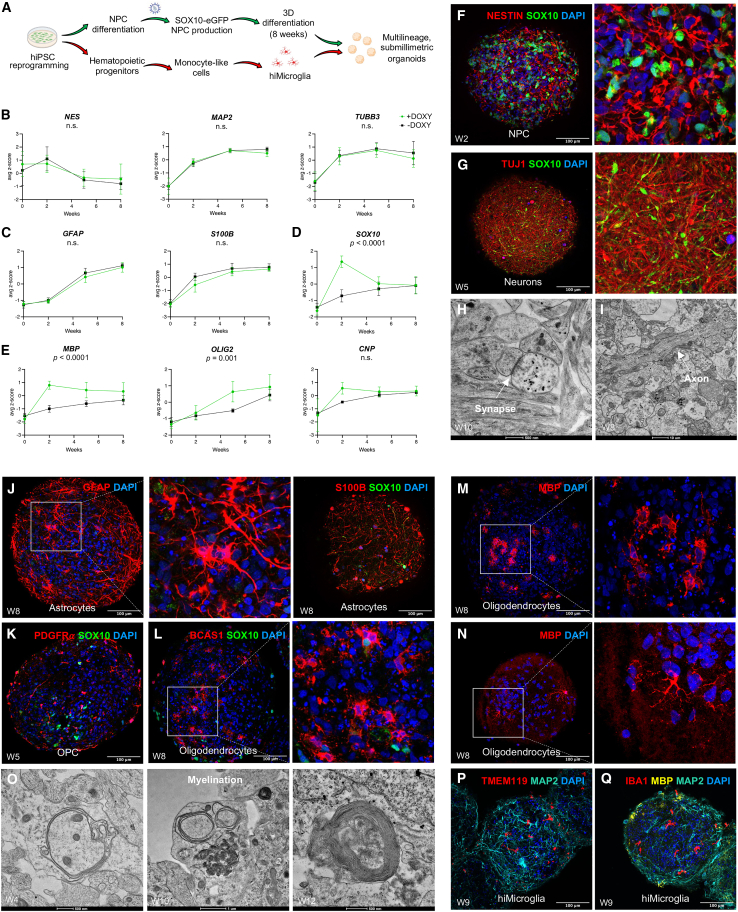
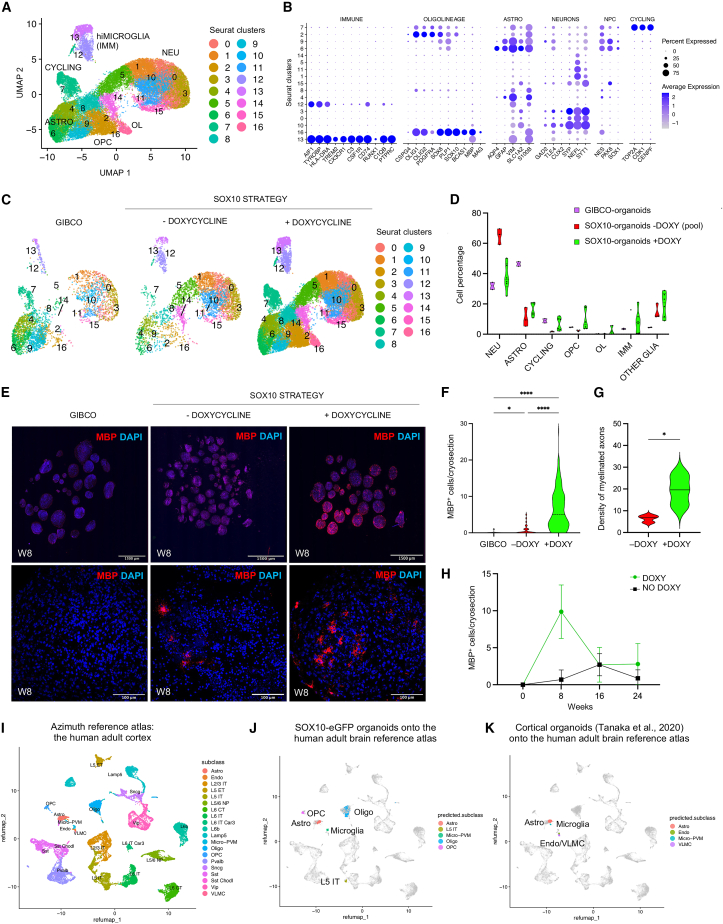
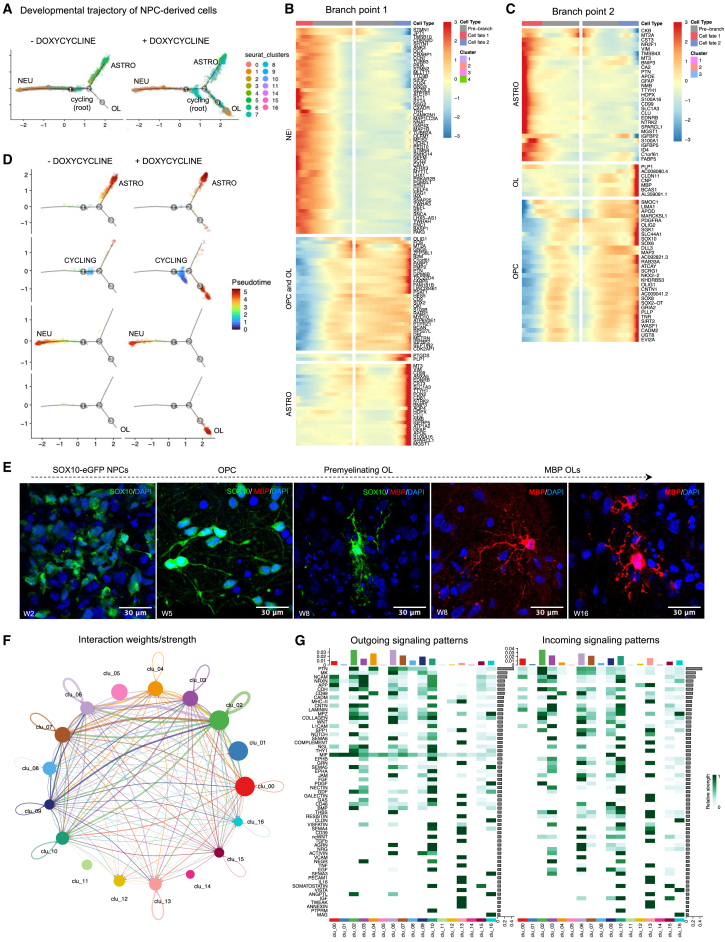
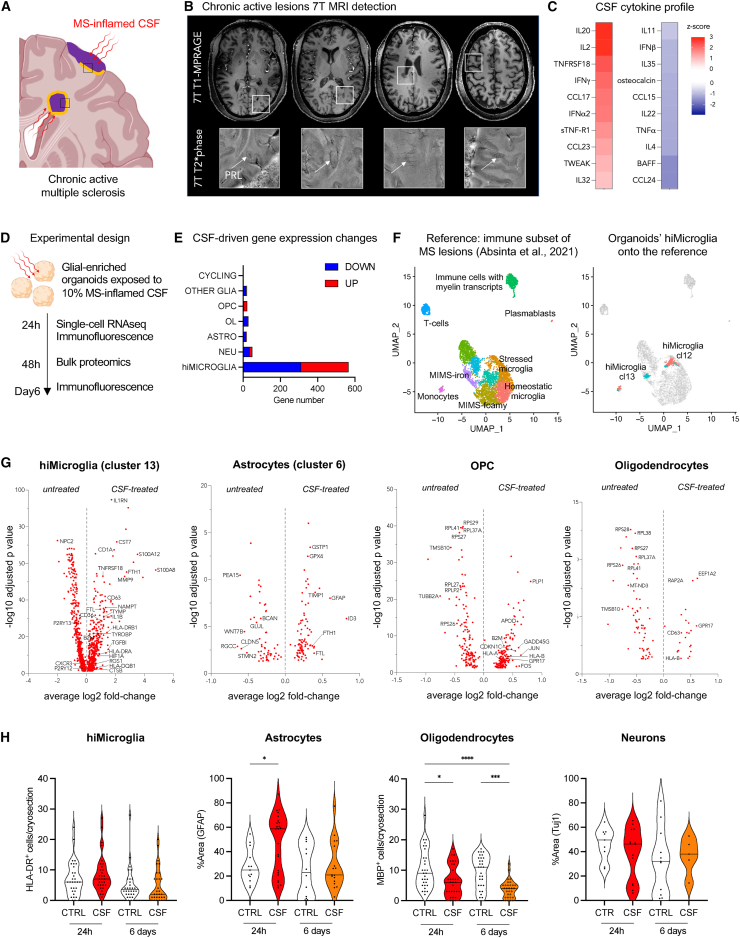
The role of central nervous system (CNS) glia in sustaining self-autonomous inflammation and driving clinical progression in multiple sclerosis (MS) is gaining scientific interest. We applied a single transcription factor (SOX10)-based protocol to accelerate oligodendrocyte differentiation from human induced pluripotent stem cell (hiPSC)-derived neural precursor cells, generating self-organizing forebrain organoids. These organoids include neurons, astrocytes, oligodendroglia, and hiPSC-derived microglia to achieve immunocompetence. Over 8 weeks, organoids reproducibly generated mature CNS cell types, exhibiting single-cell transcriptional profiles similar to the adult human brain. Exposed to inflamed cerebrospinal fluid (CSF) from patients with MS, organoids properly mimic macroglia-microglia neurodegenerative phenotypes and intercellular communication seen in chronic active MS. Oligodendrocyte vulnerability emerged by day 6 post-MS-CSF exposure, with nearly 50% reduction. Temporally resolved organoid data support and expand on the role of soluble CSF mediators in sustaining downstream events leading to oligodendrocyte death and inflammatory neurodegeneration. Such findings support the implementation of this organoid model for drug screening to halt inflammatory neurodegeneration.

Keywords: SOX10; brain organoids; glia-microglia axis; hiPSC; multiple sclerosis; neuroinflammation; oligodendrocytes; single-cell genomics.


Conflict of interest statement

Declaration of interests D.S.R.: research funding from Abata Therapeutics and Sanofi-Genzyme. P.A.C.: research funding from Genentech and previously Principia; consulting honoraria for serving on SABs for NervGen, Idorsia, Biogen, Vaccitech, and Lilly. L.S.: original organoid model(6) is under a patent by Johns Hopkins University, which is licensed to AxoSim, New Orleans, US; she consults for AxoSim. M.A.: consultancy fees from GSK, Sanofi, Biogen, Immunic Therapeutics, and Abata Therapeutics.

Figures

None
Graphical abstract
Figure 1
Figure 1
SOX10 transcription factor accelerates oligodendrogenesis in hiPSC-derived organoids (A) Schematic representation of the protocol for generating submillimetric organoids and integrating hiPSC-derived microglia. (B–E) Gene expression (normalized to GAPDH) of NES, TUBB3, MAP2, GFAP, S100B, SOX10, MBP, OLIG2, and CNP in SOX10-eGFP organoids—exposed and not exposed to doxycycline for inducing SOX10 expression—at 2, 5, and 8 weeks of differentiation, as determined by real-time qPCR (mixed effect analysis, followed by multiple comparison test) (for doxycycline-treated organoids: RNA samples each consisting of ∼150 organoids from 5 hiPSC lines from 2 differentiation experiments; for doxycycline-untreated organoids: RNA samples each consisting of ∼150 organoids from 5 hiPSC lines from 1 differentiation experiment). Data are represented as average Z score ± SD. (F) Immunostaining of Nestin+ and SOX10+ cells in doxycycline-treated organoids after 2 weeks of differentiation (magnification, 30X). (G) Immunostaining of Tuj1+ and SOX10+ cells in doxycycline-treated organoids after 5 weeks of differentiation (magnification, 30X). (H) Electron microscopy images of doxycycline-treated organoids after 10 weeks of differentiation showing a synaptic junction containing vesicles (white arrowhead). (I) Electron microscopy images of doxycycline-treated organoids after 8 weeks of differentiation showing axonal projections (white arrowhead). (J) Immunostaining of GFAP+ (30X) and S100B+ cells (30X) in cryosections from 8-week-old doxycycline-treated organoids. (K) Immunostaining of PDGFRα+ and SOX10+ cells in cryosections from 5-week-old doxycycline-treated organoids (30X). (L) Immunostaining of BCAS1+ and SOX10+ cells in cryosections from 8-week-old doxycycline-treated organoids (30X). (M and N) Immunostaining of MBP+ cells in cryosections from 8-week-old doxycycline-treated organoids (30X). (O) Electron microscopy images of organoids showing myelination at different time points (additional examples in Figure S2C). (P) Immunolabeling of TMEM119+ cells and MAP2+ in cryosections from 9-week-old organoids (30X). (Q) Immunolabeling of IBA1+ cells, MBP+, and MAP2+ cells in cryosections from 9-week-old organoids (30X). Abbreviations: NPC, neural precursor cells.
Figure 2
Figure 2
Single-cell RNA sequencing (scRNA-seq) unraveled the cellular diversity of organoids, recapitulating the cell diversity of the human adult cortex (A) scRNA-seq clustering of 29,319 cells, labeled based on known lineage markers and visualized as UMAP plot, from 8-week-old organoids deriving from SOX10-eGFP-expressing NPCs that were exposed to doxycycline for 2 weeks to promote SOX10 induction. Each dot corresponds to a single cell and each color to a cell cluster. (B) Dot plot depicting selected differentially expressed genes for each cluster and associated cluster labeling. Dot size corresponds to the percentage of cells expressing the gene in each cluster, and the color represents the average expression level. (C) scRNA-seq UMAP clustering from organoids produced based on the Gibco protocol (n = 3,660 cells) and SOX10 strategy, exposed (n = 21,380 cells) and not exposed to doxycycline (n = 4,279 cells), at 8 weeks of differentiation. (D) Violin plot showing the percentages of different cell populations by protocol. (E) Immunostaining of MBP+ cells in 15-μm-thick cryosections containing multiple 8-week-old organoids produced based on the commercially available Gibco protocol vs. our SOX10 strategy both exposed and not exposed to doxycycline (top row: 10X; bottom row [magnified view of one organoid]: 30X). (F) Quantification of branched MBP+ cells in cryosections (estimated cryosection area = 0.2 μm2) from 8-week-old organoids produced based on the different differentiation protocols (n = 6 samples, each consisting of 30 cryosections derived from 5 hiPSC lines). (G) Quantitative analysis of myelinated axons/1,000 μm2 area for doxycycline-stimulated organoids vs. doxy-minus organoids (n = 3). (H) Quantification of branched MBP+ cells in cryosections from organoids at 8, 16, and 24 weeks of differentiation (30 cryosections for each time point from 1 hiPSC line). (I) Reference atlas of the adult human primary motor cortex from cases without neurological disease (Azimuth). (J) Mapping of 3D organoids single-cell data (color-coded) onto a reference atlas of the adult human primary motor cortex (gray dots, H). (K) Mapping of single-cell transcriptome profiles of human cortical organoids from eight different protocols collected from public resources (differentiation range ∼60/70 days) (dataset metanalysis available in Tanaka et al.14) on the reference atlas of the adult human primary motor cortex (gray dots, H). Abbreviations are as follows: NEU, neurons; ASTRO, astrocytes; OPC, oligodendrocyte precursor cells; OL, oligodendrocytes; NPC, neural precursor cells; hiMICROGLIA (IMM), myeloid immune cells (hiPSC-derived microglia); OTHER GLIA, immature astrocytes; + DOXY, doxycycline-treated; − DOXY, not treated with doxycycline; Micro-PVM, microglia-perivascular macrophages; Endo, endothelia; and VLMC, vascular and leptomeningeal cells.
Figure 3
Figure 3
Pseudotime trajectory of the differentiation paths for NPC-derived cells and cell-to-cell communication patterns (A) Pseudotime trajectory analysis of NPC-derived neuronal, astrocyte, and oligolineage cells, colored by Seurat cell cluster for doxycycline-untreated vs. treated organoids. (B and C) Hierarchical clustered heatmap depicting genes whose expression patterns covary across pseudotime (Z scores normalized by row) at branchpoints 1 and 2, respectively, for doxycycline-stimulated organoids. (D) Pseudotime trajectory analysis of selected NPC-derived neuronal (NEU) (cluster 3 and 10), astrocyte (ASTRO) (cluster 4 and 6), and OL (cluster 16), showing the high degree of their maturation, and cycling cells (CYCLING) (cluster 7), colored by pseudotime, for doxycycline-untreated vs. treated organoids. (E) Immunostaining of SOX10+ and MBP+ cells in cryosections at 2, 5, 8, and 16 weeks of differentiation in doxycycline-exposed SOX10-eGFP organoids (scale bar: 30 μm). (F) Circle plot representing cellular communication among the different clusters in organoids using CellChat. Circle sizes are proportional to the number of cells in each cell group and edge width represents the communication probability. (G) Heatmap showing detailed communication through individual pathways and providing insights into the autocrine- vs. paracrine-acting pathways for each cell type using CellChat.
Figure 4
Figure 4
In response to inflamed CSF, organoids mimic macroglia-microglia phenotypes in chronic active MS (A) Schematic of MS brain pathology with chronic active lesions (with their inflammatory edge in orange), cortical lesions, and MS-inflamed CSF. (B and C) Representative case with both in vivo 7T MRI and CSF inflammatory profile: 54-year-old woman with relapsing MS, untreated at the time of lumbar puncture. The MRI shows 4 chronic active MS lesions seen by their paramagnetic rims (arrows, magnified views) on susceptibility-based images (B). Heatmap showing the Z scores of CSF-cytokines concentration relative to the CSF of the other 74 untreated MS cases (C). (D) Schematic of the experimental design: exposure of organoids to 10% patient-derived CSF supernatant (devoid of lymphocytes and monocytes) and processing for scRNA-seq, immunostaining, and bulk proteomics at different time points. (E) Bar plot of counts of significant differentially expressed genes (average log2 fold change > 0.5; p adjusted < 0.05, upregulated in red and downregulated in blue) between 24-h CSF-exposed vs. untreated organoids by cell cluster. (F) Reference atlas based on the re-analysis of immune subclustering of chronic active MS lesions in the study by Absinta et al. (on the left) and mapping of organoids scRNA-seq data onto the MS immune subset reference (on the right). (G) Volcano plots report gene expression changes in untreated vs. 24-h CSF-stimulated SOX10-eGFP organoids for each glial cell population (p adjusted < 0.05). (H) Violin plots showing the quantification of main cell populations in CSF-treated (“CSF”) vs. untreated (“CTRL”) organoids at different time points (ANOVA test [Tukey’s multiple comparison test ∗p < 0.05, ∗∗p < 0.01, ∗∗∗p < 0.001, ∗∗∗∗p < 0.0001]). Abbreviations are as follows: MS, multiple sclerosis; CSF, cerebrospinal fluid; NEU, neurons; ASTRO, astrocytes; OPC, oligodendrocyte precursor cells; OL, oligodendrocytes; hiMICROGLIA, hiPSC-derived microglia; OTHER GLIA, immature astrocytes; MIMS, microglia inflamed in MS; and AIMS, astrocytes inflamed in MS.

Update of

References

    1. Reich D.S., Lucchinetti C.F., Calabresi P.A. Multiple Sclerosis. N. Engl. J. Med. 2018;378:169–180. doi: 10.1056/NEJMra1401483. - DOI - PMC - PubMed
    1. Kuhlmann T., Moccia M., Coetzee T., Cohen J.A., Correale J., Graves J., Marrie R.A., Montalban X., Yong V.W., Thompson A.J., et al. Multiple sclerosis progression: time for a new mechanism-driven framework. Lancet Neurol. 2023;22:78–88. doi: 10.1016/S1474-4422(22)00289-7. - DOI - PMC - PubMed
    1. Absinta M., Maric D., Gharagozloo M., Garton T., Smith M.D., Jin J., Fitzgerald K.C., Song A., Liu P., Lin J.-P., et al. A lymphocyte-microglia-astrocyte axis in chronic active multiple sclerosis. Nature. 2021;597:709–714. doi: 10.1038/s41586-021-03892-7. - DOI - PMC - PubMed
    1. Pașca S.P., Arlotta P., Bateup H.S., Camp J.G., Cappello S., Gage F.H., Knoblich J.A., Kriegstein A.R., Lancaster M.A., Ming G.-L., et al. A nomenclature consensus for nervous system organoids and assembloids. Nature. 2022;609:907–910. doi: 10.1038/s41586-022-05219-6. - DOI - PMC - PubMed
    1. Absinta M., Sati P., Masuzzo F., Nair G., Sethi V., Kolb H., Ohayon J., Wu T., Cortese I.C.M., Reich D.S. Association of Chronic Active Multiple Sclerosis Lesions With Disability In Vivo. JAMA Neurol. 2019;76:1474–1483. doi: 10.1001/jamaneurol.2019.2399. - DOI - PMC - PubMed

MeSH terms