. 2024 Oct:34:194-209.
doi: 10.1016/j.jtos.2024.08.005. Epub 2024 Aug 8.

The effects of age and dysfunction on meibomian gland population dynamics

Affiliations

The effects of age and dysfunction on meibomian gland population dynamics

Julie Wiedemann et al. Ocul Surf. 2024 Oct.

Abstract

Purpose: While meibomian gland dysfunction (MGD) is widely recognized as a major cause of evaporative dry eye disease, little is known about normal gland differentiation and lipid synthesis or the mechanism underlying gland atrophy and abnormal lipid secretion. The purpose of this study was to use single-cell and spatial transcriptomics to probe changes in cell composition, differentiation, and gene expression associated with two murine models of MGD: age-related gland atrophy in wild-type mice and altered meibum quality in acyl-CoA wax alcohol acyltransferase 2 (Awat2) knockout (KO) mice.

Methods: Young (6 month) and old (22 month) wild type, C57Bl/6 mice and young (3 month) and old (13 month) Awat2 KO mice were used in these studies. For single-cell analysis, the tarsal plate was dissected from the upper and lower eyelids, and single cells isolated and submitted to the UCI Genomic Core, while for the spatial analysis frozen tissue sections were shipped to Resolve Biosciences on dry ice and sections probed in duplicate using a meibomian gland specific, 100 gene Molecular Chartography panel.

Results: Analysis of gene expression patterns identified the stratified expression of lipogenic genes during meibocyte differentiation, which may control the progressive synthesis of meibum lipids; an age-related decrease in meibocytes; and increased immune cell infiltration. Additionally, we detected unique immune cell populations in the Awat2 KO mouse suggesting activation of psoriasis-like, inflammatory pathways perhaps caused by ductal dilation and hyperplasia.

Conclusion: Together these findings support novel mechanism controlling gland function and dysfunction.

Keywords: Age-related meibomian gland dysfunction; Awat2 knockout mouse; Meibomian gland; Single cell RNA sequencing; Spatial transcriptomics.


Conflict of interest statement

Declaration of competing interest None.

Figures
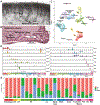
Fig. 1.
Fig. 1.
Identifying cell type composition in the murine eyelid. A) The meibomian glands (Dash Lines) can be seen as a row of white structures embedded in the distal eyelid that extend from the Eyelid Margin and are comprised of clusters of small round acini. B) H&E-stained tissue section of eyelid from a normal wild type mouse showing the meibomian gland underlying the Orbicularis Muscle. The gland has a blind ended central duct (Duct) connecting acini to the gland orifice (Arrowhead) at the junction between the skin and conjunctiva. C) Uniform manifold approximation and projection (UMAP) visualization of 3 datasets integrated. Each dot represents a single cell (n = 16,922). D) Violin plot showing marker gene expression for identified cell types. E) Proportion of cells in each cell cycle phase (as assigned by the CellCycleScoring function in Seurat) split by cell type clusters.
Fig. 2.
Fig. 2.
Identifying the cell type composition and differentiation programs in the healthy meibomian gland. A) UMAP visualization of meibomian gland epithelial clusters. Each dot represents a single cell (n = 3741). B) Heatmap of top differentially expressed genes for each cluster. C) Heatmap of AUROC scores between meibomian gland clusters based on the highly variable gene set using MetaNeighbor. D) Violin plots showing expression of keratins and Pparg in the meibomian gland. E) Violin plots showing expression of lipid associated genes in the meibomian gland. F) Monocle trajectory for meibomian gland epithelial clusters. G) Pseudotime trajectory with cells colored by marker gene expression. H) Heatmap dividing the expression of top meibocyte pseudotime dependent transcription factors into three groups. I) Gene ontology results for three groups of meibocyte pseudotime dependent genes.
Fig. 3.
Fig. 3.
Meibomian gland differentiation is marked by distinct transcription factor and signaling networks. A) Heatmap showing SCENIC results for the meibomian gland clusters. B) Pseudotime trajectory with cells colored by SCENIC gene set activity. C) Heatmaps showing incoming and outgoing patterns of top signaling pathways in the meibomian gland populations using CellChat. D) Scatterplot showing separation of meibomian gland populations into general senders or receivers of signals.
Fig. 4.
Fig. 4.
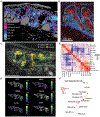
Spatial transcriptomics maps the healthy murine eyelid and localizes novel spatial populations. A) Results of joint clustering of the two replicates displayed on cell segmentation (n = 14,576). B) Heatmap showing the top marker genes for each identified cluster. C) Expression of Plac8 shown on cell segmentation of the conjunctiva colored by number of transcripts per cell. D) Transcripts of immune population markers displayed on the DAPI image of the eyelid. Scale bar indicates 300um.
Fig. 5.
Fig. 5.
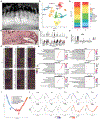
Gradual meibocyte differentiation in the murine eyelid. A) Cell segmentation of meibomian gland (n = 2513) colored by the results of subclustering. Surrounding cell types shown in grey. B) Immunohistochemical staining for Awat2 (red) in the mouse meibomian gland shows segmental staining for expression of Awat2 primarily in the central region of the acini. Basal meibocytes are identified by positive Krt5 expression (green), cell nuclei are labeled with DAPI (blue). C) Transcripts of four meibocyte differentiation markers displayed on the DAPI image of themeibomian gland. Scale bar indicates 150um. D) Marker genes for each of the five identified meibomian gland projected on the cell segmentation colored by number of transcripts per cell. E) Heatmap showing Spearman correlation of gene expression of the spatial clusters. F) Cell neighborhoods determined by spatial proximity of cell types.
Fig. 6.
Fig. 6.
Dysregulation of meibomian gland differentiation and immunological processes in the Awat2 KO. A) Eyelid of the Awat2 KO contains enlarged meibomian glands (Dash line) with plug meibomian gland orfices (Arrowhead). B) H&E stained eyelid section (a) showing extreme dilation of the meibomian gland duct with ductal epithelial hyperplasia (Duct) and enlarged orifice (Arrowhead). C) UMAP visualization showing the integration of the Awat2 WT and KO datasets. Each dot represents a single cell (n = 29,277). D) Bar plot showing proportion of each cell type by status. E) Violin plots of Il23a and Lcn2 in the meibomian gland populations split by status. F) Violin plots of Il17a in the immune populations split by status. G) Heatmaps displaying cell type specific top differentially expressed genes for meibocytes, ductal epithelia, conjunctiva, fibroblasts, macrophages/DC, and T cell/lymphoid. H) Dot plot displaying top cell type specific gene ontology terms based on the differentially expressed genes shown in G. I) Monocle trajectory for meibomian gland epithelial clusters. J) Differential genes projected onto the meibomian gland Monocle trajectories for the WT (top) and KO (bottom).
Fig. 7.
Fig. 7.
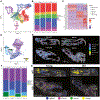
Spatial transcriptomic profiling of the eyelid during meibomian gland dysfunction in young and aged mice reveals alterations in meibocyte differentiation. A) UMAP of the integrated spatial transcriptomic dataset colored by general cell types (n = 36,668 cells). B) Proportions of cell types in the spatial dataset split both by young and old and Awat2 KO and wildtype status. C) Heatmap showing top markers of 5 meibomian gland specific clusters. D) UMAP showing results of meibomian gland sub-clustering (n = 9592). E) Results of clustering displayed on cell segmentation. Cells colored by the 5 identified meibomian gland cell types, with other cell types in grey. F) Proportions of the meibomian cell types in the spatial dataset split both by young and old and Awat2 KO and wildtype status. G) Individual transcripts for Igfbp2, Elovl3, Awat1, and Awat2 shown on DAPI staining for each condition.
Fig. 8.
Fig. 8.
Localizing a spatially distinct inflammatory environment in the murine eyelid during meibomian gland dysfunction. A) Individual transcripts for Krt10 (epidermis), Krt6a (conjunctiva), and S100a9 shown on DAPI staining for each condition Scale bars indicate 300um. B) Bar plot showing proportion of cells expressing >1 transcript of S100a9 in each condition. C) Violin plots of the single cell data showing expression of S100a8 and S100a8 in the conjunctiva populations split by condition. D) Bar plot showing proportion of cells near the meibomian gland expressing ≥1 transcript of Il17a each condition. E) Bar plot showing proportion of cells near the meibomian gland expressing ≥1 transcript of Il23a in each condition. F) Immunohistochemical staining of Awat2 knockout mouse eyelid stained for antibodies against neutrophils (Ly6g-Green) and G) bone marrow derived cells (CD45-Green), counter stained for basal cell (Krt5, red) and nuclei marker (DAPI, blue). H) Individual transcripts for immune cell markers Cd209a, for dendritic cells, Cd3e, for T cells, and C1qa, for macrophages shown on DAPI staining for young and old WT. Scale bars indicate 300um. I-K) Bar plots showing proportion of cells near the meibomian gland expressing >1 transcript of immune cell markers.
Fig. 9.
Fig. 9.
Graphical Diagram of the signal cell and spatial transcriptomic findings during normal meibomian gland homeostasis and dysfunction in normal and the Awat2 KO mouse.

References

    1. Knop E, Knop N, Millar T, Obata H, Sullivan DA. The international workshop on meibomian gland dysfunction: report of the subcommittee on anatomy, physiology, and pathophysiology of the meibomian gland. Invest Ophthalmol Vis Sci 2011;52:1938–78. - PMC - PubMed
    1. Linton RG, Curnow DH, Riley WJ. The meibomian glands: an investigation into the secretion and some aspects of the physiology. Br J Ophthalmol 1961;45:718–23. - PMC - PubMed
    1. Mishima S, Maurice DM. The oily layer of the tear film and evaporation from the corneal surface. Exp Eye Res 1961;1:39–45. - PubMed
    1. Hom MM, Martinson JR, Knapp LL, Paugh JR. Prevalence of Meibomian gland dysfunction. Optom Vis Sci 1990;67:710–2. - PubMed
    1. Lemp MA, Nichols KK. Blepharitis in the United States 2009: a survey-based perspective on prevalence and treatment. Ocul Surf 2009;7:S1–14. - PubMed

Substances