. 2024 Aug 9;15(1):6826.
doi: 10.1038/s41467-024-50040-6.

Offshore wind and wave energy can reduce total installed capacity required in zero-emissions grids

Affiliations

Offshore wind and wave energy can reduce total installed capacity required in zero-emissions grids

Natalia Gonzalez et al. Nat Commun. .

Abstract

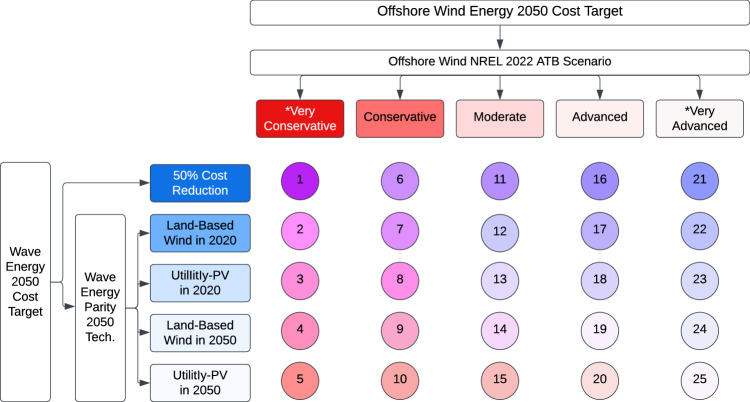
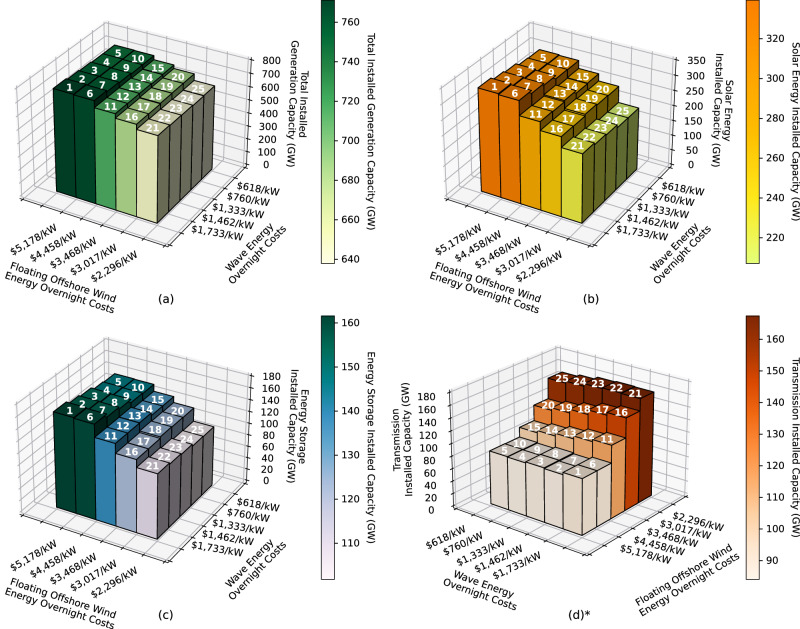
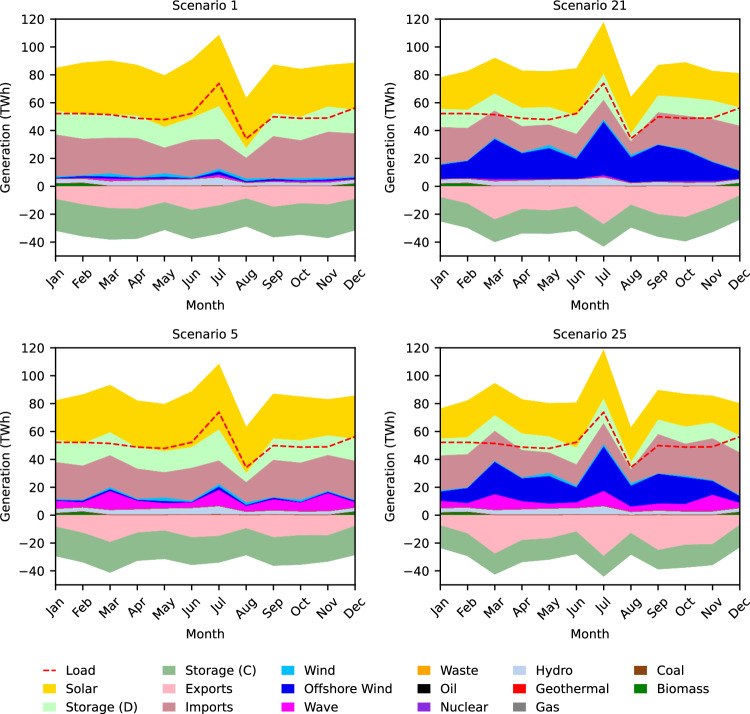
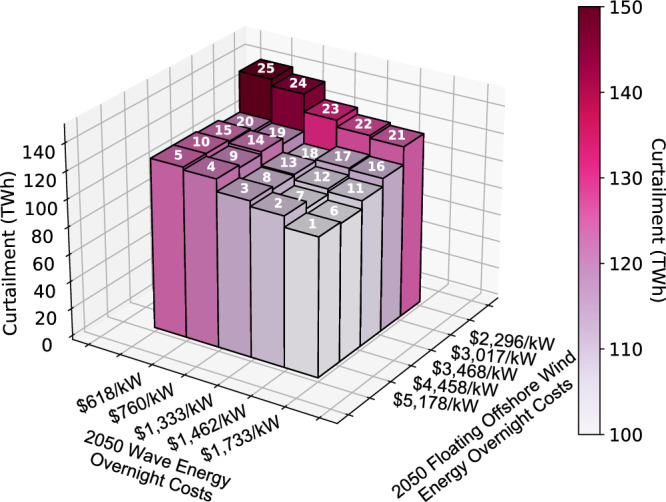
As the world races to decarbonize power systems to mitigate climate change, the body of research analyzing paths to zero emissions electricity grids has substantially grown. Although studies typically include commercially available technologies, few of them consider offshore wind and wave energy as contenders in future zero-emissions grids. Here, we model with high geographic resolution both offshore wind and wave energy as independent technologies with the possibility of collocation in a power system capacity expansion model of the Western Interconnection with zero emissions by 2050. In this work, we identify cost targets for offshore wind and wave energy to become cost effective, calculate a 17% reduction in total installed capacity by 2050 when offshore wind and wave energy are fully deployed, and show how curtailment, generation, and transmission change as offshore wind and wave energy deployment increase.


Conflict of interest statement

Ryan Davidson is an employee at CalWave, a wave energy company, however the WEC we use in our study (RM6 from the National Renewable Energy Laboratory) has no similarities with the private designs at CalWave. Ryan Davidson’s expertize supports the methodology and choice of sites of industry interest for this study. The remaining authors declare no competing interests.

Figures

Fig. 1
Fig. 1. Scenario numbering according to relative cost targets of offshore wind and wave energy.
The row labels describe which technology wave energy is assumed to reach cost parity by 2050 in each of the 25 scenarios designed for this study. Note that a 50% cost reduction for wave energy corresponds to $1732.50/kW overnight cost and $52.70/kW-yr O& m cost for wave energy in 2050. The column labels describe which offshore wind NREL 2022 ATB scenario is assumed for the cost of offshore wind energy in each of the 25 scenarios designed for this study. *Derived by offsetting an NREL 2022 ATB projection.
Fig. 2
Fig. 2. Infrastructure results.
Scenario numbers are displayed at the top of each bar. a Total 2050 installed zero-emissions generation capacity (GW) in the Western Interconnection in each scenario. Total installed capacity decreases with decreasing offshore wind energy cost targets and mostly decreases with decreasing wave energy cost targets until offshore wind energy costs decline beyond the NREL ATB moderate scenario. b 2050 solar energy installed capacity (GW) in each scenario. Solar energy installed capacity decreases with decreasing offshore wind and wave energy cost targets. c 2050 energy storage installed capacity (GW) in each scenario. Energy storage installed capacity decreases with decreasing offshore wind and wave energy cost targets. d 2050 total land-based transmission capacity (GW) in the Western Interconnection for each scenario. Transmission capacity decreases with decreasing wave energy cost targets and increases with decreasing offshore wind energy cost targets. Note that the x and y axes are flipped in plot (d). This is done so that the trend is fully visible. Source data are provided as a Source Data file.
Fig. 3
Fig. 3. 2050 offshore wind and wave energy capacity installed.
2050 offshore wind energy (a) and wave energy (b) capacity installed (GW) in each scenario. Scenario numbers are displayed at the top of each bar. Offshore wind energy installed capacity increases as offshore wind energy cost targets decline and as wave energy cost targets rise. Wave energy installed capacity increases as wave energy cost targets decline and as offshore wind energy cost targets rise. *Note that the x and y axes are flipped in the plot on the left. This is done so that the trend is fully visible. Source data are provided as a Source Data file.
Fig. 4
Fig. 4. 2050 daily (peak day Dec.) dispatch profiles in coastal load zones for four edge-case scenarios.
The daily dispatch profiles show relatively constant offshore wind (blue) and wave power (magenta) generation, decreased dispatch of solar energy (yellow) and energy storage (light green) with increased dispatch of offshore wind (blue) and wave energy (magenta), and decreased imports from other load zones (dark pink) and increased exports to other load zones (light pink) with increased dispatch of offshore wind and wave energy. Source data are provided as a Source Data file.
Fig. 5
Fig. 5. 2050 monthly dispatch profiles in coastal load zones for four edge-case scenarios.
The monthly dispatch profiles show decreased dispatch of solar energy (yellow) and energy storage (light green) with increased dispatch of offshore wind (blue) and wave energy (magenta), as well as decreased imports from other load zones and increased exports to other load zones (shades of pink) with increased dispatch of offshore wind (blue) and wave energy (magenta). Source data are provided as a Source Data file.
Fig. 6
Fig. 6. Annual generation and transmission lines deployment.
Scenario 1 (left) and scenario 25 (right) (most and least expensive offshore wind and wave energy cost targets, respectively) annual generation breakdown and transmission lines for each load zone in 2050. Between scenarios 1 and 25, coastal load zones show an increase in the share of electricity generation from offshore wind and wave energy, as well as less generation from solar energy and energy storage. Source data are provided as a Source Data file.
Fig. 7
Fig. 7. 2050 energy curtailment (TWh) in the Western Interconnection for each scenario.
Energy curtailment increases with increasing offshore wind and wave energy cost targets. Scenario numbers are displayed at the top of each bar. *Note that the x axis and y axis are flipped with respect to plots a to c in Fig. 2. This is done so that the trend is fully visible. Source data are provided as a Source Data file.
Fig. 8
Fig. 8. Number of sites chosen for collocation in 2050 in each scenario.
In general, the number of sites chosen for collocation increases with decreasing offshore wind and wave energy cost targets. Scenario numbers are displayed at the top of each bar. Source data are provided as a Source Data file.
Fig. 9
Fig. 9. Methodology.
Overview of methodology used for this study.
Fig. 10
Fig. 10. Sites of industry interest (blue points) along the U.S. West Coast, offshore wind and wave energy candidate project areas (pink polygons), and BOEM Call Areas (green polygons).
The sites of industry interest appearing in this figure have been filtered to exclude sites in MPAs and military danger zones. All candidate project areas and BOEM call areas may have offshore wind energy, wave energy, or both technologies installed. Source data are provided as a Source Data file.

References

    1. Sanchez, D. L., Nelson, J. H., Johnston, J., Mileva, A. & Kammen, D. M. Biomass enables the transition to a carbon-negative power system across western North America. Nat. Clim. Change5, 230–234 (2015).
    1. Sepulveda, N. A., Jenkins, J. D., de Sisternes, F. J. & Lester, R. K. The role of firm low-carbon electricity resources in deep decarbonization of power generation. Joule2, 2403–2420 (2015).10.1016/j.joule.2018.08.006 - DOI
    1. Kennedy, K. M. The role of concentrated solar power with thermal energy storage in least-cost highly reliable electricity systems fully powered by variable renewable energy. Adv. Appl. Energy6, 100091 (2022).10.1016/j.adapen.2022.100091 - DOI
    1. Mileva, A., Johnston, J., Nelson, J. H. & Kammen, D. M. Power system balancing for deep decarbonization of the electricity sector. Appl. Energy163, 1001–1009 (2015).
    1. MacDonald, A. E. et al. Future cost-competitive electricity systems and their impact on US CO2 emissions. Nat. Clim. Change.6, 526–531 (2015).