. 2024 Aug 9;15(8):581.
doi: 10.1038/s41419-024-06972-4.

CYLD/HDAC6 signaling regulates the interplay between epithelial-mesenchymal transition and ciliary homeostasis during pulmonary fibrosis

Affiliations

CYLD/HDAC6 signaling regulates the interplay between epithelial-mesenchymal transition and ciliary homeostasis during pulmonary fibrosis

Hua Ni et al. Cell Death Dis. .

Abstract

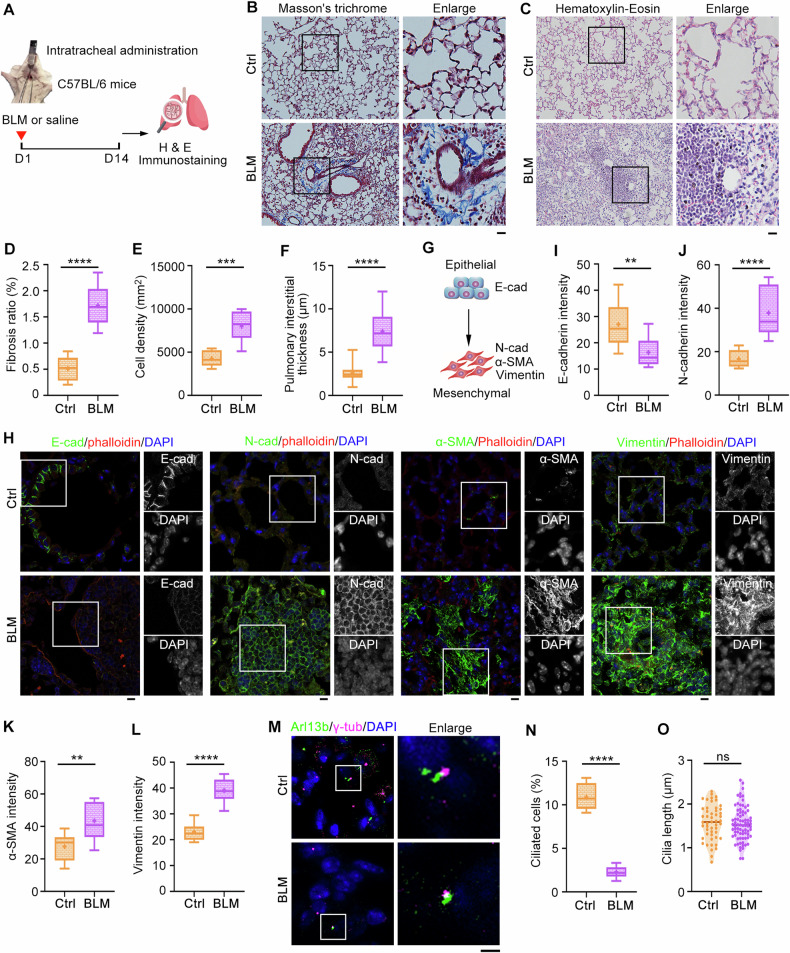
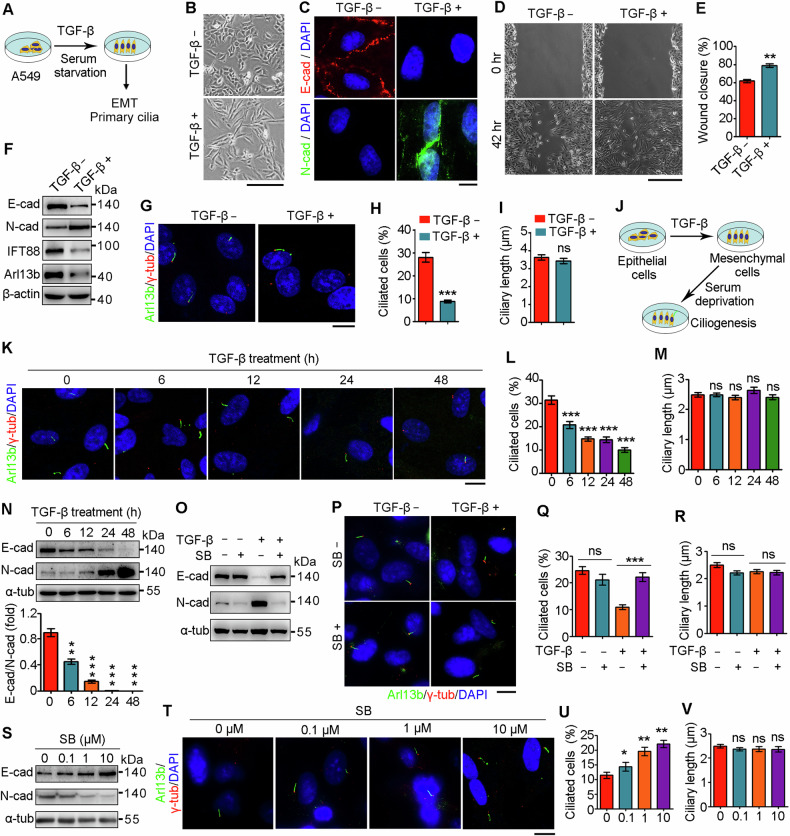
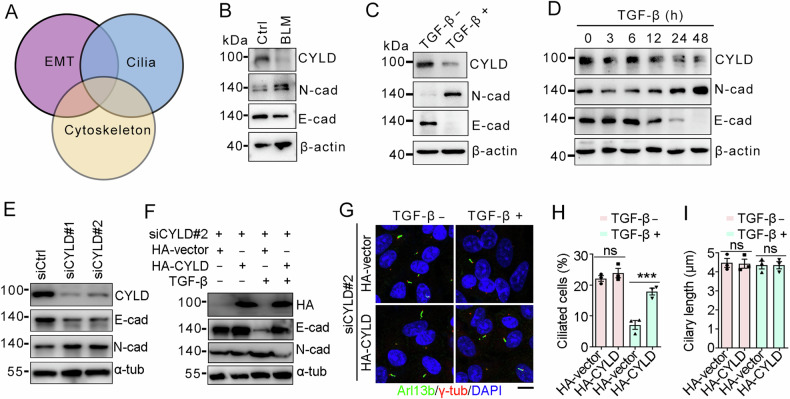
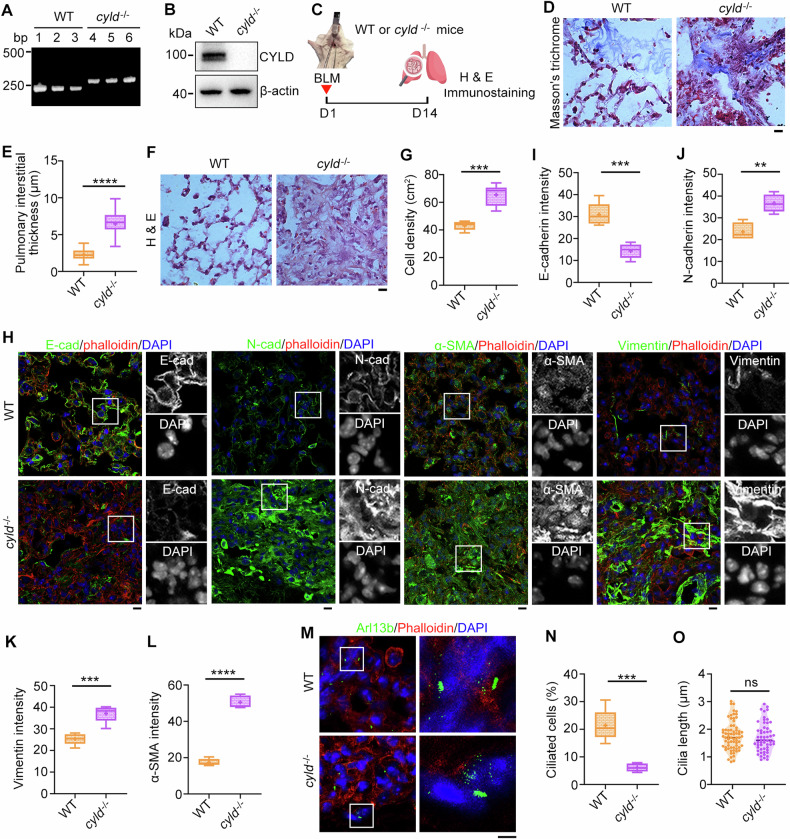
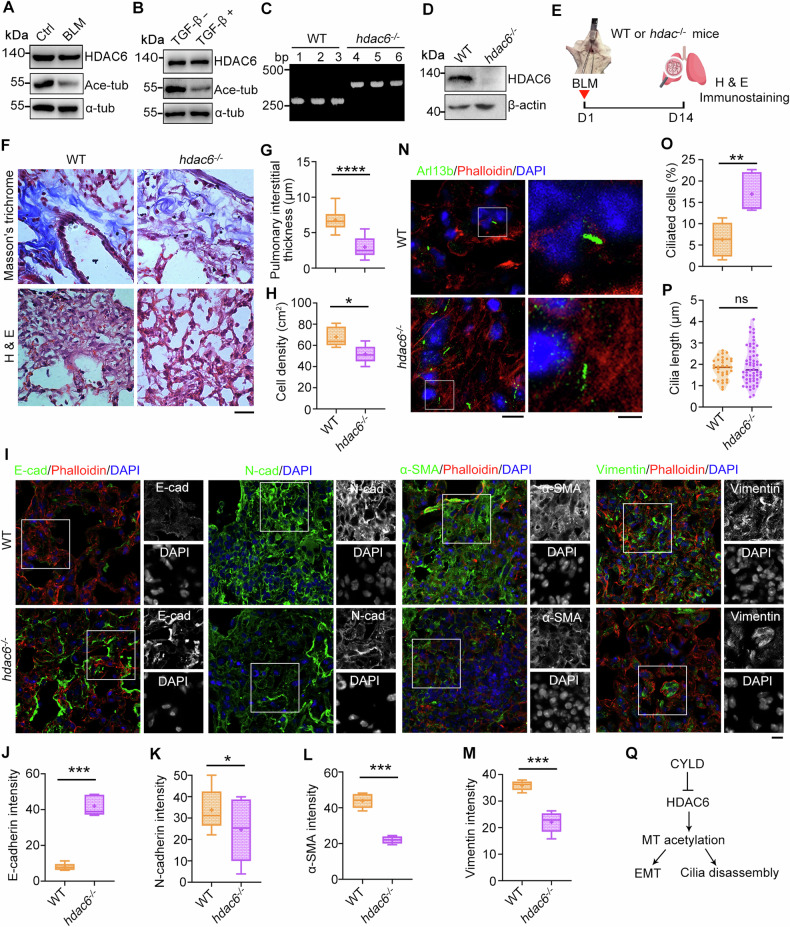
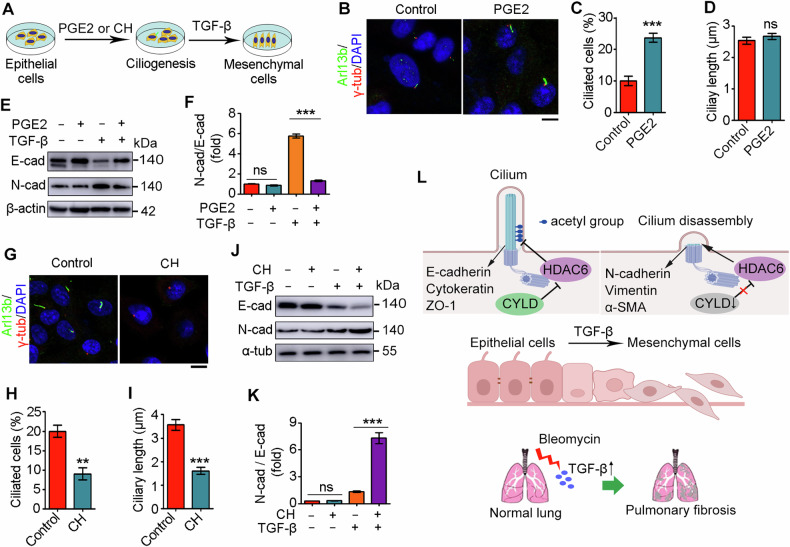
The primary cilium behaves as a platform for sensing and integrating extracellular cues to control a plethora of cellular activities. However, the functional interaction of this sensory organelle with epithelial-mesenchymal transition (EMT) during pulmonary fibrosis remains unclear. Here, we reveal a critical role for cylindromatosis (CYLD) in reciprocally linking the EMT program and ciliary homeostasis during pulmonary fibrosis. A close correlation between the EMT program and primary cilia is observed in bleomycin-induced pulmonary fibrosis as well as TGF-β-induced EMT model. Mechanistic study reveals that downregulation of CYLD underlies the crosstalk between EMT and ciliary homeostasis by inactivating histone deacetylase 6 (HDAC6) during pulmonary fibrosis. Moreover, manipulation of primary cilia is an effective means to modulate the EMT program. Collectively, these results identify a pivotal role for the CYLD/HDAC6 signaling in regulating the reciprocal interplay between the EMT program and ciliary homeostasis during pulmonary fibrosis.


Conflict of interest statement

The authors declare no competing interests.

Figures

Fig. 1
Fig. 1. A close correlation between EMT and primary cilia during pulmonary fibrosis.
A An illustration depicting bleomycin (BLM)-induced pulmonary fibrosis mouse model. Lung tissue sections from saline- or BLM-treated mice were subjected to Masson′s trichrome (B) and hematoxylin-eosin (H & E) staining (C), and fibrosis ratio (D), cell density (E), and pulmonary interstitial thickness (F) were quantified accordingly. n = 3 mice in each group. Scale bars, 5 μm. G An illustration showing the changes of marker proteins during EMT. Lung tissue sections from saline- or BLM-treated mice were immunostained with the indicated antibodies (H), and fluorescence intensities of E-cadherin (I), N-cadherin (J), α-SMA (K), and vimentin (L) were quantified. n = 3 mice in each group. Scale bars, 5 μm. Lung tissue sections from saline- or BLM-treated mice were immunostained with the indicated antibodies (M), and the percentage of ciliated cells (N) and ciliary length (O) were quantified. n > 50 cells. Scale bars, 5 μm. **P < 0.01; ***P < 0.001; ****P < 0.0001; ns not significant.
Fig. 2
Fig. 2. EMT regulates primary ciliogenesis.
A A diagram showing the strategy to induce EMT and primary ciliogenesis by TGF-β exposure and serum starvation. (B) Morphology of A549 cells treated with or without TGF-β for 48 h. Scale bar, 100 μm. (C) Immunofluorescence images of A549 cells treated with or without TGF-β, followed by immunostaining with the indicated antibodies and DAPI. Scale bar, 5 μm. Wound healing images of A549 cells treated with or without TGF-β (D), and the wound closure was quantified (E). n = 3. Scale bar, 100 μm. A549 cells were treated with or without TGF-β, followed by immunoblotting (F) and immunostaining (G) with the indicated antibodies, and the percentages of ciliated cells (H) and ciliary lengths (I) were quantified. n > 50 cells. Scale bar, 5 μm. J A diagram showing the strategy to induce EMT and subsequent primary ciliogenesis. A549 cells were treated with TGF-β for the indicated time, followed by serum starvation for 48 h and immunostaining (K) and immunoblotting (N, n = 3) with the indicated antibodies, and the percentages of ciliated cells (L, n > 50 cells) and ciliary lengths (M, n > 50 cells) were quantified. Scale bar, 5 μm. OR A549 cells were treated with or without TGF-β and SB431542 for 48 h, followed by serum starvation for 48 h and immunoblotting (O) and immunostaining (P) with the indicated antibodies, and the percentages of ciliated cells (Q) and ciliary lengths (R) were quantified. Scale bar, 5 μm. A549 cells were treated with TGF-β, together with various concentrations of SB431542 for 48 h, followed by serum starvation for 48 h and immunoblotting (S) and immunostaining (T) with the indicated antibodies, and the percentages of ciliated cells (U) and ciliary lengths (V) were quantified. n > 50 cells. Scale bar, 5 μm. **P < 0.01; ***P < 0.001; ns not significant.
Fig. 3
Fig. 3. CYLD is a critical regulator for EMT and primary ciliogenesis.
A A diagram showing the relationship between EMT, primary cilia, and cytoskeleton. Immunoblots of lung tissues (B) and TGF-β-treated A549 cells (C). D Immunoblots of A549 cells treated with TGF-β for the indicated time point. E Immunoblots of A549 cells transfected with siRNAs targeting CYLD. A549 cells were treated as indicated, followed by immunoblotting (F) and immunostaining (G) with the indicated antibodies, and the percentages of ciliated cells (H) and ciliary lengths (I) were quantified. n > 50 cells. Scale bar, 5 μm. ***P < 0.001; ns not significant.
Fig. 4
Fig. 4. CYLD depletion aggravates pulmonary fibrosis.
A, B PCR and immunoblotting analysis to confirm the knockout of cyld in mice. C An illustration depicting wildtype (WT) and cyld−/− knockout mice treated with BLM to induce pulmonary fibrosis. Lung tissue sections from WT or cyld−/− knockout mice were subjected to Masson′s trichrome (D) and H & E staining (F), and pulmonary interstitial thickness (E) and cell density (G) were quantified accordingly. n = 3 mice in each group. Scale bars, 5 μm. Lung tissue sections from WT or cyld−/− knockout mice were immunostained with the indicated antibodies (H), and fluorescence intensities of E-cadherin (I), N-cadherin (J), vimentin (K), and α-SMA (L) were quantified. n = 3 mice in each group. Scale bars, 5 μm. Lung tissue sections from WT or cyld−/− knockout mice were immunostained with the indicated antibodies (M), and the percentage of ciliated cells (N) and ciliary length (O) were quantified. n > 50 cells. Scale bars, 5 μm. **P < 0.01; ***P < 0.001; ****P < 0.0001; ns not significant.
Fig. 5
Fig. 5. HDAC6 deficiency protects mice from BLM-induced pulmonary fibrosis.
Immunoblots of lung tissues (A) and TGF-β-treated A549 cells (B) with the indicated antibodies. C, D PCR and immunoblotting analysis to confirm the knockout of hdac6 in mice. E An illustration depicting wildtype (WT) and hdac6−/− knockout mice treated with BLM to induce pulmonary fibrosis. Lung tissue sections from WT or hdac6−/− knockout mice were subjected to Masson′s trichrome and H & E staining (F), and pulmonary interstitial thickness (G) and cell density (H) were quantified accordingly. n = 3 mice in each group. Scale bars, 5 μm. Lung tissue sections from WT or hdac6−/− knockout mice were immunostained with the indicated antibodies (I), and fluorescence intensities of E-cadherin (J), N-cadherin (K), α-SMA (L), and vimentin (M) were quantified. n = 3 mice in each group. Scale bars, 5 μm. Lung tissue sections from WT or hdac6−/− knockout mice were immunostained with the indicated antibodies (N), and the percentage of ciliated cells (O) and ciliary length (P) were quantified. n > 50 cells. Scale bars, 5 μm. Q A diagram showing the pathway underlying CYLD-mediated EMT and ciliary homeostasis. *P < 0.05; **P < 0.01; ***P < 0.001; ****P < 0.0001; ns not significant.
Fig. 6
Fig. 6. Primary cilia play an important role in regulating EMT.
A A diagram showing the strategy to investigate the role of primary cilia in EMT. Immunofluorescence images (B), percentage of ciliated cells (C), and ciliary length (D) of A549 cells treated with PGE2 for 48 h, followed by TGF-β treatment for 48 h. Scale bar: 5 μm. A549 cells were treated with PGE2 for 48 h, followed by TGF-β treatment for 48 h and immunoblotting with the indicated antibodies (E), and the intensities of N-cadherin/E-cadherin were quantified (F, n = 3). Immunofluorescence images (G), percentage of ciliated cells (H), and ciliary length (I) of A549 cells treated with chloral hydrate (CH) for 48 h, followed by TGF-β treatment for 48 h. n > 50 cells. Scale bar: 5 μm. A549 cells were treated with CH for 48 h, followed by TGF-β treatment for 48 h and immunoblotting with the indicated antibodies (J), and the intensities of N-cadherin/E-cadherin were quantified (K, n = 3). L A proposed model showing CYLD/HDAC6 signaling-mediated interplay between EMT and primary ciliary homeostasis during pulmonary fibrosis. **P < 0.01; ***P < 0.001; ns not significant.

References

    1. Richeldi L, Collard HR, Jones MG. Idiopathic pulmonary fibrosis. Lancet. 2017;389:1941–52. 10.1016/S0140-6736(17)30866-8 - DOI - PubMed
    1. Martinez FJ, Collard HR, Pardo A, Raghu G, Richeldi L, Selman M, et al. Idiopathic pulmonary fibrosis. Nat Rev Dis Prim. 2017;3:17074. 10.1038/nrdp.2017.74 - DOI - PubMed
    1. Luppi F, Kalluri M, Faverio P, Kreuter M, Ferrara G. Idiopathic pulmonary fibrosis beyond the lung: understanding disease mechanisms to improve diagnosis and management. Respir Res. 2021;22:109. 10.1186/s12931-021-01711-1 - DOI - PMC - PubMed
    1. Mutsaers SE, Miles T, Prele CM, Hoyne GF. Emerging role of immune cells as drivers of pulmonary fibrosis. Pharmacol Ther. 2023;252:108562. 10.1016/j.pharmthera.2023.108562 - DOI - PubMed
    1. Ghazipura M, Mammen MJ, Bissell BD, Macrea M, Herman DD, Hon SM, et al. Pirfenidone in progressive pulmonary fibrosis: a systematic review and meta-analysis. Ann Am Thorac Soc. 2022;19:1030–9. 10.1513/AnnalsATS.202103-342OC - DOI - PubMed

LinkOut - more resources