. 2024 Aug 9;15(1):6810.
doi: 10.1038/s41467-024-50910-z.

Super enhancer acquisition drives expression of oncogenic PPP1R15B that regulates protein homeostasis in multiple myeloma

Affiliations

Super enhancer acquisition drives expression of oncogenic PPP1R15B that regulates protein homeostasis in multiple myeloma

Sinan Xiong et al. Nat Commun. .

Abstract

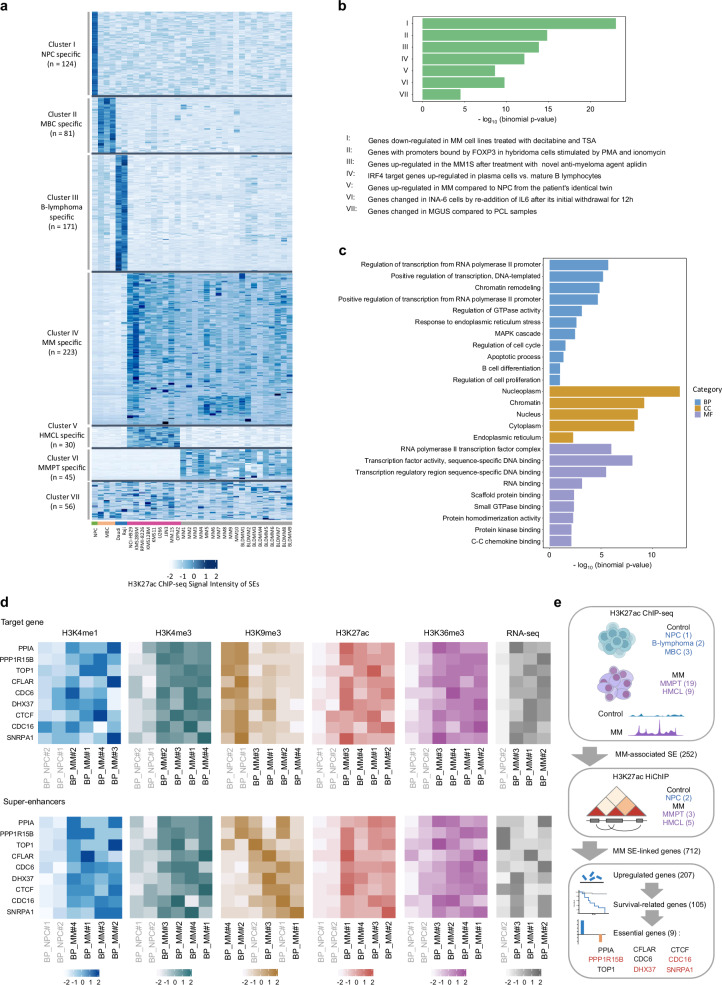
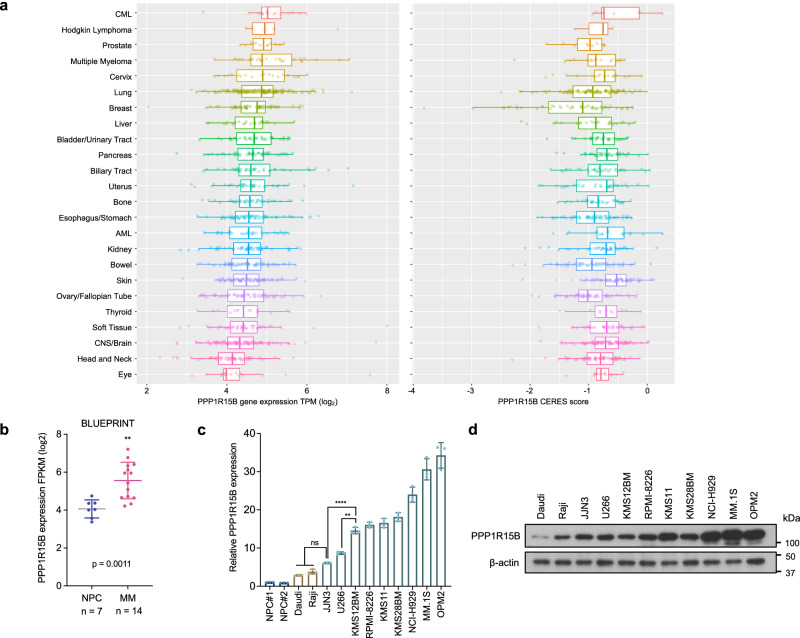
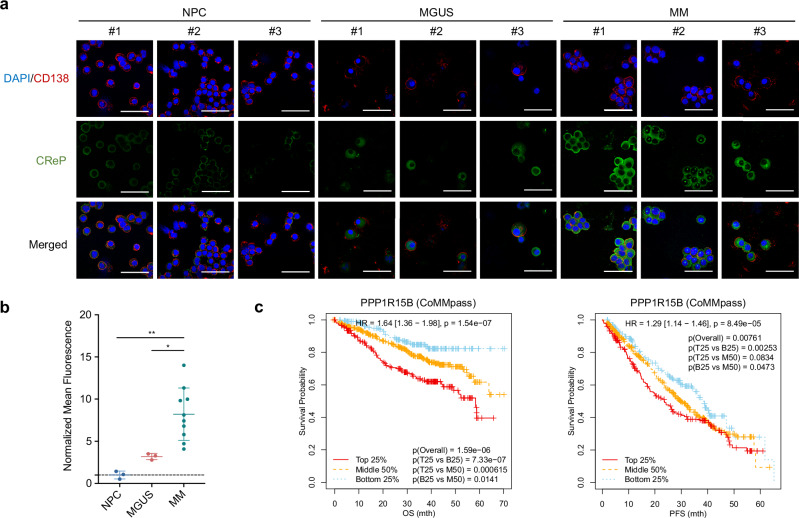
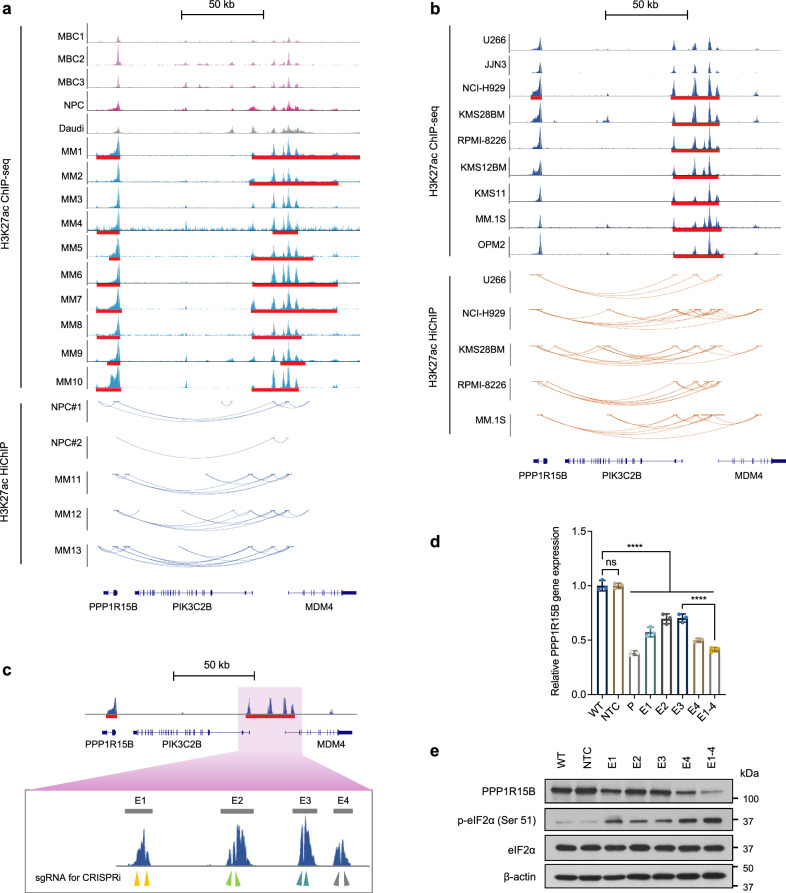
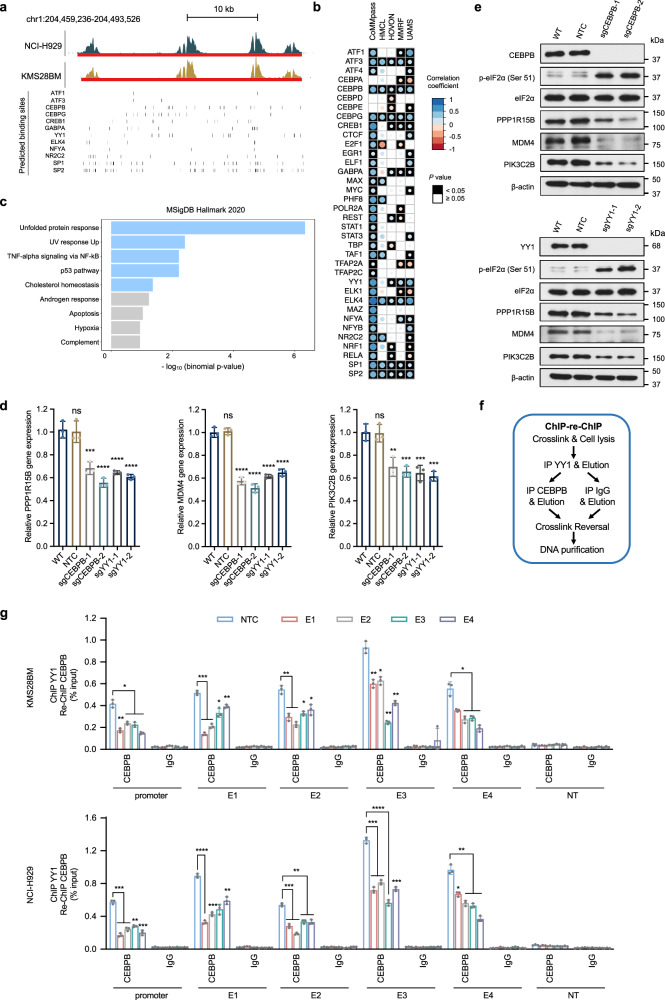
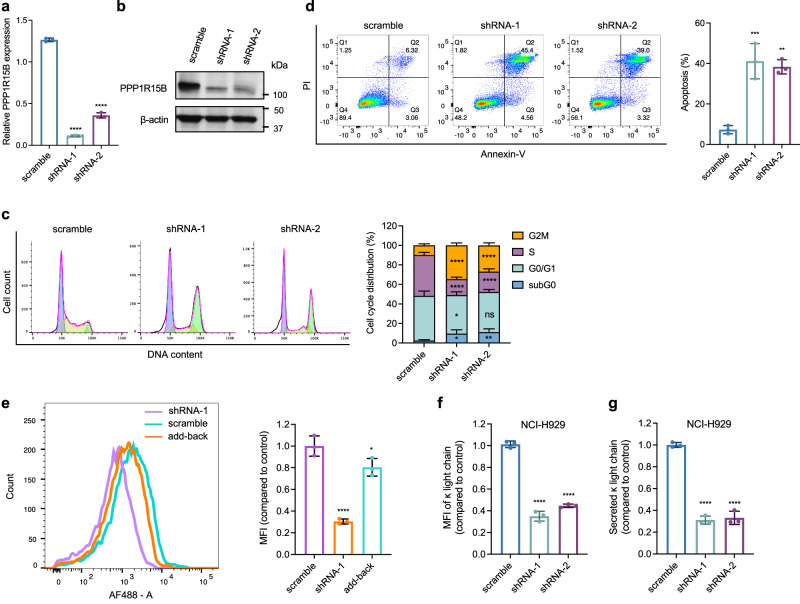
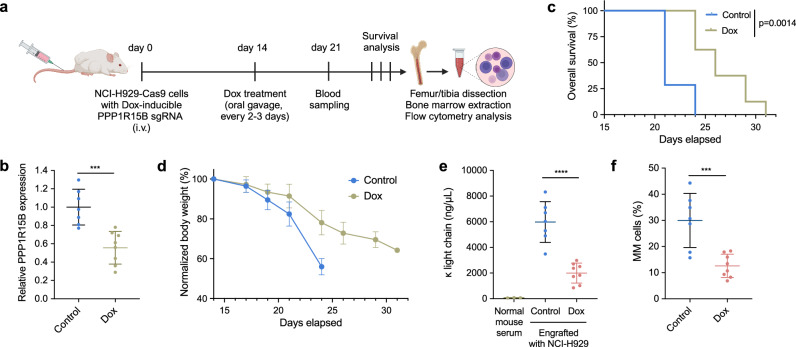
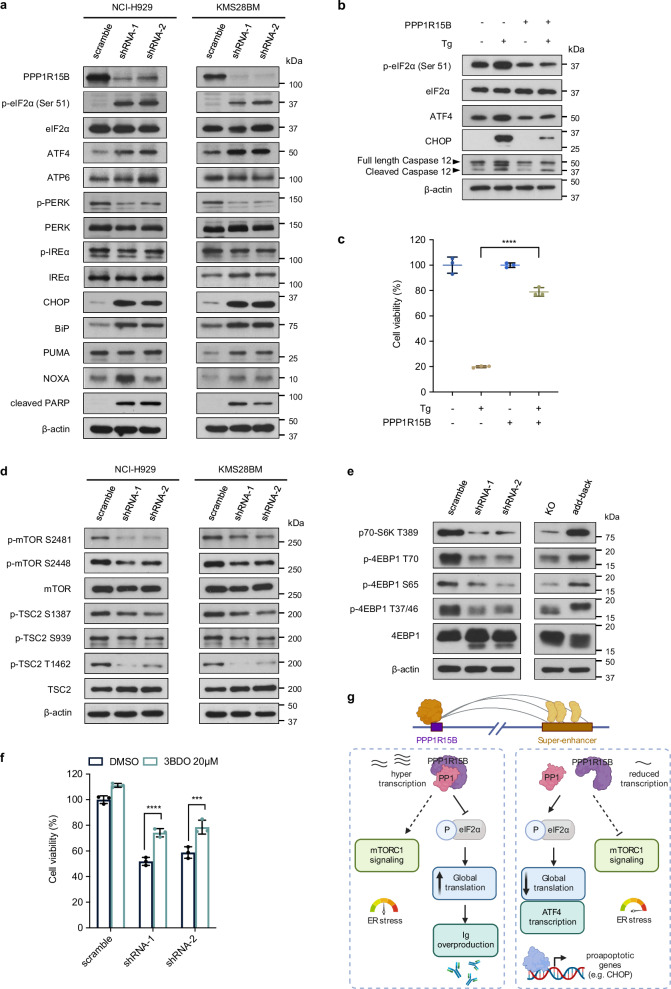
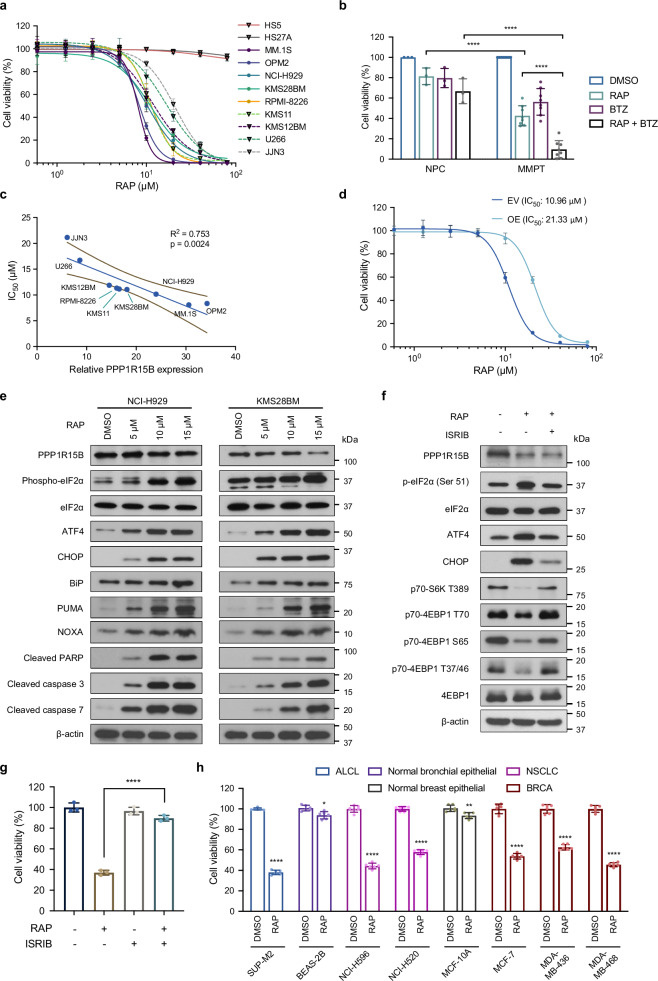
Multiple myeloma is a hematological malignancy arising from immunoglobulin-secreting plasma cells. It remains poorly understood how chromatin rewiring of regulatory elements contributes to tumorigenesis and therapy resistance in myeloma. Here we generate a high-resolution contact map of myeloma-associated super-enhancers by integrating H3K27ac ChIP-seq and HiChIP from myeloma cell lines, patient-derived myeloma cells and normal plasma cells. Our comprehensive transcriptomic and phenomic analyses prioritize candidate genes with biological and clinical implications in myeloma. We show that myeloma cells frequently acquire SE that transcriptionally activate an oncogene PPP1R15B, which encodes a regulatory subunit of the holophosphatase complex that dephosphorylates translation initiation factor eIF2α. Epigenetic silencing or knockdown of PPP1R15B activates pro-apoptotic eIF2α-ATF4-CHOP pathway, while inhibiting protein synthesis and immunoglobulin production. Pharmacological inhibition of PPP1R15B using Raphin1 potentiates the anti-myeloma effect of bortezomib. Our study reveals that myeloma cells are vulnerable to perturbation of PPP1R15B-dependent protein homeostasis, highlighting a promising therapeutic strategy.


Conflict of interest statement

M.J.F. declares two patents on methodologies related to chromatin interaction analysis by paired-end tag sequencing (ChIA-PET). The remaining authors declare no competing interests.

Figures

Fig. 1
Fig. 1. Three-dimensional epigenomic profiling reveals altered super-enhancer engagement in multiple myeloma.
a Heatmap showing H3K27ac enrichment patterns in different clusters of SE across NPC (n = 1), MBC (n = 3), B-lymphoma cell lines (n = 2), HMCLs (n = 9), and MM patient samples (n = 19). Each column represents a sample, which are color-coded by the corresponding sample group (NPC, MBC, B-lymphoma, HMCL, and primary MM). The clusters and the number of SEs specific to each cluster are indicated on the left. b GREAT analysis of genes linked to MM-associated enhancers, showing enriched pathway terms curated from the Molecular Signatures Database (MSigDB). P values were calculated using one-sided Fisher’s exact test and were adjusted using the Benjamini-Hochberg method. c GO enrichment analysis of genes associated with acquired SEs in MM. Each GO category (BP, CC, MF) is shown. P values were calculated using one-sided Fisher’s exact test and were adjusted using the Benjamini-Hochberg method. d Heatmaps illustrating the H3K4me1, H3K4me3, H3K9me3, H3K27ac and H3K36me3 ChIP-seq and RNA-seq patterns from the Blueprint database–, at the candidate MM SE-associated genes (top panel) and MM-associated SEs (bottom panel) in patient-derived myeloma cells (n = 4) compared to NPCs (n = 2). RNA-seq data (FPKM) is available for three myeloma samples and one NPC sample only. Samples are organized by hierarchical clustering, with labels colored in gray and black highlighting MM patient and normal control samples, respectively. e Schematic representation of the workflow utilized to discover target genes driven by MM SEs and associated with potential clinical relevance. The number of samples or candidate genes is indicated in brackets. The nine prioritized candidate genes that have been characterized in MM are labeled in blue, and other genes are labeled in red. Figure 1 created with BioRender.com released under a Creative Commons Attribution-NonCommercial-NoDerivs 4.0 International license. BP biological process, CC cellular component, MF molecular function.
Fig. 2
Fig. 2. PPP1R15B is overexpressed in multiple myeloma.
a PPP1R15B expression and gene dependency across different types of diseases/tissues (n = 24) using the Cancer Cell Line Encyclopedia (CCLE, left) and DepMap (right). Each point represents a cell line. The CERES value at −0.5 is used as the cutoff point for essential gene dependency. Lower CERES score indicates higher gene essentiality. The left and right edges of the box represent the 25th and 75th quartiles, respectively, and the middle line denotes median. The whiskers extend to 1.5 times the interquartile range of 25th and 75th quartiles. b PPP1R15B expression level in plasma cells from healthy donors (n = 7) and patients (n = 14) based on the Blueprint database. Two-tailed unpaired Student’s t-test was performed (p value in NPC vs MM = 0.0011). c, d RT-qPCR (c) and western blot (d) analysis of PPP1R15B expression in NPCs (n = 2), B-cell lymphoma cell lines (n = 2) and HMCLs (n = 9). For RT-qPCR, one-way ANOVA with Tukey’s post hoc test was performed (p values in NPC#1 vs JJN3 = 0.0101; NPC#2 vs JJN3 = 0.0078; Daudi vs JJN3 = 0.2883; Raji vs JJN3 = 0.7576; JJN3 vs KMS12BM = 8.24 × 10-6; U266 vs KMS12BM = 0.0018). All western blots are representative of 3 biological replicates. β-actin was used as a loading control. Data are presented as mean ± SD. Source data are provided as a Source Data file.
Fig. 3
Fig. 3. PPP1R15B is associated with unfavorable patient survival outcomes.
a, b Immunofluorescence analysis of PPP1R15B expression in CD138+ plasma cells from healthy donors (n = 3), MGUS (n = 3) and MM patients (n = 10). Representative images are displayed (a), with the additional samples presented in Supplementary Fig. 6a. Cells were stained for CD138 (red) and PPP1R15B (green), with nuclei counterstain (blue). Immunofluorescence intensity of PPP1R15B protein was quantified (b). Each data point represents the average fluorescence intensity of PPP1R15B in a minimum of 50 cells per donor/patient. One-way ANOVA with Tukey’s post hoc test was performed (p values in NPC vs MGUS = 0.57, NPC vs MM = 0.0027, MGUS vs MM = 0.029). Scale bar: 50 µm. Data are presented as mean ± SD. c Kaplan-Meier survival curves depicting the association of PPP1R15B expression with MM patient overall and progression-free survival based on CoMMpass dataset (n = 958). Patients were categorized into groups based on PPP1R15B expression (TPM): top 25% (T25), middle 50% (M50), and bottom 25% (B25). The hazard ratio, along with its confidence interval and log-rank p values, derived from the univariate Cox proportional hazards regression analysis, are presented. MGUS monoclonal gammopathy of undetermined significance, SMM smoldering multiple myeloma, HR, hazard ratio. Source data are provided as a Source Data file.
Fig. 4
Fig. 4. PPP1R15B is a multiple myeloma-specific super-enhancer-associated gene.
a ChIP-seq around PPP1R15B gene and SE locus in patient-derived myeloma cells (MM1-10), and controls including three MBCs, one NPC sample and a Burkitt’s lymphoma cell line Daudi (top panel). SE broad peaks are marked by red lines. Enhancer-promoter linkages as determined by H3K27ac HiChIP are shown in patient-derived myeloma cells (n = 3) and NPCs from different donors (n = 2, bottom panel). b H3K27ac ChIP-seq signals at the PPP1R15B gene and SE locus in HMCLs (n = 9), with H3K27ac HiChIP interactions in HMCLs (n = 5) displayed below. c dCas9-KRAB sgRNA target sites at the constituent enhancers (E1-4) within the SE, as indicated by arrows. d, e RT-qPCR (d) and western blot analysis (e) of PPP1R15B expression in KMS28BM upon dCas9-KRAB-mediated repression of SE using sgRNAs targeting PPP1R15B promoter (P), individual SE constituents or in combination (E1-4). For RT-qPCR, one-way ANOVA with Tukey’s post hoc test was performed (p values in WT vs NTC = 1.00; WT vs P = 6.40 × 10-12; WT vs E1 = 1.55 × 10-9; WT vs E2 = 2.08 × 10-7; WT vs E3 = 2.83 × 10-7; WT vs E4 = 1.18 × 10-10; WT vs E1-4 = 1.32 × 10-11; E3 vs E1-4 = 4.05 × 10-7). n = 3 biological replicates. β-actin was used as a loading control. All western blots are representative of 3 biological replicates. Data are presented as mean ± SD. NPC, normal plasma cell; MBC memory B cell, NTC non-targeting control. Source data are provided as a Source Data file.
Fig. 5
Fig. 5. CEBPB and YY1 regulate the transcription of PPP1R15B by binding to its promoter and super-enhancer.
a Genome browser views of the putative binding sites of prominent TFs predicted using FIMO and JASPAR motifs. Vertical bars correspond to the predicted binding sites for each TF. b Correlation patterns between TFs and PPP1R15B based on publicly available CoMMpass RNA-seq dataset and microarray datasets (HMCL, HOVON, MMRF, UAMS). Univariate analysis was performed using Spearman correlation analysis. Circle radius and color represent the correlation coefficient (Spearman Rho), and the color of the squares represents statistical significance (p value). c Functional enrichment analysis for a list of 12 TFs whose expression positively correlates with PPP1R15B level in ≥ 3 datasets with statistical significance (Spearman Rho > 0, p ≤ 0.05), showing enriched pathway terms curated from the MSigDB hallmark. P values were calculated using one-sided Fisher’s exact test and were adjusted using the Benjamini-Hochberg method. d, e Cas9-expressing KMS28BM were transfected with NTC sgRNA or sgRNA targeting CEBPB or YY1. Effects of CEBPB or YY knockout on the mRNA (d) and protein (e) levels of PPP1R15B, MDM4, PIK3C2B in KMS28BM. For RT-qPCR, n = 3 biological replicates. One-way ANOVA with Tukey’s post hoc test was performed (All p values in WT vs sgCEBPB/sgYY1 < 0.01. Detailed calculations of p values are provided in the Source Data file). All western blots are representative of 3 biological replicates. β-actin was used as a loading control. f, g ChIP-qPCR analysis of CEBPB and YY1 co-recruitment at PPP1R15B gene and SE loci using ChIP-re-ChIP (f). Epigenetic silencing of SE led to diminished co-recruitment of CEBPB and YY1 in KMS28BM and NCI-H929 cells (g). Significant differences were determined using two-way ANOVA with Tukey’s post hoc test (All p values in NTC vs E1/E2/E3/E4/E1-4 < 0.05. Detailed calculations of p values are provided in the Source Data file). n = 3 biological replicates. Data are presented as mean ± SD. NT non-transcribed region. Source data are provided as a Source Data file.
Fig. 6
Fig. 6. PPP1R15B promotes malignant phenotypes of multiple myeloma cells in vitro.
a, b Knockdown of PPP1R15B was confirmed by RT-qPCR (a) and western blot (b) in NCI-H929 transfected with scramble and PPP1R15B shRNAs. n = 3 biological replicates. For RT-qPCR, significant differences were determined using one-way ANOVA with Tukey’s post hoc test (p values in scramble vs shRNA-1 = 8.23 × 10-11; scramble vs shRNA-2 = 5.22 × 10-9). All western blots are representative of 3 biological replicates. β-actin was used as a loading control. c Cell cycle analysis of NCI-H929 after transfection with the indicated shRNAs. Significant differences were determined using two-way ANOVA with Tukey’s post hoc test (Detailed calculations of p values are provided in the Source Data file). Data were obtained from 3 independent experiments, with representative plots shown. d Apoptosis detection by Annexin-V/PI staining in NCI-H929 cells at day 4 post-transfection with scramble or PPP1R15B shRNAs. Bar chart showing the percentage of apoptotic cells (Annexin V + , right). n = 3 biological replicates. One-way ANOVA with Tukey’s post hoc test was performed (p values in scramble vs shRNA-1 = 0.00074; scramble vs shRNA-2 = 0.0012). e Protein synthesis analysis by flow cytometry in PPP1R15B knockdown or add-back NCI-H929 cells. Mean fluorescence intensity (MFI) for HPG incorporation (AF488) was measured and normalized to scramble control, with representative plots shown. n  =  3 biological replicates. One-way ANOVA with Tukey’s post hoc test was performed (p values in scramble vs shRNA-1 = 5.65×10⁻⁵; scramble vs add-back = 0.037). f Flow cytometric analysis of cytoplasmic immunoglobulin κ light chain expression upon PPP1R15B knockdown. n = 3 biological replicates. One-way ANOVA with Tukey’s post hoc test was performed (p values in scramble vs shRNA-1 = 9.05 × 10-7; scramble vs shRNA-2 = 1.79 × 10-6). g Secretion of M protein measured by ELISA in PPP1R15B knockdown cells in NCI-H929. Results are shown as the relative MFI compared to the control. n = 3 biological replicates. One-way ANOVA with Tukey’s post hoc test was performed (p values in scramble vs shRNA-1 = 2.70 × 10-6; scramble vs shRNA-2 = 3.23 × 10-6). Source data are provided as a Source Data file.
Fig. 7
Fig. 7. PPP1R15B promotes malignant phenotypes of multiple myeloma cells in vivo.
a Schematic representation of the mouse experiment timeline. NSG mice were injected with NCI-H929 cells with stably expressed Cas9 and Dox-inducible sgRNA through tail veins. Figure 7a created with BioRender.com released under a Creative Commons Attribution-NonCommercial-NoDerivs 4.0 International license. b RT-qPCR analysis of PPP1R15B expression in hCD138 isolated MM cells from mouse bone marrow samples. n = 7 independent mice in the control group (1% sucrose in water), n = 8 independent mice in the Dox group. Two-tailed unpaired Student’s t-test was performed (p value = 0.00049). c Kaplan-Meier plot of overall survival durations of tumor-bearing mice treated with Dox (n = 8) or control (1% sucrose in water, n = 7). Presence of hind limb paraplegia and distress is the experimental end-point. P value was determined using the log-rank test. d Body weights of tumor-bearing mice treated with Dox (n = 8) or control buffer (1% sucrose in water, n = 7). e Levels of human κ light chain in mouse serum as determined by ELISA on day 21. n = 3 independent mice not receiving tumor cells (negative controls), n = 7 independent tumor-bearing mice receiving control buffer (1% sucrose in water), and n = 8 independent tumor-bearing mice receiving Dox.` One-way ANOVA with Tukey’s post hoc test was performed (p values in normal mouse serum vs control = 5.09 × 10-6; control vs Dox = 1.80 × 10-5). f Percentages of hCD138 + mCD45- MM cells in the bone marrow of mice receiving Dox or control buffer (1% sucrose in water). Gating strategy is shown in Supplementary Fig. 20. n = 7 independent mice in the control group, n = 8 independent mice cells in the Dox group. Two-tailed unpaired Student’s t-test was performed (p value = 0.00082). Data are presented as mean ± SD. i.v., intravenous. Source data are provided as a Source Data file.
Fig. 8
Fig. 8. Depletion of PPP1R15B induces pro-apoptotic unfolded protein response and inhibits mTORC1 signaling.
a Western blot analysis in NCI-H929 and KMS28BM infected with scramble or shRNAs targeting PPP1R15B was performed using the indicated antibodies. All western blots are representative of 3 biological replicates. β-actin was used as a loading control. b Western blot analysis of UPR pathway components in U266 cell line that ectopically overexpressed PPP1R15B and WT U266 after treatment with 1 µM thapsigargin (Tg) for 12 hours. All western blots are representative of 3 biological replicates. c Cell viability analysis of U266 expressing empty (EV) or PPP1R15B overexpression plasmids (PPP1R15B) after Tg treatment. n = 3 biological replicates. One-way ANOVA with Tukey’s post hoc test was performed (p values in WT + DMSO vs WT+Tg =2.03 × 10-8; WT+Tg vs OE+Tg = 2.14 × 10-7; OE + DMSO vs OE+Tg = 0.00054). Data are presented as mean ± SD. d, e The expression of mTORC1 signaling components were evaluated by western blot in PPP1R15B knockdown or add-back cells. All western blots are representative of 3 biological replicates. β-actin was used as a loading control. f Effect on cell viability of NCI-H929 cells infected with scramble or PPP1R15B-targeting shRNAs after treatment with the mTOR activator 3BDO (20 µM) for 48 hours. n = 3 biological replicates. Two-way ANOVA with Tukey’s post hoc test was performed (p values in scramble:DMSO vs 3BDO = 0.028; shRNA-1:DMSO vs 3BDO = 8.60 × 10-5; shRNA-2:DMSO vs 3BDO = 0.00028). Data are presented as mean ± SD. g Proposed model of the functional roles of PPP1R15B in MM. MM-specific PPP1R15B SE coordinates with master transcription factors, mediators and other cofactors, thereby leading to overexpression of PPP1R15B. PPP1R15B forms a holophosphatase complex with PP1c that dephosphorylates eIF2α under basal conditions, which elevates the threshold for activation of the lethal UPR pathway. On the other hand, hypophosphorylation of eIF2α allows for increased protein synthesis and immunoglobulin production. Depletion of PPP1R15B induces apoptosis in MM cells by activating eIF2α-ATF4-CHOP pathway and indirectly inhibiting mTORC1 pathway. Figure 8g created with BioRender.com released under a Creative Commons Attribution-NonCommercial-NoDerivs 4.0 International license. Source data are provided as a Source Data file.
Fig. 9
Fig. 9. Therapeutic potential of targeting PPP1R15B using a selective phosphatase inhibitor Raphin1.
a Dose response for stromal cell lines (HS5, HS27A) and HMCLs (n = 9), treated with Raphin1 for 48 hours. n = 4 biological replicates. b Combination treatment with 10 μM Raphin1 and/or 2.5 nM bortezomib on NPCs (n = 3) and patient-derived myeloma cells (n = 8) for 48 hours. Two-way ANOVA with Tukey’s post hoc test was performed (p values in NPC:RAP vs MMPT:RAP = 7.51×10⁻⁶; NPC:RAP + BTZ vs MMPT:RAP + BTZ = 1.30×10⁻⁹; MMPT:RAP vs MMPT:RAP + BTZ = 4.18×10⁻⁷). c Correlation of PPP1R15B expression with drug response of Raphin1. Each dot represents a HMCL. Univariate linear regression analysis was performed, with coefficient of determination R2 and p value shown. Solid line represents the fitted linear regression curve, and dashed lines indicate 95% confidence band. d Cell viability of U266 overexpressing PPP1R15B or EV control after 48-hour Raphin1 treatment. n = 3 biological replicates. e Immunoblot analysis of UPR and apoptotic markers after 72-hour Raphin1 treatment. All western blots are representative of 3 biological replicates. β-actin was used as a loading control. f Immunoblot analysis of UPR and mTORC1 pathways in NCI-H929 treated with 10 μM Raphin1 and/or 100 nM ISRIB for 72 hours. All western blots are representative of 3 biological replicates. g Effects of Raphin1 (10 μM) and ISRIB (100 nM) on cell viability of NCI-H929 after 48 hours. n = 3 biological replicates. One-way ANOVA with Tukey’s post hoc test was performed (p values in RAP vs DMSO = 4.95 × 10-8; RAP vs RAP + ISRIB = 2.47 × 10-7). h Cell viability of other cancer cell lines exhibiting relatively high PPP1R15B expression and the related normal cells (BEAS-2B, MCF-10A) after 48-hour treatment with 10 μM Raphin1 or DMSO. n = 6 biological replicates. Two-way ANOVA with Tukey’s post hoc test was performed (Detailed calculations of p values are provided in the Source Data file). Data presented as mean ± SD. RAP Raphin1, BTZ Bortezomib, ALCL Anaplastic large cell lymphoma, NSCLC Non-small cell lung cancer, BRCA Breast invasive carcinoma. Source data are provided as a Source Data file.

References

    1. Kumar, S. et al. International Myeloma Working Group consensus criteria for response and minimal residual disease assessment in multiple myeloma. lancet Oncol.17, e328–e346 (2016). 10.1016/S1470-2045(16)30206-6 - DOI - PubMed
    1. Dimopoulos, M. A. et al. Developments in continuous therapy and maintenance treatment approaches for patients with newly diagnosed multiple myeloma. Blood cancer J.10, 17 (2020). 10.1038/s41408-020-0273-x - DOI - PMC - PubMed
    1. Anderson K. C. Progress and paradigms in multiple myeloma. Clin. Cancer Res.22, 5419–5427 (2016). - PMC - PubMed
    1. Bazarbachi, A. H. et al. Relapsed refractory multiple myeloma: a comprehensive overview. Leukemia33, 2343–2357 (2019). 10.1038/s41375-019-0561-2 - DOI - PubMed
    1. Blobel, G. A. et al. Testing the super-enhancer concept. Nat. Rev. Genet.22, 749–755 (2021). 10.1038/s41576-021-00398-w - DOI - PubMed

MeSH terms