. 2024 Aug 9;15(1):6820.
doi: 10.1038/s41467-024-50072-y.

Hydrogel crosslinking modulates macrophages, fibroblasts, and their communication, during wound healing

Affiliations

Hydrogel crosslinking modulates macrophages, fibroblasts, and their communication, during wound healing

Sergei Butenko et al. Nat Commun. .

Abstract

Biomaterial wound dressings, such as hydrogels, interact with host cells to regulate tissue repair. This study investigates how crosslinking of gelatin-based hydrogels influences immune and stromal cell behavior and wound healing in female mice. We observe that softer, lightly crosslinked hydrogels promote greater cellular infiltration and result in smaller scars compared to stiffer, heavily crosslinked hydrogels. Using single-cell RNA sequencing, we further show that heavily crosslinked hydrogels increase inflammation and lead to the formation of a distinct macrophage subpopulation exhibiting signs of oxidative activity and cell fusion. Conversely, lightly crosslinked hydrogels are more readily taken up by macrophages and integrated within the tissue. The physical properties differentially affect macrophage and fibroblast interactions, with heavily crosslinked hydrogels promoting pro-fibrotic fibroblast activity that drives macrophage fusion through RANKL signaling. These findings suggest that tuning the physical properties of hydrogels can guide cellular responses and improve healing, offering insights for designing better biomaterials for wound treatment.


Conflict of interest statement

The authors declare no competing interests.

Figures
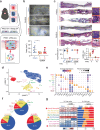
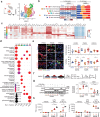
Fig. 1
Fig. 1. Crosslinking of GelMA hydrogel dressing modulates scarring, healing dynamics and cell infiltrate of full-thickness murine skin wounds.
a Schematic of wounding studies. b Images of fixed, whole mounted wounds treated with lo- or hi-GelMA, or Sham (Tegaderm only), at PWD30. Scar outlined with yellow dashed line. n = 9 (mice). Scale bar: 1 mm. p = 0.01 (one-way ANOVA, Tukey's HSD). c Images of H&E stained PWD5 and 10 showing incorporation and degradation of lo-GelMA versus inflammation with cell aggregation and extrusion of hi-GelMA. Yellow and red boxes indicate regions that have been shown at higher magnification to the right. Yellow dashed line: epithelium-dermis and dermis-hypodermis border. Green dashed line: GelMA-dermis border. g: GelMA. Scale bar: 200 µm. Quantification of epithelial migration from wound margins defined as a percentage of re-epithelialization, and the degradation of GelMA is measured as the area of GelMA. n = 6 (mice). Re-epithelialization: p < 0.0001; GelMA area: PWD5 lo/hi: p = 0.0003, lo-GelMA PWD5/10: p = 0.0002, hi-GelMA PWD5/10: p < 0.0001 (one-way ANOVA, Tukey's HSD) d UMAP dimensional reduction representing cells categorized into nine main clusters with each cell color-coded based on its cell type. e Dot plot of total cells showing expression of canonical markers of each cell type. Dot size corresponds to the proportion of cells within the group expressing each gene, and color correspond to expression level. f Pie chart and (g) table along with bar plots showing cell populations of each cluster presented by percentages of total sequenced cells or percentages of specific cell type across treatments. Arrows indicate cell populations of interest that exhibit differential percentages between treatments. Blue shows populations enriched in Sham, orange shows populations enriched in lo-GelMA, and red shows populations enriched in hi-GelMA. All data presented as mean ± SD. Source data are provided as a Source Data file.
Fig. 2
Fig. 2. Crosslinking of GelMA hydrogel dressing modulates Mϕ function.
a UMAP representation of Mϕ cells from lo- or hi-GelMA and Sham wounds were categorized into six subpopulations represented by UMAP, with each cell color-coded by its associated cell cluster. b Table and bar plots showing Mϕ populations of each cluster presented by percentages of total sequenced cells and percentages of specific cell types across treatments. Arrows indicate cell populations of interest that exhibit differential percentages between treatments. Color indicates the enriched treatment: blue (Sham), orange (lo-GelMA), and red (hi-GelMA). c Heatmap showing differentially expressed genes serving as phenotypic markers. d Dot plot of the enriched GO biological processes of highly expressed genes in each subpopulation. Dot size corresponds to the proportion of cells within the group expressing each gene, and dot color correspond to GO enrichment p-value. e Immunohistochemistry of lo- or hi-GelMA and Sham treated wounds at PWD3, 5 and 10, stained for F4/80 (Mϕ marker) and iNOS (inflammatory marker). For full image see Supplementary Fig. 6a. n = 5 (mice). Scale bar: 50 µm. PWD3: p = 0.03; PWD5: p = 0.01; PWD10: p = 0.01 (one-way ANOVA, Tukey’s HSD). f Schematic of in vitro studies. g Immunoblots of cell lysate from BMDM probed for ARG1 (healing) and iNOS (inflammatory) expression, along with quantification across n = 3 (BMDM harvests from individual mice). iNOS: lo/hi: p = 0.02, lo/G: p = 0.004; ARG1: lo/hi: p = 0.04, lo/G: p = 0.04 (one-way ANOVA, Tukey’s HSD). h ELISA of TNF-α and IL-10 secretion from BMDM, with quantification across n = 3 (BMDM harvests from individual mice). TNF-α: LPS/IFN-γ: lo/hi: p = 0.01, lo/G: p = 0.0003, LPS/IL-4/13: lo/G: p = 0.002; IL-10: LPS/IFN-γ: lo/hi: p = 0.0001, lo/G: p = 0.0001, LPS/IL-4/13: lo/G: p = 0.04 (one-way ANOVA, Tukey's HSD). All data presented as mean ± SD. Source data are provided as a Source Data file. Figure 2/panel f Created with BioRender.com released under a Creative Commons Attribution-NonCommercial-NoDerivs 4.0 International license (https://creativecommons.org/licenses/by-nc-nd/4.0/deed.en).
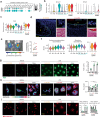
Fig. 3
Fig. 3. GelMA crosslinking modulates Mϕ during wound healing.
a Oxidation genes expressed by M4 in wounds with lo- and hi-GelMA. Dot size indicates the proportion of cells expressing each gene; dot color reflects expression levels. b Violin plots showing Mmp12 and Mmp9 expression across all Mϕ (left) and comparing hi- versus lo-GelMA in M4 (right). c Violin plots of Cybb expression in all Mϕ (left) and comparing hi- versus lo-GelMA in M4 (right). d RNAscope images of PWD5 wounds treated with lo versus hi-GelMA, stained for Fcgr1/CD64 (Mϕ marker) and Cybb/Nox2 (oxidation gene). Green box: magnified view and H&E stain; green dashed line: GelMA-dermis border. g: GelMA. Scale bar: 50 µm. Representative images from n = 3 (wounds). e Wounds after a 100 mg/kg luminol injection, with luminescence quantified across n = 5 mice; p = 0.02 (two-sided paired t-test). Scale bar: 2 mm. f Signature scoring for oxidative phosphorylation (GO:0006119) and glycolysis (GO:0045821) in all Mϕ and comparing hi- versus lo-GelMA in M4 Mϕs (right). g BMDM seeded on hi- or lo-GelMA or glass for 24 h, stimulated with 1 µg/ml LPS for 16 h, stained with CellROX-green detecting ROS, with quantification. Scale bar: 25 µm, n = 3 (BMDM harvests from individual mice), p < 0.0001 (one-way ANOVA, Tukey's HSD). h FLIM images of BMDM seeded on hi- versus lo-GelMA or glass for 24 h, stimulated with 1 µg/ml LPS for 16h, with quantification (right). Scale bar: 15 µm. See Supplementary Fig. 7a for FLIM analysis. n = 9, 11, 12, 12, 12, and 11 for lo/V, lo/LPS, hi/V, hi/LPS, G/V, and G/LPS, respectively (cells from 3 mice). lo/hi: p = 0.02, lo/G: p = 0.0009 (one-way ANOVA, Tukey's HSD). i BMDM seeded on hi versus lo-GelMA or glass for 24 h, stimulated with LPS for 16 h, stained with MitoTracker Red CMXRos, with mitochondrial particles and network branches quantified. See Supplementary Fig. 7c for analysis. n = 10 (ROIs from 3 mouse BMDM culture). Scale bar: 25 µm. p < 0.0001 (one-way ANOVA, Tukey's HSD). All data presented as mean ± SD. Source data are provided as a Source Data file.
Fig. 4
Fig. 4. Differential modulation of macrophage phagocytosis by GelMA crosslinking.
a Dot plot of phagocytosis- related genes expressed by M3 and M4 cells in lo- and hi-GelMA treated wounds. Dot size corresponds to the proportion of cells within the group expressing each transcript, and dot color correspond to the expression level. b Representative laser scanning microscopy images of labeled BMDM (green) seeded on pHrodo-labeled (red) hi- or lo-GelMA for 16h, along with quantification. Cyan arrowheads: phagocytosed GelMA. Scale bar: 25 µm. n = 3 (BMDM harvests from individual mice). p = 0.005 (t-test, two-sided). c Violin plot of integrin gene expression across in vivo Mϕ subpopulations (bottom) and qPCR validation (top) of integrin gene expression in BMDM cultured on GelMA for 24h, compared to BMDM cultured without GelMA (control), n = 3 (BMDM harvests from individual mice). Left to right: p = 0.003, 0.002, 0.006, 0.005, 0.01(t-test, two-sided). d Violin plot of complement components gene expression across in vivo Mϕ subpopulations (bottom) and qPCR validation (top) of complement component gene expression in BMDM cultured on GelMA for 24h, compared to BMDM cultured without GelMA (control). For C3, expression in lo versus hi-GelMA in vivo and in vitro. n = 3 (BMDM harvests from individual mice). C3 compared to no GelMA: p = 0.001; C3 lo/hi: p = 0.007 (t-test, two-sided). e Fluorescence signal of BMDM seeded on pHrodo-labeled (red) hi- or lo-GelMA for 16h, treated with 10 µg/ml blocking antibodies (CD18, CD11c, CD51, CD11a, and CD11b), 10 µM phagocytosis inhibitor Cytochalasin-D (Cytoch.D), or antibody isotype controls (Isotype). n = 3 (BMDM harvests from individual mice). Left to right: p = 0.01, 0.01, 0.004, < 0.0001, < 0.0001 (one-way ANOVA, Dunnett). f Fluorescence signal measurement of BMDM seeded on unlabeled gels stained with lysotracker (green) under conditions similar to (e). Left to right: p = 0.05, 0.05, 0.01, 0.01, 0.001 (one-way ANOVA, Dunnett). For microscopy images of (e) and (f) see Supplementary Fig. 8b. n = 3 (BMDM harvests from individual mice). All data presented as mean ± SD. Source data are provided as a Source Data file.
Fig. 5
Fig. 5. Crosslinking of GelMA hydrogel dressing modulates fibroblast function and collagen deposition in wound healing.
a UMAP representation of fibroblasts from lo- or hi-GelMA and Sham-treated wounds were categorized into six subpopulations presented by UMAP, with each cell color-coded for its associated cell cluster. b Table and bar plots showing fibroblast populations of each cluster presented by percentages of total sequenced cells and percentages of specific cell types across treatments. c Fibroblasts were re-clustered based on ECM synthesis genes, with two color codes indicating: reclustering based on ECM synthesis genes (right) and original unsupervised clustering (left). A table displaying the percentages of total cells is included, with purple highlight indicating the cluster that aligned with F1 and F6 along with its representative genes. d Heatmap showing differentially expressed genes serving as phenotypical markers of each cluster. e Dot plot of the enriched GO biological processes of highly expressed genes in each subpopulation. Dot size corresponds to the proportion of cells within the group expressing each gene, and dot color correspond to GO enrichment p-value. f PSR staining of collagen in PWD10 wound sections with green box indicating the magnified region and quantification of dermal collagenous thickness, collagen coverage of dermis and collagen fiber length and width. n = 6 (mice). Derm. Width: hi/S: p = 0.004, hi/lo: p = 0.002, Derm. cover: hi/S: p = 0.01, hi/lo: p = 0.01; Fiber length: hi/S: p = 0.03, hi/lo: p = 0.02, fiber width: hi/lo: p = 0.006 (one-way ANOVA, Tukey's HSD). g: GelMA. Scale bar: 200 µm. g UMAP with red (hi-GelMA) and orange (lo-GelMA) mirroring the gene signature score of fibroblast activation (GO:0072537) shown in the feature plot across all fibroblast subpopulations. Violin plots showing gene signature scores in hi- versus lo-GelMA. Dot plot of genes representative of fibroblast activation comparing hi- versus lo-GelMA. All data presented as mean ± SD. Source data are provided as a Source Data file.
Fig. 6
Fig. 6. Altered cell-cell signaling interactions between Mϕs and fibroblasts in hi versus lo-GelMA treated wounds.
a Two-dimensional visualization representing the overall strength of incoming/outgoing communication in pro-inflammatory M1 and M4 and pro-fibrotic F1 and F6 subpopulations based on receptor and ligand expression, with dot size proportional to the number of cells in each cluster. b Comparison of the overall information flow, highlighting significant signaling differences with colored labels. c Dot plot illustrating the upregulated signaling ligand-receptor pairs between M1 or M4 and F1 and F6 in hi- versus lo-GelMA, analyzed with permutation tests and adjustments for multiple comparisons to control false discovery rates. d Violin plots displaying the expression levels of individual ligand and receptor genes from the signaling channels identified with differential signaling in M1, M4, F1, and F6, comparing hi- (red) versus lo- (yellow) GelMA. e Analysis of the Tnfsf1/RANKL pathway and Mϕ fusion, presented through feature plots showing F1 as the source of Tnfsf1 ligand in F1 and the Mϕ fusion marker Dcstamp in M4, and by gene scoring of the gene list associated with positive regulation of Mϕ fusion (GO:0034241). f Representative RNAScope images of PWD5 wounds treated with lo versus hi-GelMA stained with probes against Tnfsf1/RANKL and Tagln (activated fibroblast marker), along with quantification. Green box indicates region magnified. Green dashed line: GelMA-dermis border. g: GelMA. Scale bar: 50 µm. n = 3 (mice). p = 0.03 (t test, two-sided). All data presented as mean ± SD. Source data are provided as a Source Data file.
Fig. 7
Fig. 7. Schematic illustration of the effects of GelMA crosslinking on wound healing.
Low crosslinked (lo-GelMA) hydrogels, treated with 1 minute of UV exposure, are soft (3 kPa) and porous, promoting cell infiltration and integration into wound tissue. Wound repair with lo-GelMA is characterized by Mϕ phagocytosis and pro-healing activities, fibroblast chemotaxis and proliferation, and collagen maturation in the hydrogel, leading to reduced scarring. High crosslinked (hi-GelMA) hydrogels, treated with 5 minutes of UV exposure, are stiff (150 kPa) and nonporous, impeding cell infiltration and subsequent tissue integration. Wounds treated with hi-GelMA display enhanced inflammation and fibrosis, associated with Mϕ pro-inflammation activities and fibroblast pro-fibrotic activation. This response includes Mϕ expressing pro-inflammatory and pro-fibrotic genes Il1b, TGFb, PDGFB, OSM, and Tnfrsf11a (receptor for the RANKL signal), with pro-fibrotic fibroblasts expressing its ligand Tnfsf11 (RANKL). Moreover, hi-GelMA promotes Mϕ fusion into FBGC at the tissue-biomaterial interface, leading to elevated levels of ROS and MMPs. Mϕ in contact with the hydrogels exhibit expression of integrins Itgal, Itgax, Itgb2, and ItgaV facilitating tissue integration. Figure 7 created with BioRender.com released under a Creative Commons Attribution-NonCommercial-NoDerivs 4.0 International license (https://creativecommons.org/licenses/by-nc-nd/4.0/deed.en).

References

    1. Walmsley, G. G. et al. Scarless wound healing: chasing the holy grail. Plast. Reconstr. Surg.135, 907–917 (2015). 10.1097/PRS.0000000000000972 - DOI - PubMed
    1. Farahani, M. & Shafiee, A. Wound healing: from passive to smart dressings. Adv. Healthc. Mater.10, e2100477 (2021). 10.1002/adhm.202100477 - DOI - PubMed
    1. Butenko, S. et al. Engineering immunomodulatory biomaterials to drive skin wounds toward regenerative healing. Cold Spring Harb. Perspect. Biol. 15, a041242 (2023). - PMC - PubMed
    1. Butenko, S. et al. Transcriptomic analysis of monocyte-derived non-phagocytic macrophages favors a role in limiting tissue repair and fibrosis. Front. Immunol.11, 405 (2020). 10.3389/fimmu.2020.00405 - DOI - PMC - PubMed
    1. Shook, B. A. et al. Myofibroblast proliferation and heterogeneity are supported by macrophages during skin repair. Science362, eaar2971 (2018). 10.1126/science.aar2971 - DOI - PMC - PubMed