. 2024 Aug 9;15(1):6801.
doi: 10.1038/s41467-024-51037-x.

Proximity analysis of native proteomes reveals phenotypic modifiers in a mouse model of autism and related neurodevelopmental conditions

Affiliations

Proximity analysis of native proteomes reveals phenotypic modifiers in a mouse model of autism and related neurodevelopmental conditions

Yudong Gao et al. Nat Commun. .

Abstract

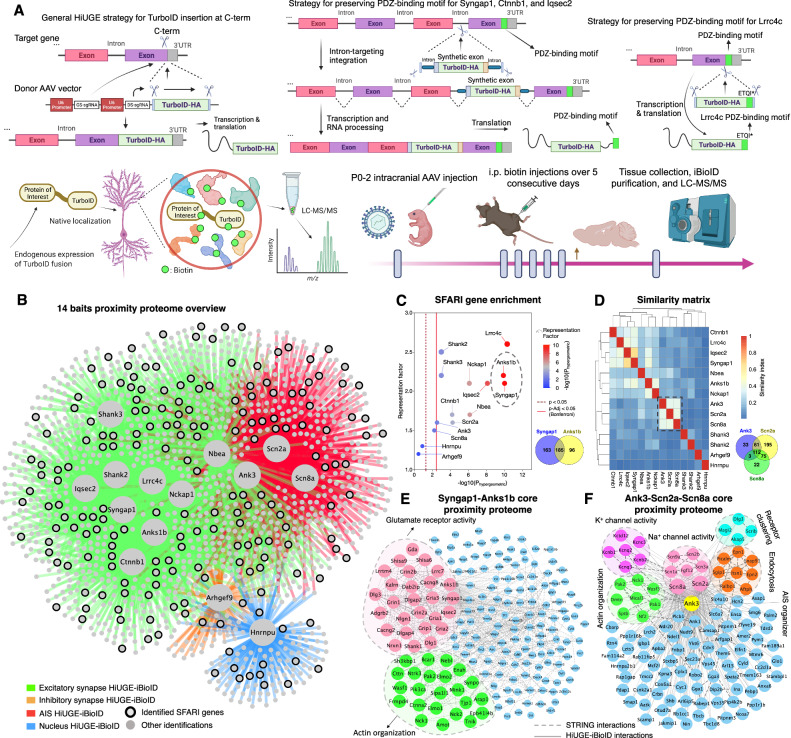
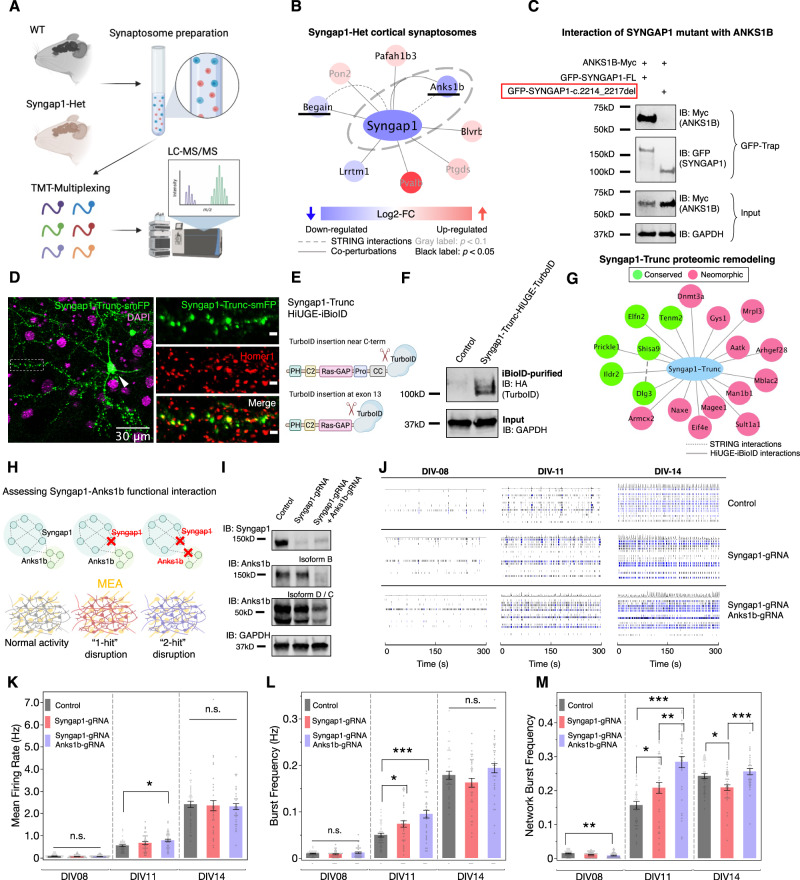
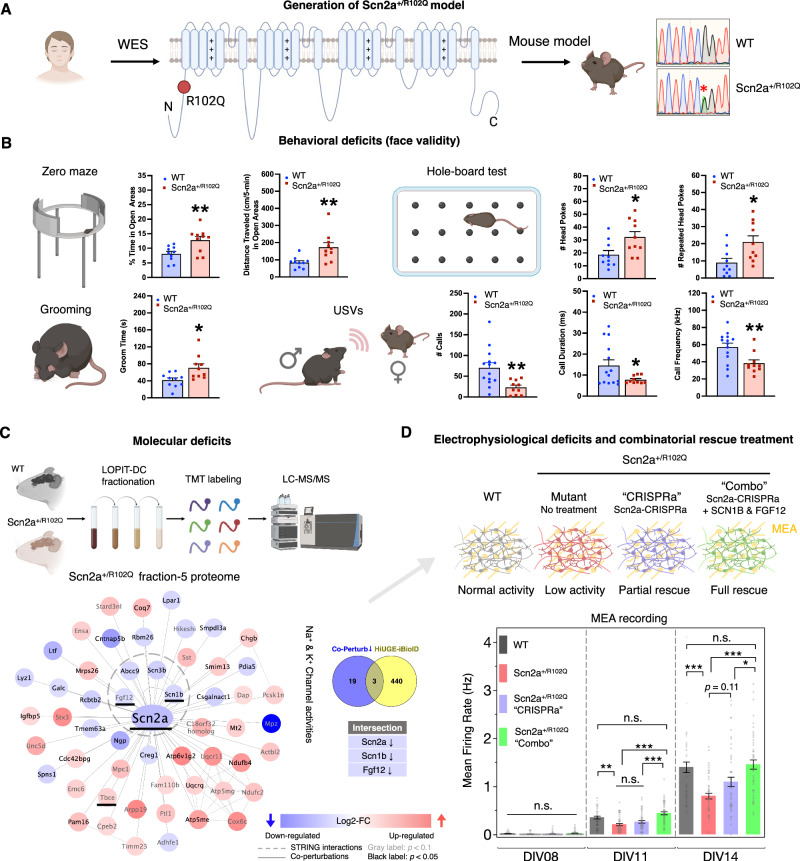
One of the main drivers of autism spectrum disorder is risk alleles within hundreds of genes, which may interact within shared but unknown protein complexes. Here we develop a scalable genome-editing-mediated approach to target 14 high-confidence autism risk genes within the mouse brain for proximity-based endogenous proteomics, achieving the identification of high-specificity spatial proteomes. The resulting native proximity proteomes are enriched for human genes dysregulated in the brain of autistic individuals, and reveal proximity interactions between proteins from high-confidence risk genes with those of lower-confidence that may provide new avenues to prioritize genetic risk. Importantly, the datasets are enriched for shared cellular functions and genetic interactions that may underlie the condition. We test this notion by spatial proteomics and CRISPR-based regulation of expression in two autism models, demonstrating functional interactions that modulate mechanisms of their dysregulation. Together, these results reveal native proteome networks in vivo relevant to autism, providing new inroads for understanding and manipulating the cellular drivers underpinning its etiology.


Conflict of interest statement

S.H.S. and Y.G. have a patent application related to the HiUGE technology (16/968,904). The intellectual property was licensed to CasTag Biosciences. S.H.S. is a founder of CasTag Biosciences; Duke University as an institution holds equity in CasTag Biosciences. C.A.G. is an inventor on patents and patent applications related to CRISPR-based gene activation, is a co-founder of Tune Therapeutics, Locus Biosciences, and Element Genomics, and is an advisor to Sarepta Therapeutics. G.D. Dr. Dawson is on the Scientific Advisory Boards of Akili Interactive, Inc, and Tris Pharma, is a consultant to Apple, Gerson Lehrman Group, and Guidepoint Global, Inc. G.D. has developed autism-related technology, data, and/or products that have been licensed to Apple, Inc. and Cryocell, Inc. and Dawson and Duke University have benefited financially. J.D.B. is a consultant for Bridgebio. W.C.W. is a consultant for Onsero Therapeutics. The remaining authors declare no competing interests.

Figures

Fig. 1
Fig. 1. HiUGE-iBioID reveals endogenous proximity proteomes of 14 autism risk proteins.
A Schematic illustration of HiUGE-iBioID and its workflow. GS-sgRNA: gene-specific-gRNA. DS-sgRNA: donor-specific-gRNA. Strategies to preserve C-term PDZ-binding motifs of Syngap1, Ctnnb1, Iqsec2, and Lrrc4c are detailed. B Overview of 14 proximity proteomes that segregates according to expected bait functions. C Enrichment analysis of overlapping SFARI genes using hypergeometric probability. The solid red line denotes Bonferroni adjusted p-value at 0.05. D Proximity proteome clustering based on a similarity matrix. E Core proximity proteome between Syngap1 and Anks1b that show highly significant overlaps with SFARI genes. F Core proximity proteome amongst Ank3, Scn2a, and Scn8a that are clustered based on similarity. Modules of proteins were isolated by MCL clustering or GO analysis.
Fig. 2
Fig. 2. Proteomic co-perturbation and functional convergence of Syngap1 and Anks1b.
A Schematic illustration of the quantitative proteomic characterization of Syngap1-Het synaptosomes. B Proteomic alterations identified in the Syngap1-Het synaptosome. Proteins that overlap with the Syngap1 proximity proteome are underlined. C Co-immunoprecipitation result showing loss of interaction with ANKS1B in frame-shifting c.2214_2217del SYNGAP1 mutation. D HiUGE labeling of truncated Syngap1 at exon 13 shows synaptic localization (boxed region) and aberrant somatic mis-localization (arrowhead). Scale bar in the enlarged view represents 2 μm. E Schematic illustration of labeling truncated Syngap1 with TurboID by targeting exon 13. F Western blot showing TurboID-HA labeled Syngap1 truncation at the expected molecular mass. G Proximity proteomic network showing conserved and neomorphic interactions in Syngap1 truncation. Note that interaction with Anks1b is no longer detected. H Schematics assessing phenotypes of the Syngap1-Anks1b functional interaction. I Western blot confirming disruption of Syngap1 and Anks1b expression. C, D, I Representative experiments are based on three replicates with similar results. J Representative raster plots of neural activities at DIV-08, 11, and 14. KM Neurometrics showing further depletion of Anks1b exacerbates the development of precocious neural activity associated with Syngap1-LOF. *p < 0.05; **p < 0.01; ***p < 0.001; n.s.: non-significant. One-way ANOVA followed by post-hoc Tukey HSD tests (n = 36 wells). Plots are mean ± SEM.
Fig. 3
Fig. 3. Intersectional proteomics reveal hidden molecular mechanism of a patient-derived Scn2a mutation.
A Generation of a mouse model based on a clinically identified Scn2a missense mutation (R102Q) in autistic individuals. WES: whole exome sequencing. B Behavioral face-validity of Scn2a+/R102Q mutants was assessed by the zero maze as the percent time and distance traveled in the open areas; the hole-board test as numbers of head pokes and repeated head-pokes; the self-grooming test; and the ultrasonic vocalizations (USVs) as numbers of calls, call durations, and call frequencies during social interaction. No differences were detected in the metrics of pre-social (baseline) responses in the USV tests. *p < 0.05, **p < 0.01, WT vs. Scn2a+/R102Q mice; independent samples t-tests, two-tailed (n = 10 or 14 mice per group). Statistics are summarized in Supplementary Data S6. Plots are mean ± SEM. C Spatial proteomics reveals co-perturbations in Scn2a+/R102Q mutants, two-tailed heteroscedastic t-test on log2-transformed data. MCL analysis discovered a key cluster associated with voltage-gated channel activity that is downregulated, including three targets that intersect with the Scn2a HiUGE-iBioID proximity proteome (underlined). D Scn2a+/R102Q mutant neurons show attenuated activity with the MEA. Scn2a-CRISPRa treatment and a “Combo” treatment with additional expression of SCN1B and FGF12 show differential efficacy in restoring neural activity deficits. *p < 0.05; **p < 0.01; ***p < 0.001; n.s.: non-significant. One-way ANOVA followed by post-hoc Tukey HSD tests (n = 48 wells). Plots are mean ± SEM.

References

    1. Lord, C. et al. Autism spectrum disorder. Nat. Rev. Dis. Prim.6, 5 (2020). 10.1038/s41572-019-0138-4 - DOI - PMC - PubMed
    1. Banerjee-Basu, S. & Packer, A. SFARI Gene: an evolving database for the autism research community. Dis. Model Mech.3, 133–135 (2010). 10.1242/dmm.005439 - DOI - PubMed
    1. Satterstrom, F. K. et al. Large-Scale Exome Sequencing Study Implicates Both Developmental and Functional Changes in the Neurobiology of Autism. Cell180, 568–584 e523 (2020). 10.1016/j.cell.2019.12.036 - DOI - PMC - PubMed
    1. Wang, T. et al. Large-scale targeted sequencing identifies risk genes for neurodevelopmental disorders. Nat. Commun.11, 4932 (2020). 10.1038/s41467-020-18723-y - DOI - PMC - PubMed
    1. Zoghbi, H. Y. Postnatal neurodevelopmental disorders: meeting at the synapse? Science302, 826–830 (2003). 10.1126/science.1089071 - DOI - PubMed