. 2024 Aug 9;14(1):18479.
doi: 10.1038/s41598-024-68461-0.

Synchronicity of the Gulf Stream path downstream of Cape Hatteras and the region of maximum wind stress curl

Affiliations

Synchronicity of the Gulf Stream path downstream of Cape Hatteras and the region of maximum wind stress curl

Ian Gifford et al. Sci Rep. .

Abstract

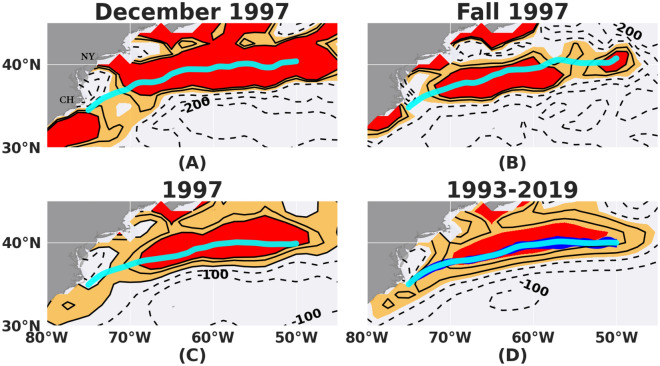
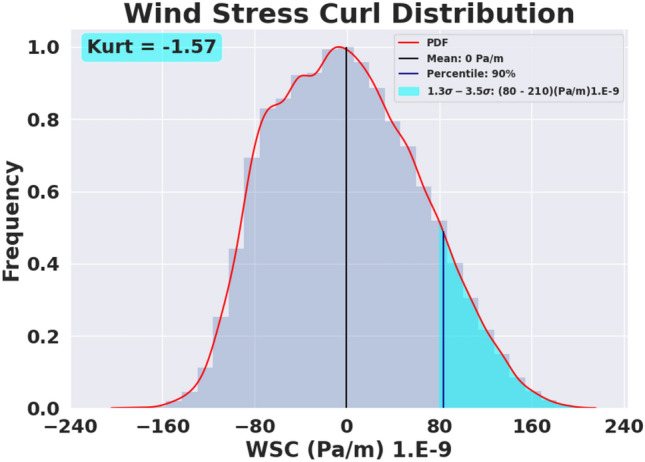
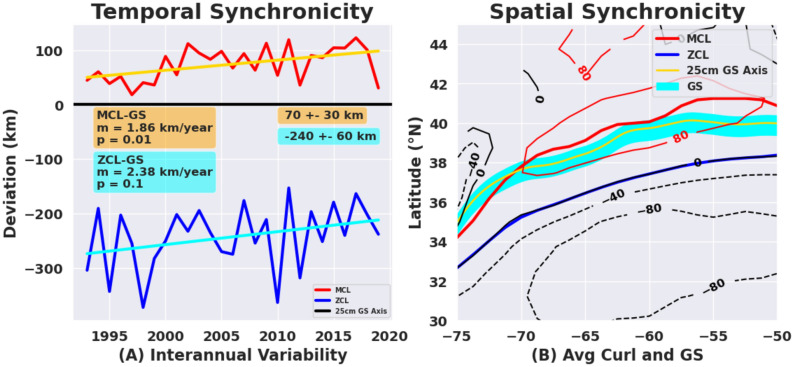
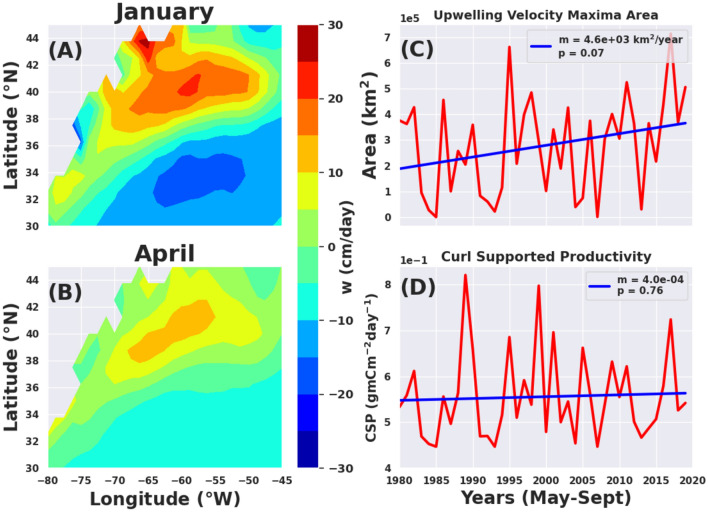
The Gulf Stream, a major ocean current in the North Atlantic ocean is a key component in the global redistribution of heat and is important for marine ecosystems. Based on 27 years (1993-2019) of wind reanalysis and satellite altimetry measurements, we present observational evidence that the path of this freely meandering jet after its separation from the continental slope at Cape Hatteras, aligns with the region of maximum cyclonic vorticity of the wind stress field known as the positive vorticity pool. This synchronicity between the wind stress curl maximum region and the Gulf Stream path is observed at multiple time-scales ranging from months to decades, spanning a distance of 1500 km between 70 and 55W. The wind stress curl in the positive vorticity pool is estimated to drive persistent upward vertical velocities ranging from 5 to 17 cm day-1 over its ~ 400,000 km2 area; this upwelling may supply a steady source of deep nutrients to the Slope Sea region, and can explain as much as a quarter of estimated primary productivity there.


Conflict of interest statement

The authors declare no competing interests.

Figures

Figure 1
Figure 1
Multi-scale synchronicity of the region of maximum wind stress curl and the GS path. (A) Monthly example (Dec, 1997), (B) Seasonal example (Fall: OND, 1997), (C) Annual example (1997), and (D) 27-year (1993–2019) averaged WSC (contours) superimposed with corresponding averaged GS path (cyan line) from altimetry over the domain of 80° W to 45° W and 30° N to 45° N. Curl amplitude values are shown in contours of Pa/m × 10–9. The monthly, seasonal and annual fields are shown for the year 1997 as an example. The east coast of USA is shown in gray with Cape Hatteras (CH) near 75° W, 35° N and the city of New York (NY) near 74° W, 41° N marked for reference in panel (A). See also Fig. S1 and movie S1 in Supplementary Information (SI) for all individual years from 1993 through 2019. All monthly equivalents are shown in movie S2 in the SI. Shaded (orange and red) regions in all panels are regions of positive vorticity with the ‘positive vorticity pool’ (see text) shaded red (≥ 80 Pa/m × 10–9). Yellow is < 80 Pa/m × 10–9. Dashed contours denote negative curl. The blue ‘envelope’ in (D) indicates the latitudinal spread of the 1993–2019 annual GS path means calculated at each 0.1° longitude bin.
Figure 2
Figure 2
Distribution of wind stress curl over the North Atlantic (30–45° N, 80–45° W). This distribution is based on 27 years of wind stress data. See Methods for details. The horizontal axis extends from the most negative WSC value to the most positive WSC value. The cyan region is defined as the region of maximum wind stress curl or the positive vorticity pool. The mean is the black line located at 0 Pa/m and the blue line demonstrates the lower bound of the observed maximum as the 90 percentile.
Figure 3
Figure 3
Temporal and spatial synchronicity of the GS path with the wind stress curl. (A) Temporal synchronicity with slow interannual variation over the 27-year study period. The average southward (northward) deviation from the GS axis to the zero curl line (ZCL, blue) and maximum curl line (MCL, red). The GS axis is situated at the y = 0 line, with the MCL to the north (positive) and ZCL to the south (negative) of this. (B) Spatial synchronicity of the maximum curl region (bordered by the red thin line) with the Gulf Stream (cyan shaded path with the GS axis in yellow) over the 27-year period. The maximum curl line is the solid red line over the positive vorticity pool. The zero curl line is the blue line to the south, which separates the negative wind stress curl region from the positive vorticity to the north where wind-driven upwelling is expected. Similar maps for the annual and monthly averages are shown in the Movies S1 and S2, which highlight the multiscale nature of this region-wise synchronicity.
Figure 4
Figure 4
Temporal variability of the area of the positive vorticity pool region and the area integrated curl over this region. Five-year averaged area of WSC maximum broken down by its major contributory ranges of curl (see Gifford for contributions from specific maximum ranges). Units are in km2 for the area wedges. Note how the high magnitude curl areas have been increasing over the recent pentads. Five-year averaged area integrated curl, (see Gifford for values) are depicted in the solid white line, whose units are in Pa km and shown along the right axis.
Figure 5
Figure 5
Spatial and temporal behavior of the center of mass (COM) of the positive vorticity pool. (A) The positive vorticity pool’s center of mass (COM) longitude against latitude over forty years (1980–2019). (B) Annually averaged COM latitude from 1980 to 2019 (blue) with line of best fit (red) showing possible northward movement of the COM during this period (p = 0.13). (C) A kernel density estimation (KDE) map of the distribution of COM location of a region bounded by the 90th percentile of the wind stress curl. The COM has been converging to a small region around 61°–62° W primarily due to recent years which are shown in red/orange dots in panel (A).
Figure 6
Figure 6
Validation of upwelling velocities and potential impact on primary productivity. (A) for January (maximum upwelling); (B) for April (springtime upwelling). The fields reasonably agree with the results of Risen and Chelton. (C) Interannual variability of the Area covered by the maximum upwelling velocity region defined by the area bounded by the threshold of 6 cm day−1, which is very similar to the positive vorticity pool area. The area expansion is really high in 1995 during the nutrient limited period (May–September). (D) The inter-annual variability of potential wind-stress curl supported productivity (CSP in gm C m−2 day−1) averaged for the biologically active season of May–September over the positive vorticity pool. There is no significant trend in the CSP’s interannual variation.

References

    1. Nye, J. A., Joyce, T. M., Kwon, Y. O. & Link, J. S. Silver hake tracks changes in Northwest Atlantic circulation. Nat. Commun.2, 1 (2011).10.1038/ncomms1420 - DOI - PubMed
    1. Joyce, T. M., Kwon, Y. O. & Yu, L. On the relationship between synoptic wintertime atmospheric variability and path shifts in the Gulf Stream and the Kuroshio Extension. J. Clim.22, 3177–3192 (2009).10.1175/2008JCLI2690.1 - DOI
    1. Caesar, L., Rahmstorf, S., Robinson, A., Feulner, G. & Saba, V. Observed fingerprint of a weakening Atlantic Ocean overturning circulation. Nature556, 191–196 (2018). 10.1038/s41586-018-0006-5 - DOI - PubMed
    1. Zhang, R. et al. A review of the role of the Atlantic meridional overturning circulation in Atlantic multidecadal variability and associated climate impacts. Rev. Geophys.57(2), 316–375 (2019).10.1029/2019RG000644 - DOI
    1. Andres, M. On the recent destabilization of the Gulf Stream path downstream of Cape Hatteras. Geophys. Res. Lett.43, 9836–9842 (2016).10.1002/2016GL069966 - DOI

LinkOut - more resources