. 2024 Sep;6(9):1682-1694.
doi: 10.1038/s42255-024-01107-7. Epub 2024 Aug 9.

Broad-spectrum antibiotics disrupt homeostatic efferocytosis

Affiliations

Broad-spectrum antibiotics disrupt homeostatic efferocytosis

Pedro H V Saavedra et al. Nat Metab. 2024 Sep.

Abstract

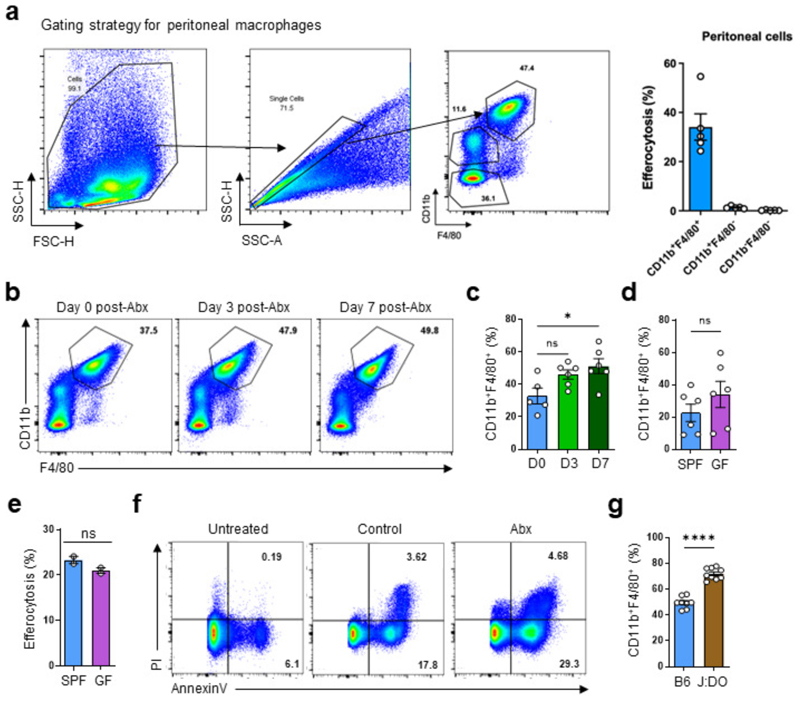
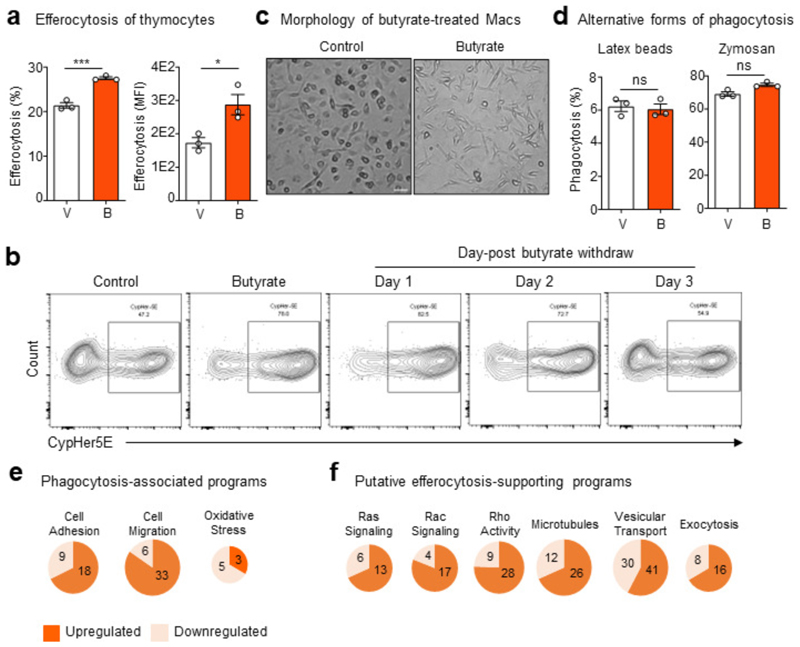
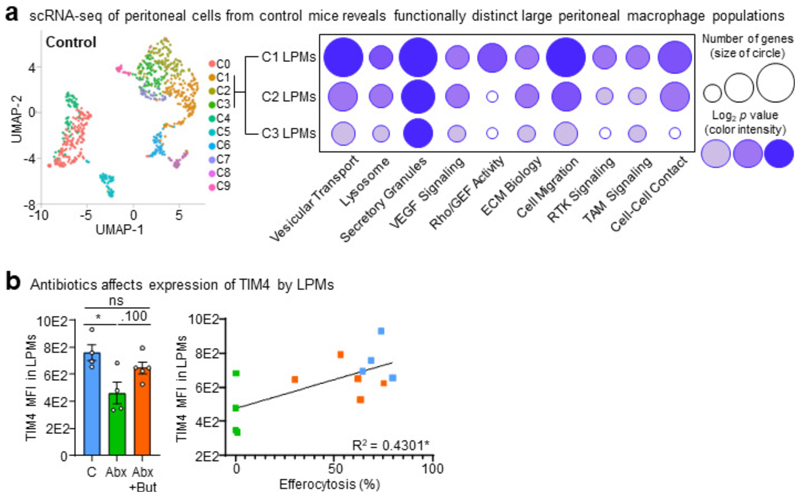
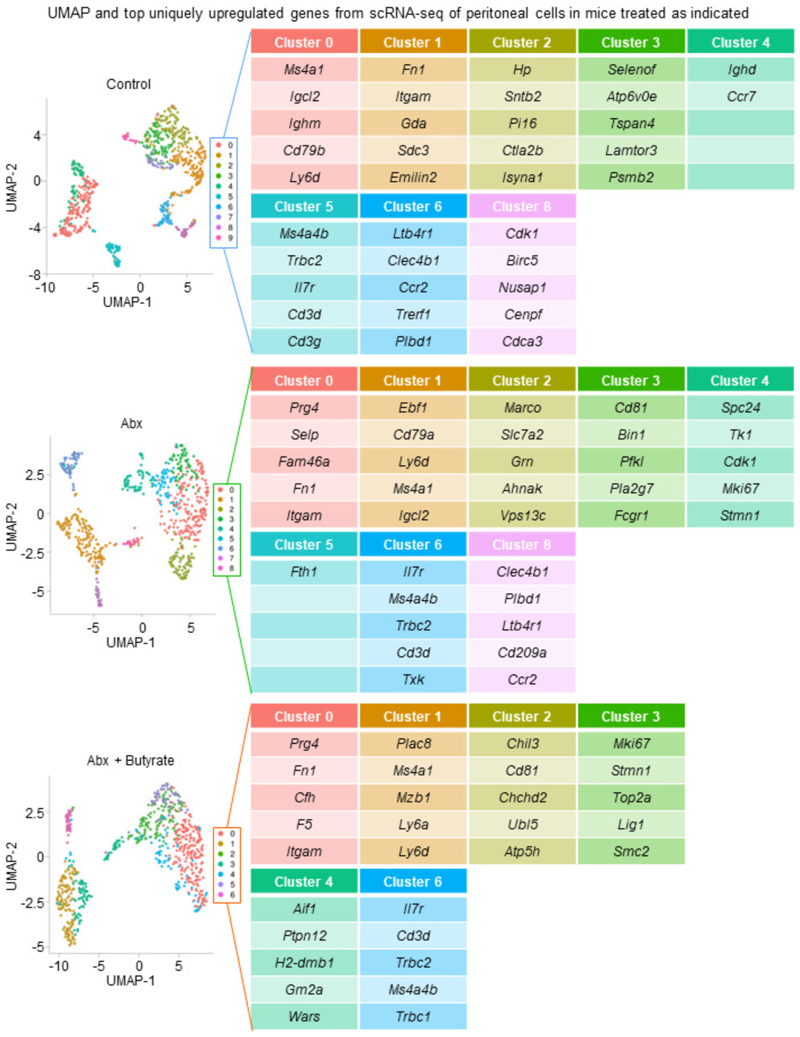
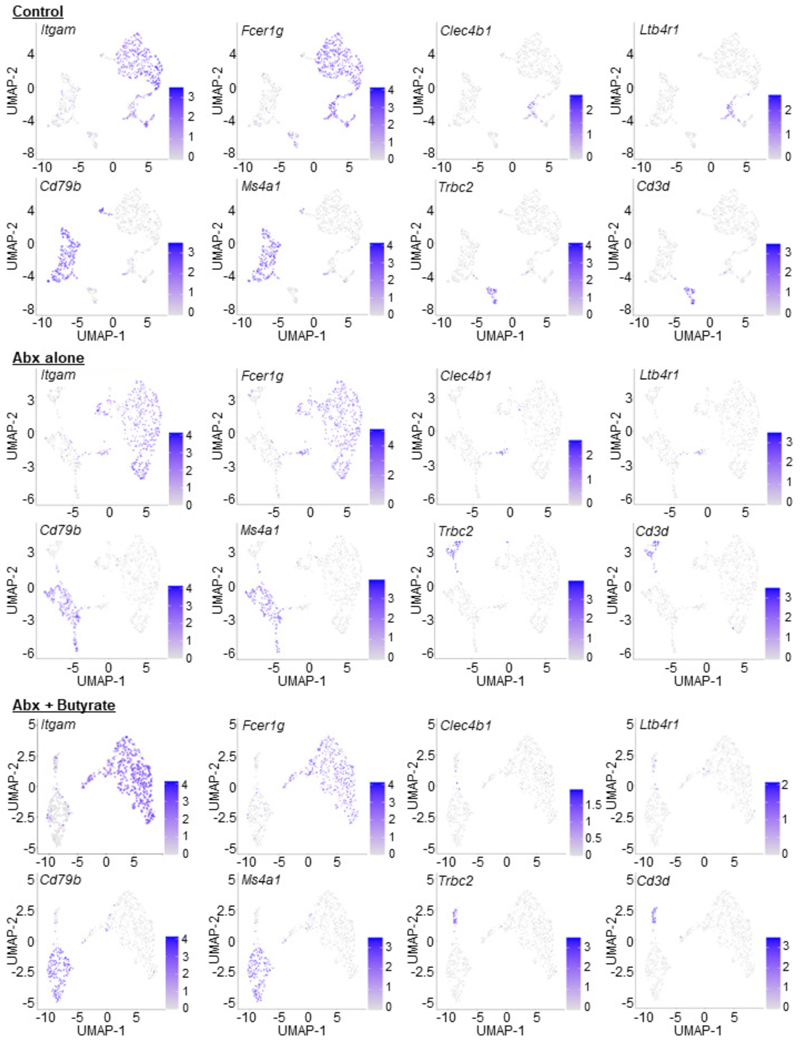
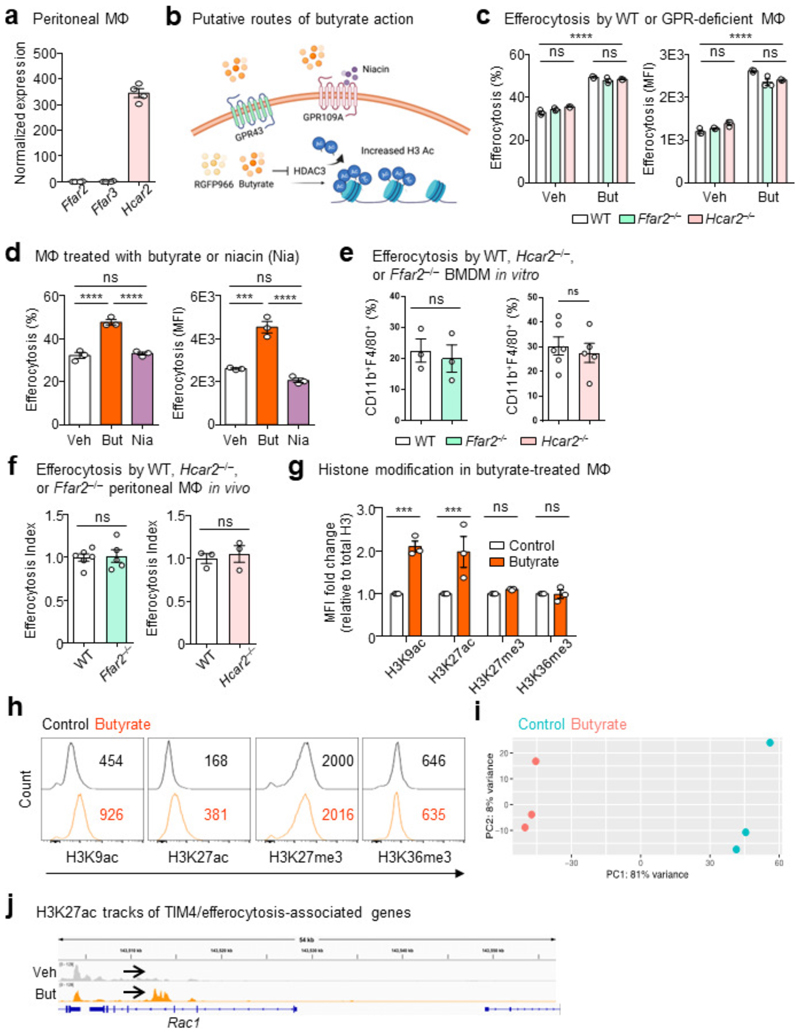
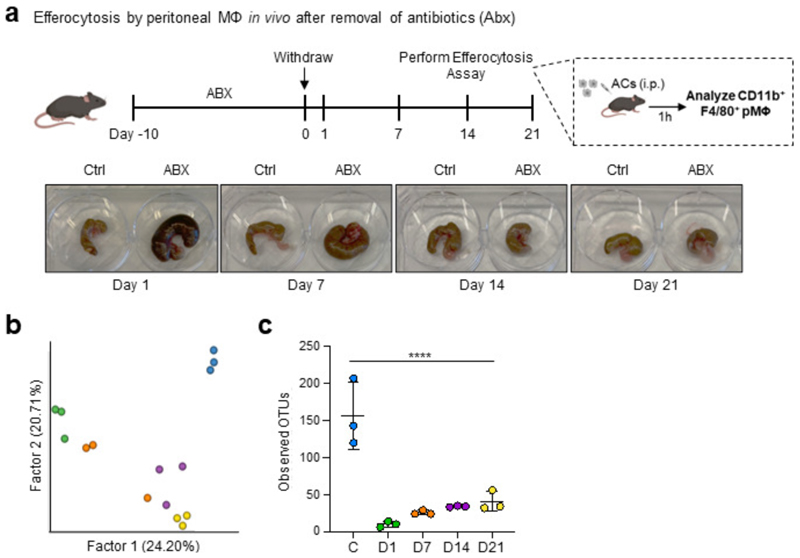
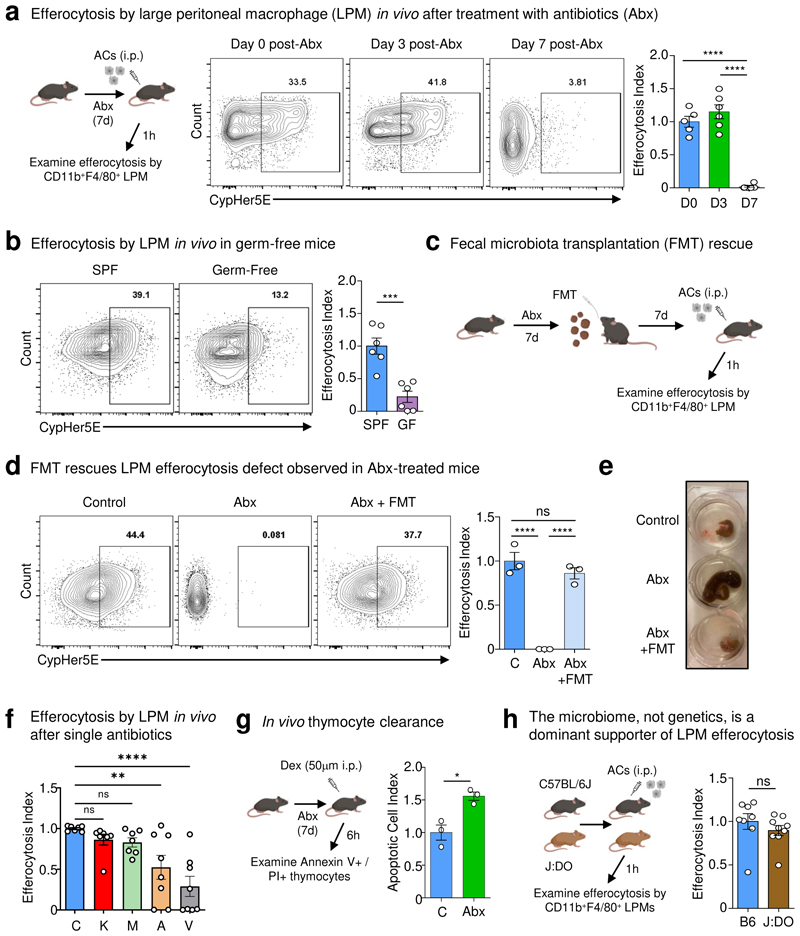
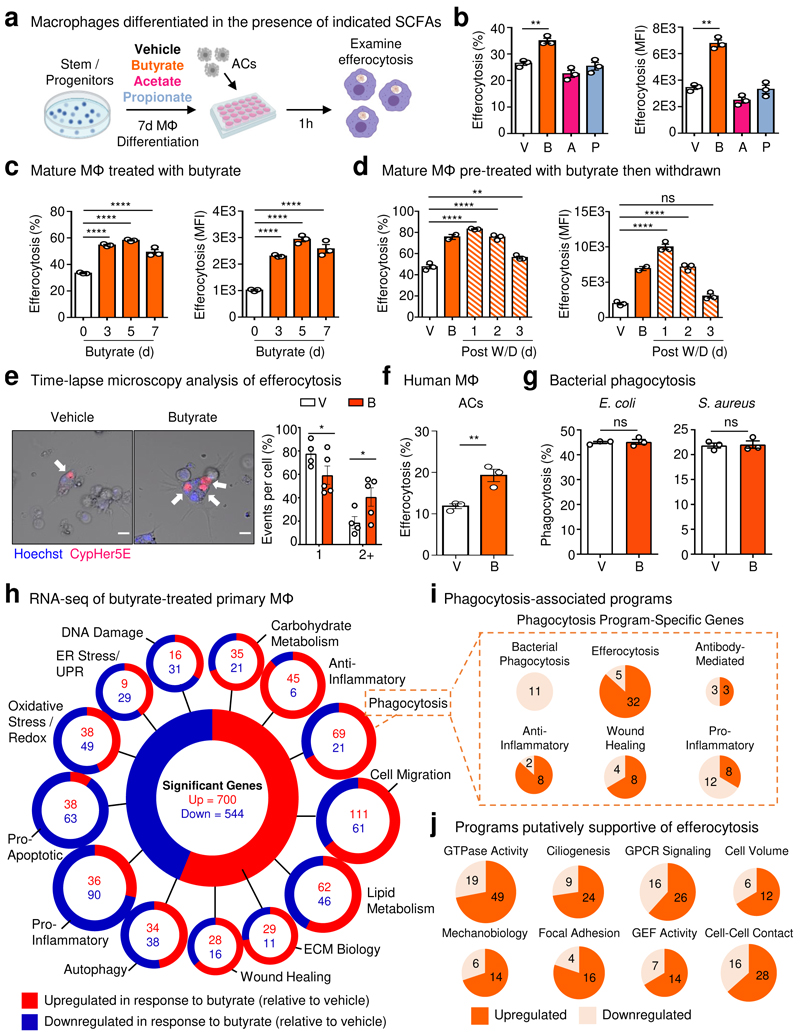
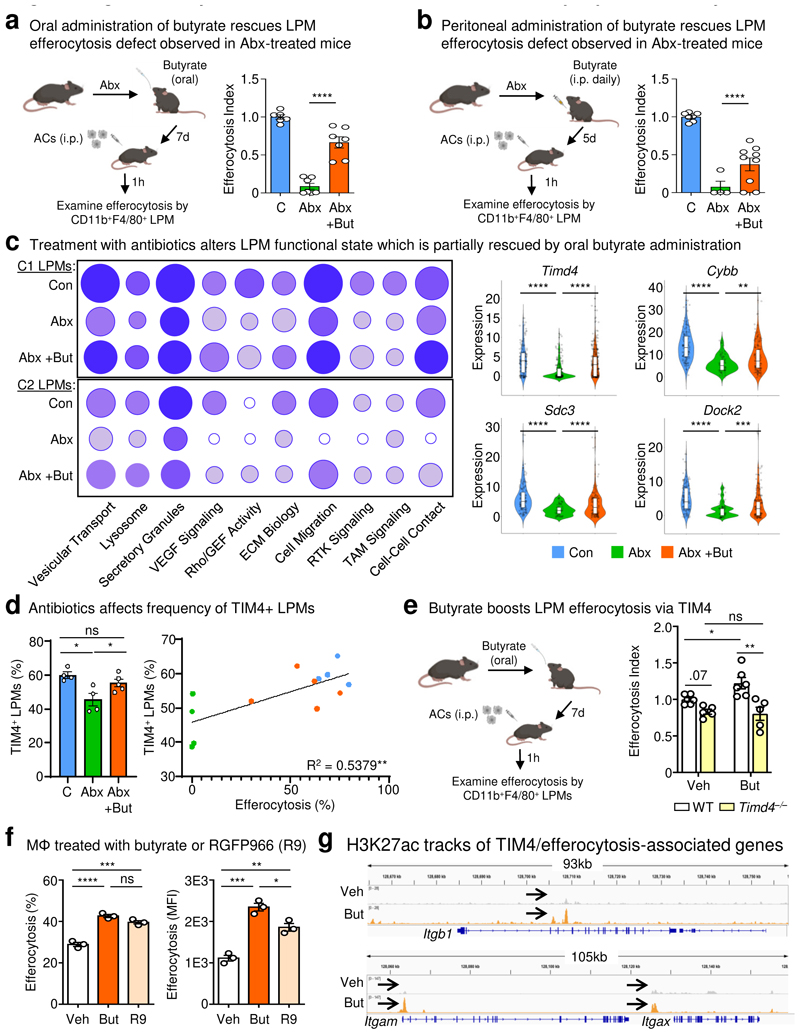
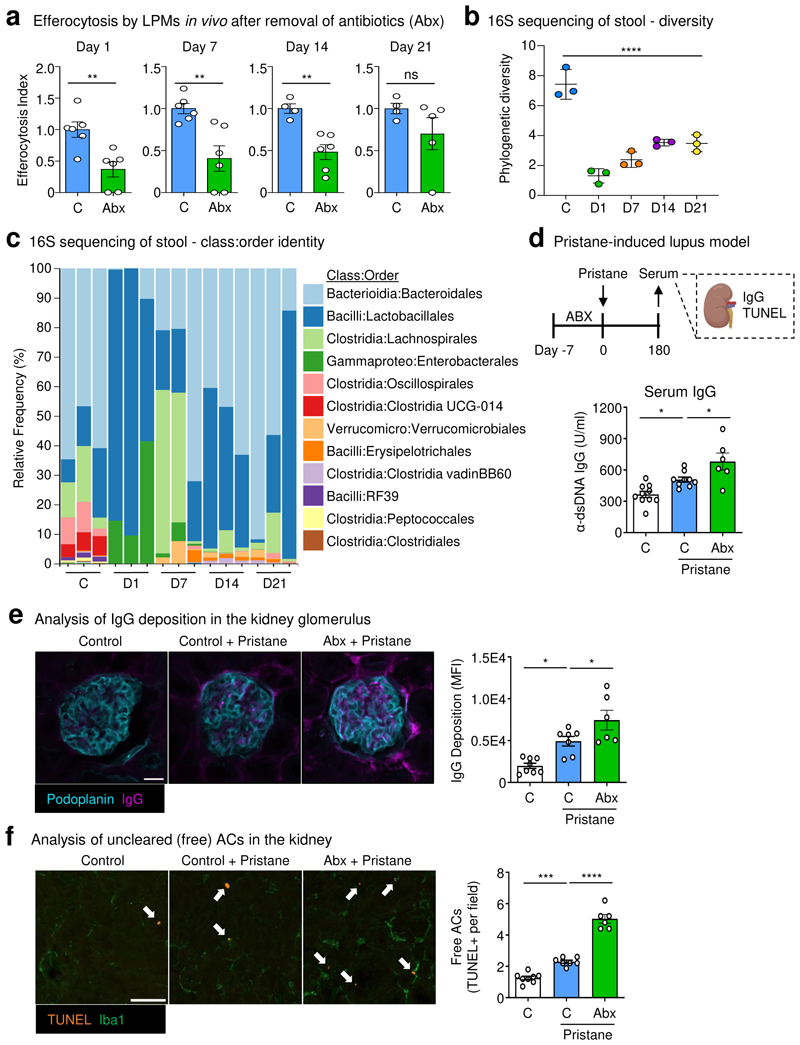
The clearance of apoptotic cells, termed efferocytosis, is essential for tissue homeostasis and prevention of autoimmunity1. Although past studies have elucidated local molecular signals that regulate homeostatic efferocytosis in a tissue2,3, whether signals arising distally also regulate homeostatic efferocytosis remains elusive. Here, we show that large peritoneal macrophage (LPM) display impairs efferocytosis in broad-spectrum antibiotics (ABX)-treated, vancomycin-treated and germ-free mice in vivo, all of which have a depleted gut microbiota. Mechanistically, the microbiota-derived short-chain fatty acid butyrate directly boosts efferocytosis efficiency and capacity in mouse and human macrophages, and rescues ABX-induced LPM efferocytosis defects in vivo. Bulk messenger RNA sequencing of butyrate-treated macrophages in vitro and single-cell messenger RNA sequencing of LPMs isolated from ABX-treated and butyrate-rescued mice reveals regulation of efferocytosis-supportive transcriptional programmes. Specifically, we find that the efferocytosis receptor T cell immunoglobulin and mucin domain containing 4 (TIM-4, Timd4) is downregulated in LPMs of ABX-treated mice but rescued by oral butyrate. We show that TIM-4 is required for the butyrate-induced enhancement of LPM efferocytosis capacity and that LPM efferocytosis is impaired beyond withdrawal of ABX. ABX-treated mice exhibit significantly worse disease in a mouse model of lupus. Our results demonstrate that homeostatic efferocytosis relies on distal metabolic signals and suggest that defective homeostatic efferocytosis may explain the link between ABX use and inflammatory disease4-7.


Conflict of interest statement

Competing interests

J.S.A.P. is a co-founder of Atish Technologies. A.Y.R. is a Scientific Advisory Board member and has equity in Sonoma Biotherapeutics, Santa Ana Bio, RAPT Therapeutics and Vedanta Biosciences. He is a Scientific Executive Board member of Amgen and BioInvent and is a co-inventor or has IP licensed to Takeda that is unrelated to the content of the present study. M.R.M.v.d.B. has received research support and stock options from Seres Therapeutics, and stock options from Notch Therapeutics and Pluto Therapeutics; he has received royalties from Wolters Kluwer; he has consulted, received honorarium from or participated in advisory boards for Seres Therapeutics, Vor Biopharma, Rheos Medicines, Frazier Healthcare Partners, Nektar Therapeutics, Notch Therapeutics, Ceramedix, Lygenesis, Pluto Therapeutics, GlaskoSmithKline, Da Volterra, Thymofox, Garuda, Novartis (Spouse), Synthekine (Spouse), Beigene (Spouse) and Kite (Spouse); he has IP Licensing with Seres Therapeutics and Juno Therapeutics; and he holds a fiduciary role on the Foundation Board of DKMS (a nonprofit organization). Memorial Sloan Kettering has institutional financial interests relative to Seres Therapeutics. The remaining authors declare no competing interests.

Figures

Extended Data Fig. 1
Extended Data Fig. 2
Extended Data Fig. 3
Extended Data Fig. 4
Extended Data Fig. 5
Extended Data Fig. 6
Extended Data Fig. 7
Fig. 1
Fig. 1. The intestinal microbiome supports peripheral efferocytosis.
(a) Mice were treated with antibiotics in drinking water for 0-7d prior to intraperitoneal (i.p.) injection of CypHer5E-labeled apoptotic cells (ACs). After 1h, LPMs (CD11b+F4/80+) were analyzed for efferocytosis efficiency. Shown are efferocytosis efficiency by LPMs in untreated mice (D0, n = 5), in mice after 3d of broad-spectrum antibiotics (D3, n = 6), and in mice after 7d antibiotics (D7, n = 6). Data are from two independent experiments with between two to three mice per experiment. (b) In vivo efferocytosis as in (a), but in specific pathogen-free (SPF) (n = 6) and germ-free (GF) (n = 6) mice. Data are from two independent experiments with three mice per experiment. (c-e) Mice were treated with antibiotics in drinking water for 7d, with some mice receiving fecal microbiota transplantation (FMT) of homogenized stool from SPF mice (c). (d) Efferocytosis efficiency by LPMs in control mice (n = 3), in broad-spectrum antibiotic-treated mice (ABX, n = 3), and in broad-spectrum antibiotic-treated mice supplemented with FMT (ABX+FMT, n = 3). (e) Representative images of the cecum of mice from (d). Data are from two independent experiments with between one to two mice per experiment. (f) Efferocytosis efficiency by LPMs in control (C; n = 7), kanamycin (K; n = 7), metronidazole (M; n=7), ampicillin (A; n = 8), or vancomycin (V; n = 8) treated mice. Data are from two independent experiments with between three to four mice per experiment. (g) AnnexinV+PI+ staining from isolated thymocytes 6h post-dexamethasone (Dex) injection in vehicle (n = 3) or antibiotic-treated mice (n = 3). Data are from three experimental replicates. (h) Efferocytosis by LPMs in C57BL6/J (B6, n = 8) and J:DO (n = 9) mice. Data are from two independent experiments with between four to five mice per experiment. All bar graphs represent means ± s.e.m. Statistics were performed by one-way ANOVA in a, d, and f, two-tailed t-test in b, g and h. *p < .05; **p < .01; ***p < .001. ****p < .0001. ns - not significant. Schematics were created with BioRender.com.
Fig. 2
Fig. 2. Butyrate boosts efferocytosis via induction of efferocytotic transcriptional programs.
(a, b) Bone marrow was differentiated into macrophages in the presence of butyrate, acetate, or propionate (all 1 mM) for 7d (a). Mature macrophages were subsequently incubated with apoptotic cells co-labeled with CypHer5E and CellTrace Yellow (CTY) at a 1:1 ratio for 1h. (b) Efferocytosis efficiency (left, CypHer5E+ macrophages) and capacity (right, CTY median fluorescence intensity, MFI in macrophages). Data are from three independent experiments. (c) Efferocytosis efficiency of mature primary macrophages (left, CypHer5E+ macrophages) and capacity (right, CTY MFI in macrophages). Data are from three independent experiments. (d) Efferocytosis efficiency (left, CypHer5E+ macrophages) and capacity (right, CTY MFI in macrophages) followed by withdrawal of butyrate. Data are from three independent experiments. (e) Time-lapse confocal microscopy analysis of primary macrophages conditioned as in (c) then cultured with CypHer5E-labeled apoptotic cells. Macrophages containing at least one CypHer5E puncta (white arrows) were analyzed for the number of apoptotic cell uptake (CypHer5E+) events occurring. Data is shown as the fraction of the total number of CypHer5E+ events. Scale bar, 10 μm. Data are from three independent experiments. (f) Efferocytosis efficiency by human monocyte-derived primary macrophages (HMDMs) treated with vehicle or butyrate (1 mM) for 3d. Data are from three independent experiments. (g) Phagocytosis efficiency of E. coli (left) or S. aureus (right) by macrophages treated with vehicle or butyrate (1 mM) for 3d. Data are from three independent experiments. (h) RNA sequencing of mature primary macrophages conditioned with vehicle or butyrate (1 mM) for 3d. Data are from three independent experiments. ECM, extracellular matrix. (i,j) Transcripts that were categorized as ‘phagocytosis’ in (h) were further analyzed for additional functional signatures, including specific forms of phagocytosis (i) and putative efferocytosis-associated programs (j). All bar graphs represent means ± s.e.m. Statistics were performed by one-way ANOVA in b, c, and d, two-tailed t-test in e, f and g. *p < .05; **p < .01; ***p < .001. ****p < .0001. ns - not significant. Schematics were created with BioRender.com.
Fig. 3
Fig. 3. Exogenous butyrate rescues broad-spectrum antibiotic-induced defects in LPM efferocytosis.
(a) LPMs efferocytosis efficiency in control mice (n = 6), in mice treated with ABX (ABX, n = 7), and in mice with ABX supplemented with butyrate (150 mM) in drinking water (ABX+But, n = 7). Data are from two independent experiment with three to four mice per experiment. (b) LPMs efferocytosis efficiency in control mice (n = 7), mice treated with ABX (ABX, n = 4), and in mice treated with ABX supplemented with i.p. butyrate (40 mM) (ABX+But, n = 9). Data are from two independent experiments with two to five mice per experiment. (c) Functional programs enriched in clusters C1 and C2 LPMs (left) and representative genes (right) identified by single cell RNA-seq analysis of peritoneal cells from control mice (n = 127), mice treated with ABX (n = 59), and mice treated with ABX and oral butyrate (n = 132). (d) Expression of the efferocytosis receptor TIM4 in efferocytotic LPMs treated as in (a). Percentage of TIM4+ LPMs (left) and XY plot showing the linear correlation between the percentage of TIM4+ LPMs and efferocytosis capacity (right). (e) LPMs efferocytosis efficiency from wildtype (WT) or TIM4-deficient (Timd4–/–) mice supplemented with oral butyrate (150 mM). Untreated wildtype (n = 6), untreated TIM4-deficient (n = 5), butyrate-treated wildtype (n = 6), and butyrate-treated TIM4-deficient (n = 5). Data are from two independent experiment with two to three mice per experiment. (f) Efferocytosis efficiency (left) and capacity (right) by mature primary macrophages conditioned with vehicle, butyrate (1 mM), or RGFP966 (R9; 20 µM) for 3d. Data are from three independent experiments. (g) Chromatin immunoprecipitation sequencing (CHIPseq) of H3K27 acetylation (H3K27ac) DNA binding sites. Comparison of H3K27ac CUT&RUN tracks generated from macrophages treated with butyrate (orange) or a vehicle control (grey). Comparisons for three significantly differential peaks associated with TIM4/efferocytosis related genes are shown. Data are from three independent experiments. All bar graphs represent means ± s.e.m. Statistics were performed by one-way ANOVA in a, b, d, and f, two-way ANOVA in e. *p < .05; **p < .01; ***p < .001. ****p < .0001. ns - not significant. Schematics were created with BioRender.com.
Fig. 4
Fig. 4. Treatment with antibiotics induces prolonged peripheral efferocytosis defects.
(a) Mice were treated with broad-spectrum antibiotics (ABX) in drinking water for 10d then back on normal drinking water. On indicated days post-ABX withdrawal, LPMs were analyzed for efferocytosis efficiency. Data are from day 1 (control n = 6, ABX n = 6), day 7 (control n = 6, ABX = 6), day 14 (control n = 4, ABX = 6), and day 21 (control = 4, ABX = 5) post-ABX withdrawal across two independent experiments. (b, c) 16S sequencing analysis of mouse stool from experiments performed in (a). Shown is the Faith’s phylogenetic (alpha) diversity (n = 3) (b) and the relative frequency of key bacterial orders (c). Data are from three biological replicates. (d-f) Control or ABX-treated mice were injected with a single dose of pristane (500 µL per mouse) and monitored. On day 180 post-pristane injection, serum and tissues were collected and analyzed. (d) α-dsDNA IgG quantification in the serum of untreated mice (n = 10), control & pristane-treated mice (n = 9), and ABX-treated & pristane-treated mice (n = 6). (e) Representative immunofluorescence (IF) images (left) and summary plot of the analysis of α-dsDNA IgG deposition in the kidney glomerulus of untreated mice (n = 8), control & pristane-treated mice (n = 7), and ABX-treated & pristane-treated mice (n = 6). (f) Representative IF images (left) and summary plot of the analysis of apoptotic cells using terminal deoxynucleotidyl transferase biotin-dUTP nick end labeling (TUNEL) in the kidney of untreated mice (n = 8), control & pristane-treated mice (n = 7), and ABX-treated & pristane-treated mice (n = 6). White arrows indicate uncleared apoptotic cells (TUNEL+ events), e.g., TUNEL+ events not touching Iba1+ macrophages. Scale bars are 20 µm (e) and 50 µm (f). All bar graphs represent means ± s.e.m. Statistics were performed by two-tailed t-test in a, one-way ANOVA in b, d, e and f. *p < .05; **p < .01; ***p < .001. ****p < .0001. ns - not significant. Schematics were created with BioRender.com.

References

    1. Sender R, Milo R. The distribution of cellular turnover in the human body. Nature Medicine. 2021;27:45–48. 2021 27:1. - PubMed
    1. Morioka S, Maueröder C, Ravichandran KS. Living on the Edge: Efferocytosis at the Interface of Homeostasis and Pathology. Immunity. 2019 doi: 10.1016/j.immuni.2019.04.018. - DOI - PMC - PubMed
    1. Doran AC, Yurdagul A, Tabas I. Efferocytosis in health and disease. Nature Reviews Immunology. 2020;20:254–267. doi: 10.1038/s41577-019-0240-6. - DOI - PMC - PubMed
    1. Norgaard M, et al. Use of Penicillin and Other Antibiotics and Risk of Multiple Sclerosis: A Population-based Case-Control Study. American Journal of Epidemiology. 2011;174:945–948. - PubMed
    1. Canova C, et al. Association of Maternal Education, Early Infections, and Antibiotic Use With Celiac Disease: A Population-Based Birth Cohort Study in Northeastern Italy. American Journal of Epidemiology. 2014;180:76–85. - PubMed