. 2024 Sep;16(9):2132-2145.
doi: 10.1038/s44321-024-00102-5. Epub 2024 Aug 9.

Comprehensive molecular characterization of collecting duct carcinoma for therapeutic vulnerability

Affiliations

Comprehensive molecular characterization of collecting duct carcinoma for therapeutic vulnerability

Peiyong Guan et al. EMBO Mol Med. 2024 Sep.

Abstract

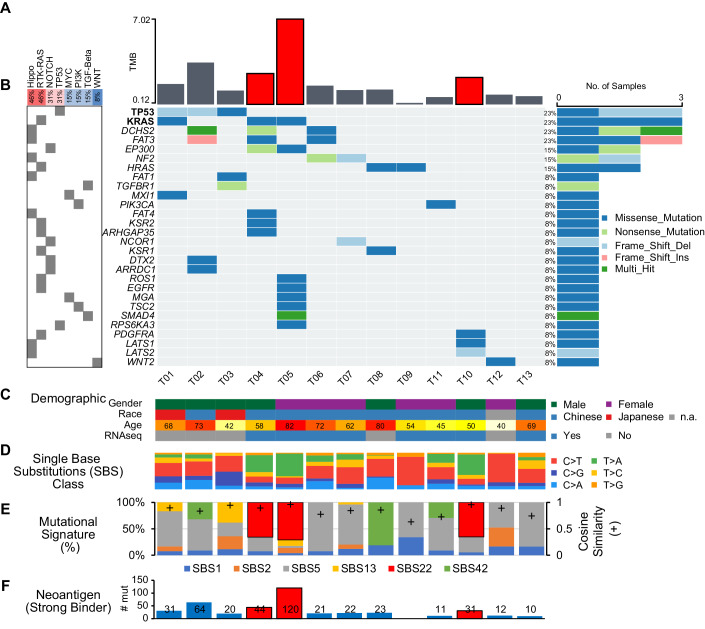
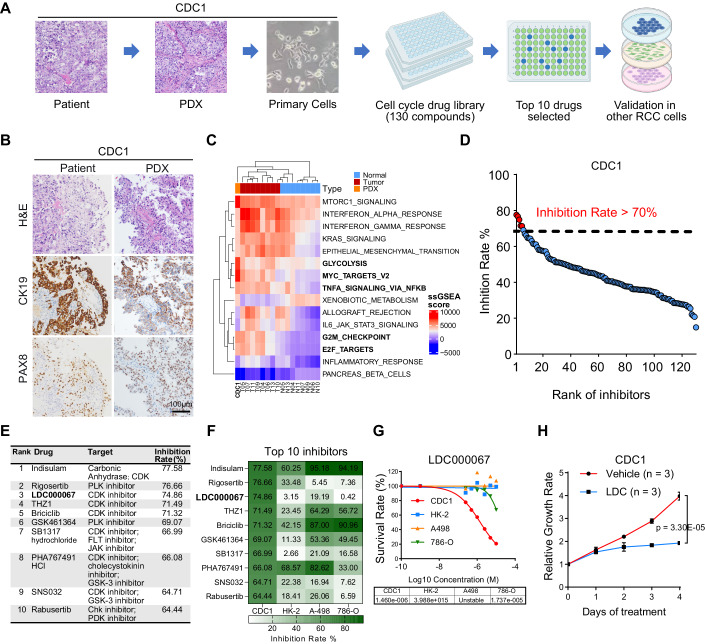
Collecting duct carcinoma (CDC) is an aggressive rare subtype of kidney cancer with unmet clinical needs. Little is known about its underlying molecular alterations and etiology, primarily due to its rarity, and lack of preclinical models. This study aims to comprehensively characterize molecular alterations in CDC and identify its therapeutic vulnerabilities. Through whole-exome and transcriptome sequencing, we identified KRAS hotspot mutations (G12A/D/V) in 3/13 (23%) of the patients, in addition to known TP53, NF2 mutations. 3/13 (23%) patients carried a mutational signature (SBS22) caused by aristolochic acid (AA) exposures, known to be more prevalent in Asia, highlighting a geologically specific disease etiology. We further discovered that cell cycle-related pathways were the most predominantly dysregulated pathways. Our drug screening with our newly established CDC preclinical models identified a CDK9 inhibitor LDC000067 that specifically inhibited CDC tumor growth and prolonged survival. Our study not only improved our understanding of oncogenic molecular alterations of Asian CDC, but also identified cell-cycle machinery as a therapeutic vulnerability, laying the foundation for clinical trials to treat patients with such aggressive cancer.

Keywords: Cell-Cycle Machinery; Collecting Duct Carcinoma; Drug Screening; Transcriptome Profiling; Whole Exome Sequencing.


Conflict of interest statement

The authors declare no competing interest.

Figures

Figure 1
Figure 1. Genomic landscape of collecting duct carcinoma.
(A) Tumor mutation burden (TMB). (B) Mutations in oncogenic pathways and percentage of samples in which the pathways are mutated in (left). (C) Demographic information of the patients. (D) Single base substitutions (SBS) Class. (E) Mutational signature (%) in each patient. Cosine similarity: accuracy metric between 0 and 1 for the reconstruction of the original mutational catalog. (F) Neoantigen (strong binder) prediction. Source data are available online for this figure.
Figure 2
Figure 2. Genomic mutation and associated transcriptomic alteration inform precision therapy.
(A) Overlapping of patients with different oncogenic mutations. Numbers in brackets indicate the number of cases with matched RNA-seq data. (B) Gene set enrichment analysis (GSEA), comparing Hippo pathway mutant (mut) and wild-type (wt) samples. (C) Enrichment of differentially expressed genes between Hippo mut, Hippo wt tumor, and normal samples. Hypergeometric test with Benjamini–Hochberg (BH) adjustment, where reference background is the total number of genes in the Hallmark collection. (D) Enrichment of differentially expressed genes between RTK-RAS pathway mutant (mut) and wild-type (wt) samples, as well as normal samples. Hypergeometric test with Benjamini–Hochberg (BH) adjustment, where reference background is the total number of genes in the Hallmark collection. (E) Heatmap showing expression levels of genes upregulated in HALLMARK_KRAS_SIGNALING_UP gene set, comparing RTK-RAS mutant (mut) with wild-type (wt) tumors. (F) Kaplan–Meier plot based on KRAS genotype (wt: patients with wild-type KRAS, n = 6; mut, patients with KRAS mutation, n = 2). P value: log-rank test. (G) Whole transcriptome of AA-positive (+) and AA-negative (−) samples. Dist.: Poisson dissimilarity matrix. (H) Enrichment of differentially expressed genes between AA-positive (+), AA-negative (−) and normal samples. Hypergeometric test with Benjamini–Hochberg (BH) adjustment, where reference background is the total number of genes in the Hallmark collection. (I) Cell type enrichment analysis. Only those showed significant differences between AA-positive (n = 2) and AA-negative (n = 3) samples are shown (one tail t-test, p value ≤0.05). p = 1.37E-02, 1.50E-02, 1.17E-04, and 1.04E-02 for CD8+ naive T-cells, Epithelial cells, Keratinocytes, and Th1 cells respectively. Source data are available online for this figure.
Figure 3
Figure 3. Identifying drivers for CDC tumorigenesis by transcriptomic profiling.
(A) Principal component analysis (PCA) of Asian cohort (n = 8 pairs). (B) Gene set enrichment analysis (GSEA), top five enriched Hallmark pathways shown. (C) Correlation of log2 fold changes (log2FC) in Asian cohort and Msaouel Caucasian cohort. R: Pearson correlation coefficient; p < 2.2E-16: correlation test p value. (D) Overlapping of differentially expressed genes in Asian cohort and Msaouel Caucasian cohort. Cutoff values: p value ≤0.01 and |log2FC|≥ 2. P values for overlapping of up-/down-regulated genes in Asian and Caucasian cohorts <2.2E-16, Fisher’s Exact Test. (E) Correlation coefficient (Spearman, squared) of the z-score normalized gene expression levels of commonly upregulated genes. (F) Correlation coefficient (Spearman, squared) of the z-score normalized gene expression levels of commonly downregulated genes. (G) Gene ontology analysis for commonly upregulated gene clusters. (H) Gene ontology analysis for commonly downregulated genes. (I) Subcategorizing commonly upregulated cell cycle genes into different processes. (JL) Real-time qRT-PCR (real-time quantitative reverse transcription PCR) validation of selected genes, AURKB, CDC45, and TPX2. For each sample, data were representative of three independent experiments. Data were presented as the mean ± SD. P value: paired t-test of average log2 of relative mRNA level (n = 3). Source data are available online for this figure.
Figure 4
Figure 4. CDK9 inhibitor LDC000067 specifically suppressed CDC rather than other RCC.
(A) Workflow for establishing PDX and primary cell line; and screening for potential drug targets. (B) Hematoxylin and eosin (H&E), CK19, and PAX8 staining of CDC1 patient and PDX samples. (C) Single-sample GSEA (ssGSEA) score for all RNA-seq samples. The top 15 cell types (ranked by the variance of ssGSEA scores) are shown. CDC1 (PDX) clusters together with tumors, different from normal samples. (D) Overall ranking of the 130 small molecule compounds in the drug library by their inhibition rates. (E) Top ten drug candidates with the highest inhibition rates. (F) Testing of the top ten drug candidates at 1 µM concentration in clear cell RCC cell lines (A-498 and 786-O) and normal immortalized kidney cell line (HK-2). (G) Dosage-dependent response of CDC1 to CDK9 inhibitor LDC000067 and its IC50s for different cell lines. The cells were treated with LDC000067 for 96 h. (H) Relative growth rate of CDC1 when treated with LDC000067 at 1 µM concentration. Data were presented as the mean ± SD (n = 3). P value = 3.30E-05, two-way ANOVA. Source data are available online for this figure.
Figure 5
Figure 5. CDK9 inhibitor LDC000067 prolonged the survival in the CDC PDX model.
(A) Tumor volumes for CDC PDX models treated with vehicle control (n = 9 mice) or CDK9 inhibitor LDC000067 (LDC, n = 10 mice) (p value = 1.1E-07, two-way ANOVA). Data were presented as the mean ± SD. (B) Survival analysis for mice treated with LDC (n = 10 mice), compared with those treated with vehicle control (n = 9 mice) (p value = 3.00E-06, log-rank test). (C) Body weight of the CDC1 PDXs. Vehicle control (n = 9 mice) and LDC (n = 10 mice). Data were presented as the mean ± SD. (D) Ki67, p-AURKA, TPX2, and p-RB1 staining of selected PDX tumors treated with vehicle control or LDC. (EH) Ki67 positive cells per area, a staining score of p-AURKA, TPX2, and p-RB1 respectively, comparing PDX tumors treated with vehicle control or LDC (n = 5 mice, two-sided t-test, equal variance). Source data are available online for this figure.

References

    1. Alexandrov LB, Kim J, Haradhvala NJ, Huang MN, Tian Ng AW, Wu Y, Boot A, Covington KR, Gordenin DA, Bergstrom EN et al (2020) The repertoire of mutational signatures in human cancer. Nature 578:94–101 10.1038/s41586-020-1943-3 - DOI - PMC - PubMed
    1. Aran D, Hu Z, Butte AJ (2017) xCell: digitally portraying the tissue cellular heterogeneity landscape. Genome Biol 18:220 10.1186/s13059-017-1349-1 - DOI - PMC - PubMed
    1. Barbie DA, Tamayo P, Boehm JS, Kim SY, Moody SE, Dunn IF, Schinzel AC, Sandy P, Meylan E, Scholl C et al (2009) Systematic RNA interference reveals that oncogenic KRAS-driven cancers require TBK1. Nature 462:108–112 10.1038/nature08460 - DOI - PMC - PubMed
    1. Bratslavsky G, Gleicher S, Jacob JM, Sanford TH, Shapiro O, Bourboulia D, Gay LM, Andrea Elvin J, Vergilio JA, Suh J et al (2021) Comprehensive genomic profiling of metastatic collecting duct carcinoma, renal medullary carcinoma, and clear cell renal cell carcinoma. Urol Oncol 39:367 e361–367.e365 10.1016/j.urolonc.2020.12.009 - DOI - PubMed
    1. Canon J, Rex K, Saiki AY, Mohr C, Cooke K, Bagal D, Gaida K, Holt T, Knutson CG, Koppada N et al (2019) The clinical KRAS(G12C) inhibitor AMG 510 drives anti-tumour immunity. Nature 575:217–223 10.1038/s41586-019-1694-1 - DOI - PubMed

MeSH terms