. 2024 Dec;30(12):3482-3494.
doi: 10.1038/s41591-024-03011-9. Epub 2024 Aug 9.

Single-nucleus chromatin accessibility and transcriptomic map of breast tissues of women of diverse genetic ancestry

Affiliations

Single-nucleus chromatin accessibility and transcriptomic map of breast tissues of women of diverse genetic ancestry

Poornima Bhat-Nakshatri et al. Nat Med. 2024 Dec.

Erratum in

Abstract

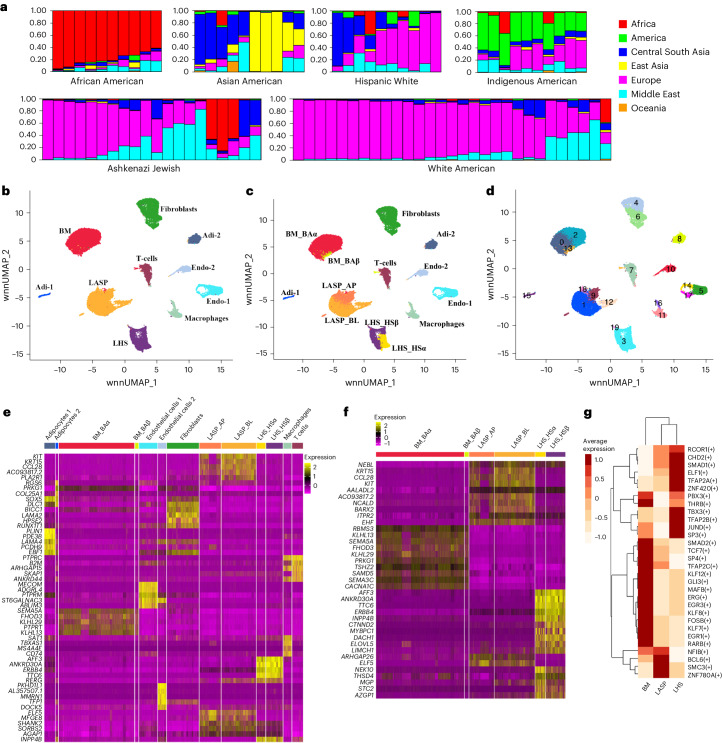
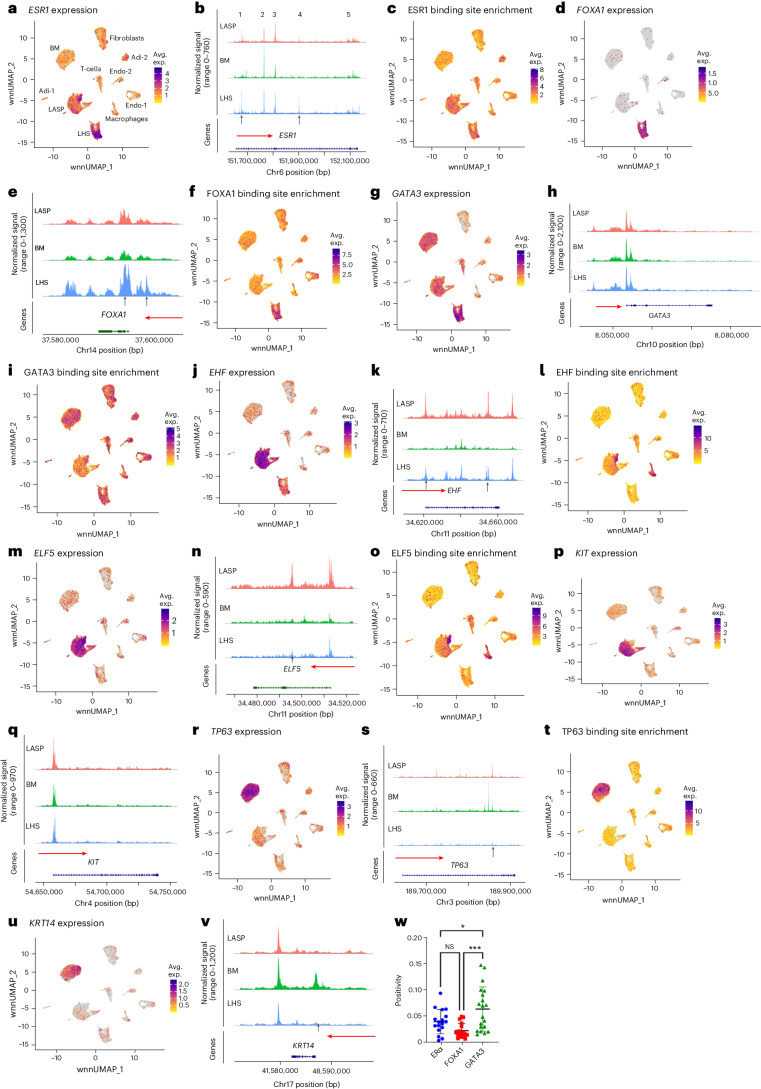
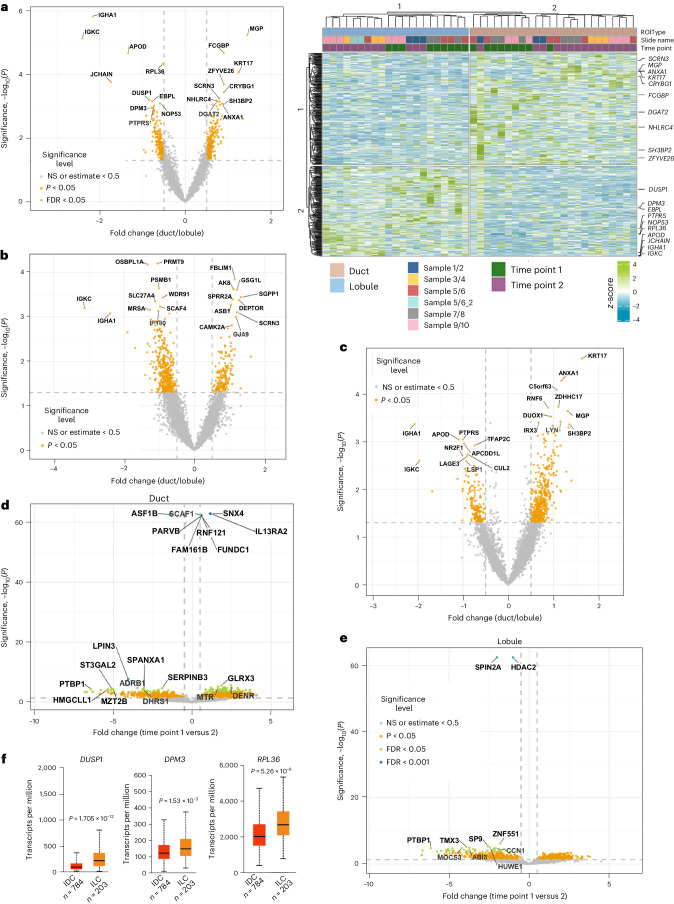
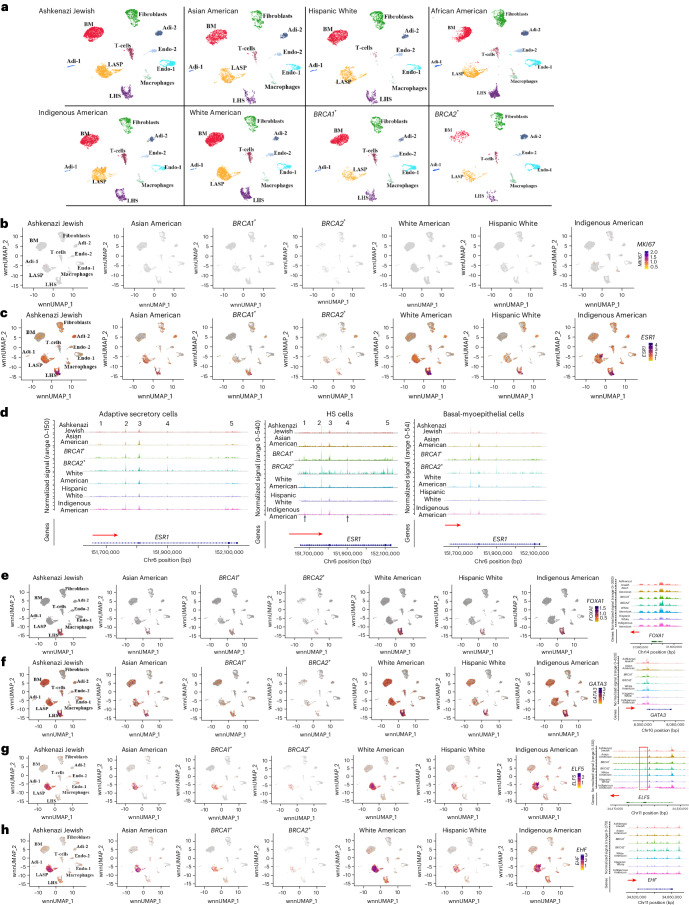
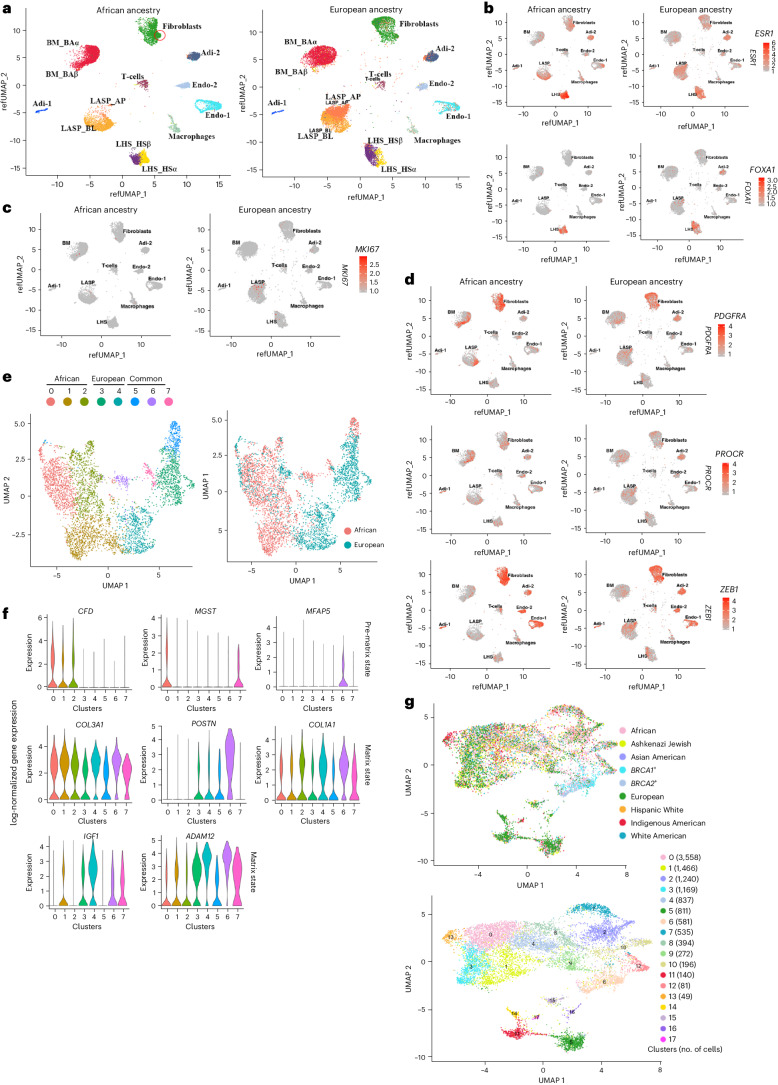
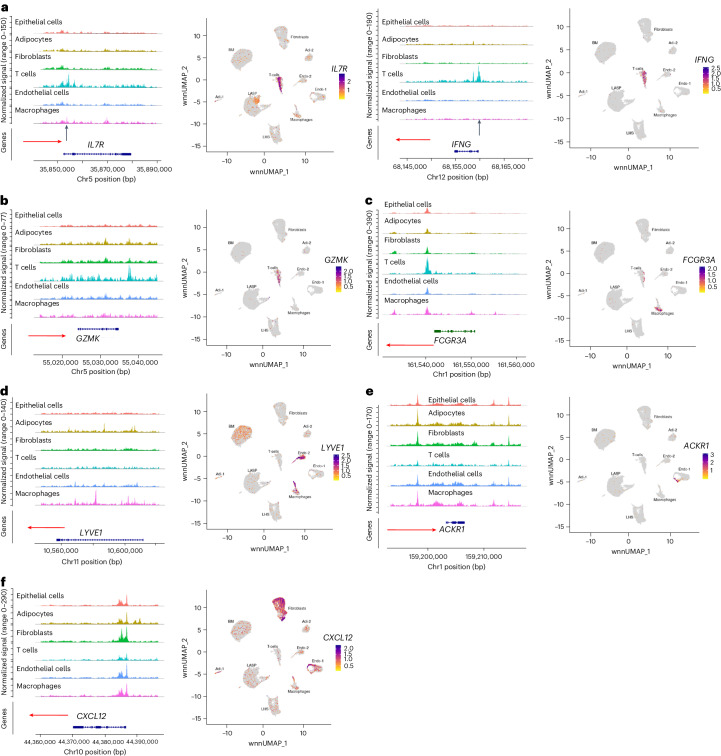
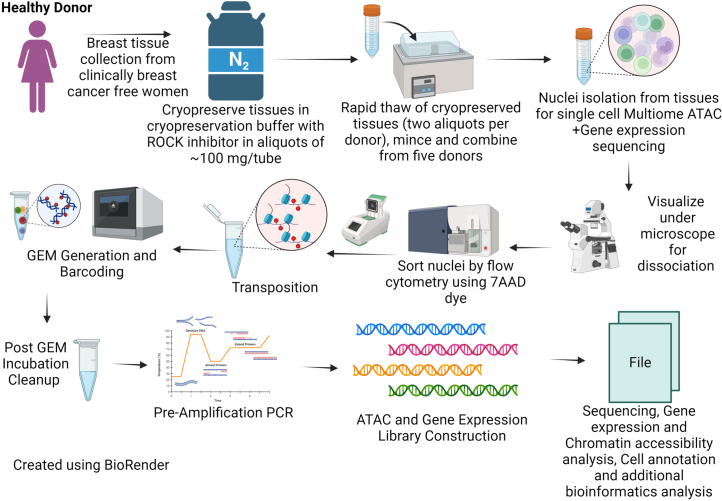
Single-nucleus analysis allows robust cell-type classification and helps to establish relationships between chromatin accessibility and cell-type-specific gene expression. Here, using samples from 92 women of several genetic ancestries, we developed a comprehensive chromatin accessibility and gene expression atlas of the breast tissue. Integrated analysis revealed ten distinct cell types, including three major epithelial subtypes (luminal hormone sensing, luminal adaptive secretory precursor (LASP) and basal-myoepithelial), two endothelial and adipocyte subtypes, fibroblasts, T cells, and macrophages. In addition to the known cell identity genes FOXA1 (luminal hormone sensing), EHF and ELF5 (LASP), TP63 and KRT14 (basal-myoepithelial), epithelial subtypes displayed several uncharacterized markers and inferred gene regulatory networks. By integrating breast epithelial cell gene expression signatures with spatial transcriptomics, we identified gene expression and signaling differences between lobular and ductal epithelial cells and age-associated changes in signaling networks. LASP cells and fibroblasts showed genetic ancestry-dependent variability. An estrogen receptor-positive subpopulation of LASP cells with alveolar progenitor cell state was enriched in women of Indigenous American ancestry. Fibroblasts from breast tissues of women of African and European ancestry clustered differently, with accompanying gene expression differences. Collectively, these data provide a vital resource for further exploring genetic ancestry-dependent variability in healthy breast biology.


Conflict of interest statement

Competing interests: The authors declare no competing interests.

Figures

Fig. 1
Fig. 1. Integrated snATAC-seq and snRNA-seq analyses of breast issues of healthy women.
a, Genetic ancestry marker distribution pattern among donors of self-identified ethnicity groups. b, Integrated cell clusters generated using snATAC-seq and snRNA-seq data representing all donors except women of African ancestry. Adi, adipocytes; Endo, endothelial. c, Breast epithelial cells could be further subclassified into six different cell types: BM_BAα, BM_BAβ, LASP alveolar progenitor, LASP_BL, LHS_HSα and LHS_HSβ. d, Cell clustering analyses revealed further refinement of cell state of LASP cells, fibroblasts and endothelial cells. e, Heatmap of top DEGs in each cell type shown in c. f, Heatmap of the top DEGs in the epithelial subtypes. g, Top regulons identified by SCENIC in each epithelial subtype using integrated snATAC-seq and snRNA-seq data. Source data
Fig. 2
Fig. 2. FOXA1, EHF, ELF5, TP63 and KRT14 show epithelial subtype-enriched expression and chromatin accessibility.
a, ESR1 expression pattern in several cell types of the breast. Avg. exp., average expression. b, ESR1 gene chromatin accessibility patterns in LHS, LASP and BM cells. The horizontal red arrow marks the direction of transcription from the indicated gene. The vertical arrow denotes cell-type-specific chromatin-accessible regions. The number of accessible regions is indicated (1–5). c, ESR1 binding site enrichment pattern in chromatin-accessible regions. d, FOXA1 was expressed mostly in LHS cells. e, FOXA1 gene chromatin accessibility patterns in LHS, LASP and BM cells. f, FOXA1 binding site enrichment pattern in chromatin-accessible regions of several cell types. g, GATA3 was expressed in all three major epithelial subtypes, with prominent expression in LHS cells. h, GATA3 gene chromatin accessibility patterns in LHS, LASP and BM cells. i, GATA3 binding site enrichment pattern in chromatin-accessible regions of several cell types. j, EHF was expressed mostly in LASP cells. k, EHF gene chromatin accessibility patterns in LHS, LASP and BM cells. l, EHF binding site enrichment pattern in chromatin-accessible regions of several cell types. m, ELF5 was expressed mostly in LASP cells. n, ELF5 gene chromatin accessibility patterns in LHS, LASP and BM cells. o, ELF5 binding site enrichment pattern in chromatin-accessible regions of several cell types. p, Expression pattern of KIT in several cell types. q, KIT gene chromatin accessibility in LHS, LASP and BM cells. r, TP63 was expressed mostly in BM cells. s, TP63 gene chromatin accessibility patterns in LHS, LASP and BM cells. t, TP63 binding site enrichment pattern in chromatin-accessible regions of several cell types. u, KRT14 was expressed predominantly in BM cells. v, KRT14 gene chromatin accessibility patterns in LHS, LASP and BM cells. w, Positivity patterns of nuclei in ducts and lobules in the breast tissues of healthy donors for ERα (n = 17), FOXA1 (n = 18) and GATA3 (n = 20), as determined using IHC. Positivity scores were compared using a one-way ANOVA, followed by Tukey’s test for multiple comparisons. Data are presented as the mean ± s.d. *P = 0.0453; ***P = 0.0002. NS, not significant (P = 0.2018). Samples are biologically independent.
Fig. 3
Fig. 3. Spatial transcriptomics reveal gene expression differences between ductal and lobular epithelial cells.
a, Left: volcano plot showing gene expression differences between lobular and ductal epithelial cells of all samples combined. Right: heatmap showing genes differentially expressed in the ductal and lobular epithelial cells of individual donors. Each sample is in pairs from the same donors collected twice 10 years apart. b, Gene expression differences between ductal and lobular epithelial cells of all samples combined at time point 1 (n = 3). Those on the left were enriched in lobular epithelial cells, whereas those on the right were enriched in ductal epithelial cells. c, Gene expression differences in ductal and lobular epithelial cells of all samples combined at time point 2 (n = 5). d, Gene expression differences in ductal epithelial cells of sample number 3 between time points 1 and 2. Those on the left were enriched at time point 1, whereas those on the right were enriched at time point 2. e, Gene expression differences in lobular epithelial cells of sample number 3 between time points 1 and 2. The statistical significance of spatial transcriptomics data was calculated with the R package ImerTest using the least squares means method. f, DUSP1, DPM3 and RPL36 were expressed at a higher level in lobular carcinomas compared to ductal carcinomas of the breast. The TCGA dataset was used for this analysis. Statistical significance was derived using an unpaired t-test. Samples used were biologically independent. DUSP1 (infiltrating ductal carcinoma (IDC): n = 784; low 8.803, first quartile (Q1) 49.273; median 89.037, third quartile (Q3) 149.567; high 359.698; infiltrating lobular carcinoma (ILC): n = 203; low 6.165, Q1 110.845; median 206.213, Q3 349.685; high 793.39), DPM3 (IDC: n = 784; low 6.872, Q1 85.851; median 117.469, Q3 167.43; high 321.213; ILC: n = 203; low 25.637, Q1 104.213; median 143.894, Q3 202.602; high 369.928), RPL36 (IDC: n = 784; low 390.827, Q1 1506.467; median 2001.37, Q3 2669.19; high 4675.837; ILC: n = 203; low 758.972, Q1 2072.142; median 2648.138, Q3 3373.037; high 5322.998).
Fig. 4
Fig. 4. Genetic ancestry-dependent variability in cell state.
a, Cell clustering in each group based on integrated snATAC-seq and snRNA-seq analyses. b, Expression pattern of the cell proliferation marker MKI67. c, ESR1 expression showed genetic ancestry-dependent variability with a subpopulation of LASP cells in Indigenous Americans expressing ESR1. d, ESR1 gene chromatin accessibility patterns in LHS, LASP and BM cells of various genetic ancestry groups, and BRCA1 and BRCA2 mutation carriers. e, FOXA1 expression and FOXA1 gene chromatin accessibility patterns in several genetic ancestry groups, and BRCA1 and BRCA2 mutation carriers. f, GATA3 expression and chromatin accessibility patterns in several genetic ancestry groups, and BRCA1 and BRCA2 mutation carriers. g, ELF5 expression and chromatin accessibility patterns in several genetic ancestry groups, and BRCA1 and BRCA2 mutation carriers. The red vertical box shows a chromatin-accessible peak unique to the cells of the BRCA2 mutation carrier. h, EHF expression and chromatin accessibility patterns in several genetic ancestry groups, and BRCA1 and BRCA2 mutation carriers.
Fig. 5
Fig. 5. Comparative analyses of the breast tissues of women of African ancestry with women of European ancestry using snRNA-seq.
a, Fibroblasts and epithelial cells of the breast tissue cluster were different in women of African ancestry compared to women of European ancestry. b, ESR1 and FOXA1 expression patterns in epithelial cell clusters of women of African and European ancestry. As with the multiome data, FOXA1 expression was restricted to LHS cells and ESR1 expression was higher in LHS cells compared to LASP cells in both groups. c, MKI67 expression patterns in the breast tissues of women of African and European ancestry. d, PROCR, ZEB1 and PDGFRα expression patterns in the breast tissues of women of African and European ancestry. e, Fibroblasts in women of African and European ancestry showed distinct cell states. f, The fibro-prematrix state was dominant in African ancestry, while the fibro-matrix state was more prominent in European ancestry. g, Genetic ancestry-dependent and germline mutation-dependent variability in the clustering of fibroblasts.
Fig. 6
Fig. 6. Gene expression and chromatin accessibility patterns of selected cell identity genes.
a, IL7R and IFNγ expression and chromatin accessibility were restricted to T cells. b, GZMK expression and chromatin accessibility were restricted to T cells. c, FCGR3A expression and chromatin accessibility were restricted to macrophages. d, The lymphatic endothelial marker LYVE1 was expressed in the endothelial cell 2 subcluster and a fraction of macrophages, but the chromatin accessibility patterns were not unique to these two cell types. e, Although ACKR1 expression was restricted to a subpopulation of endothelial cells, the ACKR1 gene showed limited variation in chromatin accessibility between different cell types. f, CXCL12 expression and chromatin accessibility showed limited correlation.
Extended Data Fig. 1
Extended Data Fig. 1. Experimental workflow of single nucleus atlas generation.
Twelve major steps that were used in creation of single nucleus atlas of breast tissues are shown.
Extended Data Fig. 2
Extended Data Fig. 2. Expression pattern of epithelial subtypes identity gene.
Expression pattern of LHS, LASP and BM cell identity genes is shown. These genes have not been previously reported to be expressed in specific subtypes of breast epithelial cells.
Extended Data Fig. 3
Extended Data Fig. 3. DNA binding motif analyses using Signac.
a) DNA binding motifs differentially active in every cell type of the breasts are shown. b) Expression patterns of select transcription factors whose DNA binding motifs are enriched in epithelial subtypes. c) DNA binding motifs differentially active in epithelial cell types. d) Footprinting analyses show lack of Tn5 integration in regions that carry epithelial cell specific motifs. e) Representative immunohistochemistry images of breast tissues stained with antibodies against ERα (n=17), FOXA1 (n = 18) and GATA3 (n = 20). Nuclei in ducts and lobules analyzed has been marked.
Extended Data Fig. 4
Extended Data Fig. 4. Spatial transcriptomics to determine differences in gene expression between ductal and lobular breast epithelial cells.
a) UMAP showing differences in gene expression patterns between timepoint 1 and timepoint 2. b) Age and BMI of donors at two timepoints of tissues collected for spatial transcriptomics are also indicated. c) Staining pattern of breast tissues with antibodies against pan-keratin, FABP4 and smooth muscle actin. N = 10. d) Representative regions of interest related to ducts, lobules and adipocytes selected for RNA extraction and sequencing. N = 10. e) Deconvolution of spatial transcriptomics data show elevated Adi-2, macrophages and Endo-2 at timepoint 2 compared to timepoint 1 in most samples.
Extended Data Fig. 5
Extended Data Fig. 5. Gene expression and signaling differences between epithelial cells of ducts and lobules.
a) Expression pattern of 10 genes that showed differential expression in ductal epithelial cells compared to lobular epithelial cells assessed using multiome data. b) Differences in signaling pathways in ductal and lobular epithelial cells. Data from all samples were used to generate these networks. c) PTBP1 whose expression in normal breast epithelial cells was reduced in timepoint 2 compared to timepoint 1, is overexpressed in all breast cancer subtypes compared to normal breast. Statistical significance was derived using Unpaired t-test. Samples are biologically independent. (Normal: N = 114, low- 55.146, First quartile (Q1)-87.064, median- 109.154, Third quartile (Q3) - 123.208, high- 163.066; Luminal: N = 566, low- 85.382, q1- 138.168, median- 159.404, q3- 180.133, high- 242.444; HER2 positive: N = 37, low- 105.775, q1- 122.596, median- 132.549, q3- 148.043, high- 188.8; TNBC Basal-like 1: N = 13, low- 152.31, q1- 166.83, median- 182.37, q3- 206.14, high- 220.45; TNBC Basal-like 2: N = 11, low- 119.54, q1- 161.645, median- 179.97, q3- 210.075, high- 217.12; TNBC Immunomodulatory: N = 20, low- 123.85, q1- 139.06, median- 155.46, q3- 179.92, high- 242.18; TNBC luminal androgen receptor: N = 8, low- 123.99, q1- 129.368, median- 136.68, q3- 142.92, high- 153.48; TNBC mesenchymal stem-like: N = 8, low- 96.39, q1- 129.857, median- 154.925, q3- 177.99, high- 203.06; TNBC Mesenchymal: N = 29, low- 75.03, q1- 140.838, median- 165.18, q3- 200.85, high- 260.73; TNBC unspecified: N = 27, low- 100.17, q1- 144.165, median- 167.22, q3- 193.375, high- 264.97).
Extended Data Fig. 6
Extended Data Fig. 6. Age-dependent signaling pathway alterations in ductal and lobular epithelial cells of the breast.
Genes differentially expressed in ductal and lobular epithelial cells at timepoint 2 compared to timepoint 1 from sample #3 were subjected to Ingenuity Pathway Analysis. a) EIF2 signaling pathway enrichment with age. b) Oxidative phosphorylation pathway enrichment with age.
Extended Data Fig. 7
Extended Data Fig. 7. Chromatin accessibility and expression patterns of BM cell-enriched markers.
a) Expression and chromatin accessibility pattern of KRT14 and TP63 in various genetic ancestry and BRCA1/2 mutation carriers. b) Signaling pathways uniquely active in alveolar progenitor cells enriched in Indigenous Americans. Legend within the figure provides details of relationship between molecules of the signaling network.
Extended Data Fig. 8
Extended Data Fig. 8. Genetic ancestry dependent variability in expression of fibroblast-enriched genes.
a) Differences in expression of fibroblast-enriched genes in breast tissue fibroblasts of African ancestry compared to European ancestry. Fourteen clusters (0-13) are shown in Fig. 5g of the main text. b) Expression levels of genes that classify fibroblasts into four subtypes are also shown.
Extended Data Fig. 9
Extended Data Fig. 9. Relationship between breast epithelial gene signatures derived from this study with gene signatures derived from single cell analysis of breast tumors.
a) Gene signature of LHS cells overlap with gene expression modules of LumA, LumB and HER2+ breast cancers, whereas gene signatures of LASP and BM cells overlap with gene expression of modules of cancer cycling and cancer basal, respectively. b) Expression patterns of genes that identify myCAFs, iCAFs, dPVLs and iPVLs among fibroblast subclusters.

References

    1. Reeder-Hayes, K. E. & Anderson, B. O. Breast cancer disparities at home and abroad: a review of the challenges and opportunities for system-level change. Clin. Cancer Res.23, 2655–2664 (2017). - DOI - PMC - PubMed
    1. Dietze, E. C., Sistrunk, C., Miranda-Carboni, G., O’Regan, R. & Seewaldt, V. L. Triple-negative breast cancer in African-American women: disparities versus biology. Nat. Rev. Cancer15, 248–254 (2015). - DOI - PMC - PubMed
    1. Newman, L. A. & Kaljee, L. M. Health disparities and triple-negative breast cancer in African American women: a review. JAMA Surg.152, 485–493 (2017). - DOI - PubMed
    1. Newman, L. A. et al. Meta-analysis of survival in African American and white American patients with breast cancer: ethnicity compared with socioeconomic status. J. Clin. Oncol.24, 1342–1349 (2006). - DOI - PubMed
    1. Cho, B. et al. Evaluation of racial/ethnic differences in treatment and mortality among women with triple-negative breast cancer. JAMA Oncol.7, 1016–1023 (2021). - DOI - PMC - PubMed

LinkOut - more resources