. 2024 Aug 9;7(1):966.
doi: 10.1038/s42003-024-06658-9.

Chronic stress deficits in reward behaviour co-occur with low nucleus accumbens dopamine activity during reward anticipation specifically

Affiliations

Chronic stress deficits in reward behaviour co-occur with low nucleus accumbens dopamine activity during reward anticipation specifically

Chenfeng Zhang et al. Commun Biol. .

Abstract

Whilst reward pathologies are major and common in stress-related neuropsychiatric disorders, their neurobiology and treatment are poorly understood. Imaging studies in human reward pathology indicate attenuated BOLD activity in nucleus accumbens (NAc) coincident with reward anticipation but not reinforcement; potentially, this is dopamine (DA) related. In mice, chronic social stress (CSS) leads to reduced reward learning and motivation. Here, DA-sensor fibre photometry is used to investigate whether these behavioural deficits co-occur with altered NAc DA activity during reward anticipation and/or reinforcement. In CSS mice relative to controls: (1) Reduced discriminative learning of the sequence, tone-on + appetitive behaviour = tone-on + sucrose reinforcement, co-occurs with attenuated NAc DA activity throughout tone-on and sucrose reinforcement. (2) Reduced motivation during the sequence, operant behaviour = tone-on + sucrose delivery + sucrose reinforcement, co-occurs with attenuated NAc DA activity at tone-on and typical activity at sucrose reinforcement. (3) Reduced motivation during the sequence, operant behaviour = appetitive behaviour + sociosexual reinforcement, co-occurs with typical NAc DA activity at female reinforcement. Therefore, in CSS mice, low NAc DA activity co-occurs with low reward anticipation and could account for deficits in learning and motivation, with important implications for understanding human reward pathology.


Conflict of interest statement

G.A-L. and B.H. are employees of Boehringer Ingelheim Pharma GmbH & Co KG. C.R.P. has received funding from Boehringer Ingelheim Pharma GmbH & Co KG. All other authors report no biomedical financial interests or potential competing interests.

Figures
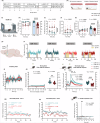
Fig. 1
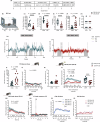
Fig. 1. Effects of chronic social stress on behaviour and NAc DA activity in the discriminative reward learning-memory test.
A Experimental design. BBW + FC: measurement of baseline body weight and food consumption during handling; 90-95% BBW: conditioning under food restriction that reduced BW to 90-95% BBW; Surgery + R + AAVV: stereotactic surgery, recovery, expression of AAV vector; C + OF: conditioning sessions with patch cord attached to optic fibre; CSS/CON: CSS protocol or control handling; re-BBW + FC: BW and food consumption under ad libitum feeding on days 5–12 of CSS/CON provided re-BBW values; 95-100% re-BBW: mice were mildly food restricted to be tested at 95–100% re-BBW; SIG: fibre photometry signal test; DRLM: discriminative reward-learning memory test; REV: reward-to-effort valuation test; BP: brains were perfused-fixed for histology. B CSS mice were placed in the cage of a dominant-aggressive CD-1 mouse to receive 30-60 s physical attack followed by 24 h sensory exposure through a divider; this was repeated with a different CD-1 mouse on each of 15 days. CON mice were kept in littermate pairs and were handled for 1 min on each of 15 days. C Schematic of discriminative reward learning-memory test with fibre photometric recording. Tone discriminative stimulus (DS) signalled chocolate-sucrose pellet (gustatory reward) availability following a feeder response; maximum DS duration was 25 s per trial and inter-trial intervals (ITIs) were 20–60 s (mean = 40 s). Mice received 3 daily tests of 25 trials each and fibre photometry data are presented for tests 1 and 3. Behaviour: D Number of gustatory rewards obtained, i.e. DS trials with a response, across tests (left) and individual mean scores (right). Group main effect: F(1, 31) = 34.74, p < 0.0001. E DS response latency i.e. from DS onset to time of response, with 25 s assigned to no-response trials. Group main effect: F(1, 31) = 31.39, p < 0.0001. F ITI response interval i.e. average latency between successive responses in ITIs. Group main effect: F(1, 31) = 17.69, p = 0.0002. G Learning ratio (mean ITI response interval/DS response latency), across tests (left) and individual mean scores (right). Group main effect: F(1, 31) = 20.78, p < 0.0001; Test main effect: F(2, 62) = 5.24, p < 0.008. Data are given as group mean+s.e.m. and individual data points. Statistical analysis was conducted using 2-way mixed-model ANOVA with between subjects factor of group and within-subjects factor of test. Test days indicated by different letters were significantly different from each other in Tukey’s multiple comparisons test. NAc DA activity: H Schematic showing unilateral injection site of AAV GRAB-DA Sensor in NAc, and fibre optic probe implantation directly dorsal to the injection site. I Representative traces from individual CON and CSS mice of z-scored NAc DA activity during 2 consecutive trials in each of tests 1 and 3. For each of the 2 trials per trace, z-scores were calculated using the trial-specific baseline. J Baseline phase DA activity expressed as ΔF/F across the 10 s before DS onset. For each mouse and time point, the mean score for 25 trials was calculated and data are given as mean±s.e.m. per group and test. K DS-on phase z-scored DA activity, for trials with a DS response, following time-normalisation using 10 equal intervals, across intervals (left) and individual mean scores (right). Group main effect: F(1, 31) = 12.12, p < 0.002; Interval main effect: F(9, 279) = 4.79, p < 0.002. L DS-feeder phase z-scored DA activity, for trials with a DS response, divided into 10 intervals of 0.5 s, across intervals (left) and individual mean scores (right). Group x Test x Second interaction effect: F(9, 279) = 5.67, p < 0.0001). Asterisks indicate CSS < CON in test 3: *p < 0.05, **p < 0.01, ***p < 0.001. M, N Scatterplots showing mean DS-feeder phase z-scored DA activity versus trial number in (M) test 1 and (N) test 3. Statistical analysis was conducted using linear regression and significance of the regression was assessed using ANOVA. O ITI feeder response z-scored DA activity, specifically the 1st feeder response per ITI, from 2 s pre- to 5 s post-feeder response. Test x Second interaction effect: (F(13, 403) = 2.78, p < 0.01). For (JL, O), statistical analysis was conducted using 3-way mixed-model ANOVA with between subjects factor of group and within-subjects factors of test and interval. Time-specific group effects are for Sidak’s multiple comparisons test; intervals indicated by different letters were significantly different from each other in Tukey’s multiple comparisons test. Images (B, C, H) were created with BioRender.com.
Fig. 2
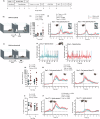
Fig. 2. Effects of chronic social stress on behaviour and NAc DA activity in the reward-to-effort valuation test.
A Experimental design. For definitions of abbreviations, see Fig. 1A. B Schematic of reward-to-effort valuation test with fibre photometric recording. Nosepoke responses at an operant stimulus triggered a tone discriminative stimulus (DS) and chocolate-sucrose pellet delivery on a progressive ratio (PR) schedule (5 trials at PR 1, 5 x PR 3, 5 x PR 5, 5 x PR 7, …); attaining the PR resulted in 1 s tone DS and pellet delivery, and the ITI was 5 s. Mice received 3 daily tests and in test 3 normal food was provided as a low-reward/low-effort choice. Fibre photometry data are presented for test 3 at PR 5. Behaviour: (C) Number of operant responses: t(31) = 5.56, p < 0.0001. D Number of gustatory rewards earned: t(31) = 6.48, p < 0.0001. E Final ratio attained: t(31) = 6.56, p < 0.0001. F Post-reinforcement pause, i.e. latency from end of ITI to 1st operant response of subsequent trial: t(31) = 3.60, p < 0.002. G Weight of normal food eaten during the test: t(31) = 0.36, p = 0.72. Data are given as individual data points and group means. Statistical analysis was conducted using unpaired t-tests. NAc DA activity and associated behavioural measures: (H) Representative traces from individual CON and CSS mice of z-scored NAc DA activity during PR 5 trials. For each of the 2 trials per trace, z-scores were calculated using the trial-specific baseline. I Operant phase duration i.e. time from 1st until 5th operant response: t(25) = 3.17, p = 0.004. J Operant phase z-scored DA activity following time normalisation using 10 equal intervals. For each mouse, the mean score for 5 trials at PR 5 was calculated and data are given as mean±s.e.m. per group. Interval main effect: F(9, 225) = 5.12, p < 0.0001. K DS phase duration i.e. time from DS onset until feeder response: t(25) = 1.72, p = 0.10. L DS phase z-scored DA activity following time normalizaion using 10 equal intervals. Group x Interval interaction effect: F(9, 225) = 2.47, p < 0.02; Group main effect: F(1, 25) = 14.30, p = 0.0009. M Feeder phase z-scored DA activity divided into 10 intervals of 0.5 s. Group x Second interaction effect: F(9, 225) = 2.27, p < 0.02. N ITI feeder response z-scored DA activity, specifically the 1st feeder response per ITI, from 2 s pre- to 5 s post-feeder response. O In CON mice, comparison of z-scored DA activity during the DS phase at PR 3, 5, 7 and 9. Interval main effect: F(9, 450) = 19.07, p < 0.0001. P In CSS mice, comparison of z-scored DA activity during the DS phase at PR 3, 5, and 7. Statistical analysis was conducted using 2-way mixed-model ANOVA with between subjects factor of group and within-subjects factor of interval. Intervals indicated by different letters were significantly different in Tukey’s multiple comparisons. Image (B) was created with BioRender.com.
Fig. 3
Fig. 3. Effects of chronic social stress on behaviour and NAc DA activity in the sociosexual motivation test.
A Experimental design. BBW + FC: measurement of baseline body weight and food consumption during handling; 90–95% BBW: conditioning with sucrose as reinforcer under food restriction that reduced BW to 90-95% BBW; ♀D, conditioning with (distal) female under cup as reinforcer; Surgery + R + AAVV: stereotactic surgery, recovery, expression of AAV vector; OF: session in test chamber with patch cord attached to optic fibre; CSS/CON: CSS protocol or control handling; SIG♀: fibre photometry signal test with proximal exposure to female; ♀D: distal sociosexual motivation test; ♀P: proximal sociosexual motivation test; BP: brains were perfused-fixed for histology. B Schematic of distal sociosexual motivation test with fibre photometric recording. Nosepoke responses at an operant stimulus triggered door opening on a fixed ratio (FR) schedule (1 trial at FR 3, 4 trials at FR 5); attaining the FR resulted in immediate opening of a sliding door, so that the mouse could access the tunnel to the stimulus compartment. A (pro-)estrous female was placed under a pencil cup through which the male could interact with the female; the stimulus phase of each trial was 1 min. Mice received two daily tests (days 1 and 2). C Distal SOM test operant phase duration i.e. time from 1st until 3rd/5th operant response. Group x Day interaction effect: F(1, 842) = 8.49, p = 0.004). D Post-operant phase z-scored DA activity from 3 s prior to until 5 s after the mouse first entered the tunnel to the stimulus compartment, for day 1 and trial 1 (left) and day 1 and trial 5 (right). Group x Time interaction effect: F(3, 1340) = 3.15, p < 0.02. E Schematic of proximal sociosexual motivation test with fibre photometric recording. Nosepoke responses at an operant stimulus triggered door opening on a fixed ratio (FR) schedule (2 trials at FR 10); attaining the FR resulted in immediate opening of a sliding door, so that the mouse could access the tunnel to the stimulus compartment. A (pro-)estrous female was placed in the social compartment and the male and female could interact; this stimulus phase of each trail was 3 min. Mice received two daily tests (days 3 and 4). F Representative traces from a CON mouse (left) and a CSS mouse (right) of z-scored NAc DA activity during FR 10 trials. For each trial, z-scores were calculated using the trial-specific baseline. G Proximal SOM test operant phase duration i.e. time from 1st until 10th operant response. Group main effect: F(1, 28) = 4.56, p < 0.05. H Post-operant phase z-scored DA activity from 3 s prior to until 5 s after the mouse first entered the tunnel to the stimulus compartment, for day 3 and trial 1 (left) and day 3 and trial 2 (right). I Proximal SOM test percent of social phase spent in social episodes. Day main effect: F(1, 84) = 14.54, p < 0.001. J Social phase z-scored DA activity from 3 s prior to until 5 s after the onset of a social episode, for day 3, trial 1 and social episode 1 (left) and day 3, trial 1 and social episode 5 (right). Group x Social episode interaction effect: F(4, 2814) = 6.87, p < 0.001; CSS > CON in social episode 1: p < 0.001, Sidak’s multiple comparisons test. In (C, G and I), statistical analysis was conducted using a linear mixed model with fixed effects of group and day and random effect of subject. In (D and H), statistical analysis was conducted using a linear mixed model with fixed effects of group, day, trial and time and random effect of subject. In (J), statistical analysis was conducted using a linear mixed model with fixed effects of group, day, trial, social episode and time and random effect of subject. Post hoc comparisons were conducted using Sidak’s multiple comparisons test. Images (B) and (E) were created with BioRender.com.
Fig. 4
Fig. 4. Absence of effect of chronic social stress on population-level transcriptome expression of VTA DA neurons.
A Experimental design. Surgery + R + AAVV: stereotactic surgery, recovery, expression of AAV vectors; CSS/CON: CSS protocol or control handling; BP: brains were perfused with PBS; LCM: laser capture microdissection; RNA-Seq: RNA-sequencing and differential gene expression analysis. B Representative coronal image (20x) from brain of a mouse injected with AAV mTH-EGFP in the VTA at bregma −3.1 mm, and ex vivo immunostaining for TH. Both the AAV signal and the immuno-TH signal are concentrated in the VTA, whilst there is also immune-TH signal in the substantia nigra pars compacta (SNc). Scale bar = 500 µm. C Schematic showing bilateral injection site of AAV mTH-EGFP and AAV hGAD67-mScarlet-I in VTA. D Figure of coronal section from mouse atlas at bregma level −3.08 with VTA highlighted. E Representative coronal image (5x) from brain of a control mouse at bregma −3.1 mm pre- and post-LCM collection of EGFP+ tissue. Scale bar = 1000 µm. Inset: representative coronal image (20x), with white circles indicating areas of EGFP+ tissue demarcated for LCM. Scale bar = 100 µm. F Representative coronal image (20x) using the FITC channel to visualise EGFP+ tissue and the TRITC channel to visualise mScarlet-I+ tissue. 1 = EGFP+ tissue samples for collection; 2 = EGFP+/mScarlet-I+ tissue samples not for collection; 3 = mScarlet-I+ tissue samples not for collection. Scale bar = 100 µm. G Expression levels (transcript per million; individual and group mean values) of cell type-specific marker genes in CON and CSS mice: N = neuron, N-DA = DA neuron, N-Gl = glutamate neuron, N-GB = GABA interneuron, A = astrocyte, OL = oligodendrocyte, OP = oligodendrocyte progenitor cell, M = microglia. H Volcano plot for differential gene expression in CSS compared with CON mice: significantly up-regulated genes in CSS mice are shown in red and significantly down-regulated genes are shown in blue. Image (C) was created with BioRender.com. Image (D) was used with permission of Elsevier, from The Mouse Atlas, G. Paxinos & K.B.J Franklin, 2nd edition, 2001; permission conveyed through Copyright Clearance Center, Inc.

Similar articles

Cited by

References

    1. Cuthbert, B. N. The role of RDoC in future classification of mental disorders. Dialogues Clin. Neurosci.22, 81–85 (2020). 10.31887/DCNS.2020.22.1/bcuthbert - DOI - PMC - PubMed
    1. Morris, S. E. et al. Revisiting the seven pillars of RDoC. BMC Med.20, 220 (2022). 10.1186/s12916-022-02414-0 - DOI - PMC - PubMed
    1. Husain, M. & Roiser, J. P. Neuroscience of apathy and anhedonia: a transdiagnostic approach. Nat. Rev. Neurosci.19, 470–484 (2018). 10.1038/s41583-018-0029-9 - DOI - PubMed
    1. Pizzagalli, D. A. Depression, stress, and anhedonia: toward a synthesis and integrated model. Annu. Rev. Clin. Psychol.10, 393–423 (2014). 10.1146/annurev-clinpsy-050212-185606 - DOI - PMC - PubMed
    1. Treadway, M. T. The neurobiology of motivational deficits in depression-an update on candidate pathomechanisms. Curr. Top. Behavi. Neurosci.27, 337–355 (2016). 10.1007/7854_2015_400 - DOI - PubMed

Publication types