. 2024 Aug 10;43(1):222.
doi: 10.1186/s13046-024-03147-z.

Autophagy-mediated ID1 turnover dictates chemo-resistant fate in ovarian cancer stem cells

Affiliations

Autophagy-mediated ID1 turnover dictates chemo-resistant fate in ovarian cancer stem cells

Pratham Phadte et al. J Exp Clin Cancer Res. .

Abstract

Background: The mechanisms enabling dynamic shifts between drug-resistant and drug-sensitive states in cancer cells are still underexplored. This study investigated the role of targeted autophagic protein degradation in regulating ovarian cancer stem cell (CSC) fate decisions and chemo-resistance.

Methods: Autophagy levels were compared between CSC-enriched side population (SP) and non-SP cells (NSP) in multiple ovarian cancer cell lines using immunoblotting, immunofluorescence, and transmission electron microscopy. The impact of autophagy modulation on CSC markers and differentiation was assessed by flow cytometry, immunoblotting and qRT-PCR. In silico modeling and co-immunoprecipitation identified ID1 interacting proteins. Pharmacological and genetic approaches along with Annexin-PI assay, ChIP assay, western blotting, qRT-PCR and ICP-MS were used to evaluate effects on cisplatin sensitivity, apoptosis, SLC31A1 expression, promoter binding, and intracellular platinum accumulation in ID1 depleted backdrop. Patient-derived tumor spheroids were analyzed for autophagy and SLC31A1 levels.

Results: Ovarian CSCs exhibited increased basal autophagy compared to non-CSCs. Further autophagy stimulation by serum-starvation and chemical modes triggered proteolysis of the stemness regulator ID1, driving the differentiation of chemo-resistant CSCs into chemo-sensitive non-CSCs. In silico modeling predicted TCF12 as a potent ID1 interactor, which was validated by co-immunoprecipitation. ID1 depletion freed TCF12 to transactivate the cisplatin influx transporter SLC31A1, increasing intracellular cisplatin levels and cytotoxicity. Patient-derived tumor spheroids exhibited a functional association between autophagy, ID1, SLC31A1, and platinum sensitivity.

Conclusions: This study reveals a novel autophagy-ID1-TCF12-SLC31A1 axis where targeted autophagic degradation of ID1 enables rapid remodeling of CSCs to reverse chemo-resistance. Modulating this pathway could counter drug resistance in ovarian cancer.

Keywords: Autophagy; Cancer stem cells; Chemo-resistance; Differentiation; Epithelial Ovarian Cancer; ID1; SLC31A1; TCF12.


Conflict of interest statement

The authors declare that they have no competing interests.

Figures

Fig. 1
Fig. 1
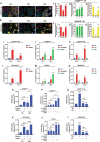
Basal autophagy is elevated in ovarian cancer stem cells (SP) compared to non-stem cells (NSP) and total population (TP). A, B FACS plots showing percentage of SP cells (A) A2780DualLR and (B) TOV21G cells. Verapamil (50 μM) was used as a negative control. C, D RT-qPCR analysis show increased OCT4A and NANOG transcripts in SP compared to NSP, and TP cell populations of (C) A2780DualLR and (D) TOV21G cells (n = 3). E, F Immunoblot showed increased expression of ABCG2 and NANOG in SP compared to NSP, and TP cell populations of (E) A2780DualLR and (F) TOV21G cells (n = 3). G, H Immunoblot showed increased LC3B-I to LC3B-II conversion and p62 degradation in SP compared to NSP, and TP cells of (G) A2780DualLR and (H) TOV21G at the basal level. I, J Quantification from 3 independent experiments confirmed significantly elevated basal autophagy in SP versus NSP and TP of (I: Graphical representation of the normalized ratio of LC3B-II/Tubulin, graphical representation of normalized ratio of p62/tubulin) A2780DualLR and (J: Graphical representation of normalized ratio of LC3B-II/Tubulin, graphical representation of normalized ratio of p62/tubulin) TOV21G cells. K-P Dual immunofluorescence staining of LC3B (green) and LAMP1 (red) and its quantification (≥ 50 cells/group, n = 2) revealed increased LC3B puncta and LC3B + ve/LAMP1 + ve (yellow) colocalized puncta in SP compared to NSP and TP of (K: Representative confocal images, M, N: Graphical representation of quantification of average LC3B + ve punctas and average LC3B + ve/LAMP1 + ve punctas per cell respectively) A2780DualLR and (L: Representative confocal images, O, P: Graphical representation of quantification of average LC3B + ve punctas and average LC3B + ve/LAMP1 + ve punctas per cell respectively) TOV21G cells, indicating higher autophagosome formation and fusion respectively. Q-T Transmission Electron Microscopy (TEM) and quantification (≥ 12 images/group, n = 2) of the individual and total autophagic structures showed increased late-stage autophagy bodies called autolysosomes (yellow arrow) in SP compared to NSP and TP of (Q: Representative images, S: Graphical representation of quantification of the total and individual number of autophagic structures) A2780DualLR and (R: Representative images, T: Graphical representation of quantification of total and individual number of autophagic structures) TOV21G without significant alterations in phagophores (red arrow) or autophagosomes (green arrow), confirming elevated basal autophagy in ovarian CSCs. Data represented as mean ± SEM. Statistical analysis was performed using one-way ANOVA, followed by Dunnett's post-hoc test when comparing multiple groups to a control, * p < 0.05, ** p < 0.01, *** p < 0.001, n.s.- non-significant. Scale bar: 10 μm for A2780DualLR, 20 μm for TOV21G cells (confocal images), 5 µm (TEM images). SP: Side Population, NSP: Non-Side Population, TP: Total Population, UT: Untreated, CQ: Chloroquine, SS: Serum Starvation
Fig. 2
Fig. 2
ID1 protein is selectively degraded via autophagy in ovarian CSCs. A, B Graphical analysis of Flow cytometry showing a decreased percentage of SP cells with autophagy induction by Torin1 and serum starvation but not with autophagy blockade by CQ. Simultaneous induction and blockade of autophagy (TO + CQ; SS + CQ) partially rescued the effects mediated by autophagy induction (TO and serum starvation) alone showing increased percentage of SP cells and indicating that the observed effects are autophagy induction-specific (A: Graphical representation of changes in the percentage of SP cells after autophagy modulation) A2780DualLR cells and (B: Graphical representation of changes in the percentage of SP cells after autophagy modulation) TOV21G cells (n = 3). C Immunoblotting revealed higher levels of ID1, specifically in SP, compared to NSP and TP of A2780DualLR and TOV21G cells (n = 3). D Immunoblot showing that autophagy induction by Torin 1 treatment decreased ID1, ABCG2, and NANOG levels while autophagy blockade by CQ alone showed no significant increase in ID1. Simultaneous induction and blockade of autophagy (To + CQ) showing accumulation of ID1, Nanog and ABCG2 in A2780DualLR-SP and TOV21G-SP cells which indicates the rescue effects, mediated by autophagy induction (TO) alone and thereby confirming that the observed effects are autophagy induction-specific. Accumulation of LC3B-II and p62 by CQ which is otherwise reversed after TO treatment increased further after TO + CQ treatment confirming simultaneous induction and blockade in SP populations of both the cell lines (n = 3). E Immunoblots showing that autophagy induction by serum starvation also leads to a decrease in ID1 levels with concomitant decrease in ABCG2 and NANOG levels in A2780DualLR-SP cells and TOV21G-SP cells. Increased LC3I to LC3II conversion and reduced p62 levels after serum starvation indicated higher autophagy for SP populations of both the cell lines (n = 3). F-K Dual immunofluorescence staining of LC3 (green) and ID1 (red) and its quantification (≥ 50 cells/group, n = 2) indicated autophagy induction decreased total ID1 levels and increased colocalization (yellow) with LC3B + puncta in the SP cells of (F: Representative images, H: Graphical representation of Mean Fluorescence Intensity of ID1, I: Graphical representation of average number of LC3 + ve/LAMP1 colocalized punctas per cell) A2780DualLR and (G: Representative images, J: Graphical representation of Mean Fluorescence Intensity of ID1, K: Graphical representation of average number of LC3 + ve/LAMP1 colocalized punctas per cell) TOV21G cells. L, M Immunoblot confirming autophagy (CQ), but not proteasome (BTZ: Bortezomib) blockade rescued the Torin 1 treated levels of ID1 in SP cells of (M) A2780DualLR and (N) TOV21G (n = 2). Data represented as mean ± SEM. Statistical analysis was performed using one-way ANOVA, followed by Dunnett's post-hoc test when comparing multiple groups to a control, or Bonferroni post-hoc test when comparing all groups to each other, whichever is appropriate, * p < 0.05, ** p < 0.01, *** p < 0.001, n.s.- non-significant. SP: Side Population, NSP: Non-Side Population, TP: Total Population, UT: Untreated, VER: Verapamil, TO: Torin 1, CQ: Chloroquine, BTZ: Bortezomib, SS: Serum Starvation
Fig. 3
Fig. 3
ID1 downregulation decreases stemness and enhances chemosensitivity. A, D Graphical analysis of Flow cytometry analysis showing a decreased percentage of SP cells after pharmacological (AGX51, 40 μM) and genetic (shRNA: shPAN-ID and shID1) knockdown of ID proteins in (A, B) A2780DualLR and (C, D) TOV21G cells. Vehicle controls for AGX51 (0.4% DMSO) showed negligible decrease compared to untreated cells, whereas scrambled controls (scr PAN ID and scr ID1) showed no significant change compared to non-transduced cells (n = 3). E Immunoblot analysis of ID1, ABCG2, and NANOG expression in SP cells of A2780DualLR and TOV21G after pharmacological depletion of ID1. Treatment resulted in reduced levels of ID1, ABCG2, and NANOG. Vehicle control showed no apparent changes in the levels of these proteins measured (n = 3). F RT-qPCR analysis indicated that genetic ID1 depletion led to downregulation of OCT4A and NANOG transcripts in shPAN-ID and shID1 compared to wild-type cells of A2780DualLR and TOV21G cells (n = 3). H–L Annexin V/PI apoptosis assay showed that depletion of ID1 enhanced the cytotoxic effects of cisplatin, causing higher cell death in SP, NSP, and TP cell populations (H, I: Pharmacological, J: genetic, K: autophagy-mediated) of A2780DualLR and TOV21G cells. (J, K) Simultaneous induction and blockade of autophagy (TO + CQ) rescued the effects mediated by autophagy induction (TO) alone showing decreased percentages of cell death after cisplatin challenge, contrasting with the effects of Torin1 in A2780DualLR-SP cells and TOV21G-SP cells after cisplatin challenge indicating that the observed effects are autophagy induction-specific (n = 3). Minimum of 50,000 events were analyzed per sample. Statistical analysis was performed using one-way ANOVA, followed by Dunnett's post-hoc test when comparing multiple groups to a control, or Bonferroni post-hoc test when comparing all groups to each other, whichever is appropriate. Data represented as mean ± SEM, * p < 0.05, ** p < 0.01, *** p < 0.001, n.s.- non-significant. SP: Side Population, NSP: Non-Side Population, TP: Total Population, UT: Untreated, VER: Verapamil, TO: Torin 1, CQ: Chloroquine
Fig. 4
Fig. 4
In silico modeling predicted TCF12 as a top interacting protein partner of ID1. A Graph showed the total number of residues involved in stabilizing the protein–protein interaction dimers between ID1-ID4 family members and transcription factor TCF12. B Graph indicating the thermodynamic feasibility (ΔG values) of dimer interactions between ID1-4 and TCF12. C Representative 3D structural models of the dimer complexes formed between ID1-2 family members and TCF12. D Ligand–protein interaction plot of the ID1:TCF12 dimer interface highlighting key stabilizing interactions. E Representative 3D structural models of the dimer complexes formed between ID3-4 family members and TCF12. F, G Co-immunoprecipitation assays demonstrating physical interaction between endogenous ID1 and TCF12 proteins in SP cells isolated from (F) A2780DualLR and (G) TOV21G cells. Reciprocal immunoprecipitation with anti-ID1 and anti-TCF12 antibodies confirmed the presence of ID1-TCF12 interactions in both cell lines. IgG isotype control was included to confirm specific antibody binding. (n = 2 independent experiments). SP: Side Population
Fig. 5
Fig. 5
Autophagic degradation of ID1 released TCF12 to activate SLC31A1 promoter. A-H Dual immunofluorescence staining of ID1 (red) and TCF12 (green) and their quantification (≥ 50 cells/group, n = 3) indicated that autophagic degradation of ID1 reduces nuclear ID1/TCF12 colocalization (yellow), suggesting that TCF12 was freed from the repression of ID1 in SP cells of (A: Representative confocal images, C: quantification of nuclear mean fluorescence intensity [mNFI] of ID1, D: quantification of mNFI of TCF12, E: quantification of mNFI of ID1/TCF12 colocalized puncta) A2780DualLR and (B: Representative confocal images, F: quantification of mNFI of ID1, G: quantification of mNFI of TCF12, H: quantification of mNFI of ID1/TCF12 colocalized puncta) TOV21G cells. (I-N) ChIP-qPCR data showed increased TCF12 occupancy on SLC31A1 promoter at Site 1 and Site 2 after pharmacological ablation of ID1 in (I) A2780DualLR-SP and (L) TOV21G-SP cells; in shPAN-ID, shID compared to control wild-type (WT) cells of (J) A2780DualLR and (M) TOV21G cells; after autophagy modulation (TO and CQ) in (K) A2780DualLR-SP and (N) TOV21G-SP cells (n = 2). (O-T) RT-qPCR analysis indicated that ID1 depletion led to upregulation of SLC31A1 transcripts in SP, NSP, and TP cell populations of (O: Pharmacological, P: genetic, Q: autophagy-mediated) A2780DualLR and (R: pharmacological, S: genetic, T: autophagy-mediated) TOV21G cells. Simultaneous induction and blockade of autophagy (TO + CQ) rescued the effects mediated by autophagy induction (TO) alone showing decreased levels of SLC31A1, contrasting with the effects of Torin1 in (P) A2780DualLR-SP cells and (S) TOV21G-SP cells thus indicating that the observed effects are autophagy induction-specific (n = 3). (Q, T) Scrambled controls of both the cell lines (scr PAN ID and scr ID1) showed no significant changes in the levels of SLC31A1 transcripts compared to non-transduced wild-type cells. Data represents mean ± SEM. Statistical analysis was performed using Student's t-test for comparing untreated and drug-treated group. For comparisons involving multiple groups, one-way ANOVA was used, followed by Dunnett's post-hoc test when comparing multiple groups to a control, or Bonferroni post-hoc test when comparing all groups to each other, whichever is appropriate. * p < 0.05, ** p < 0.01, *** p < 0.001, n.s.- non-significant. Scale bar: 10 μm for A2780DualLR, 20 μm–– for TOV21G cells (confocal images). SP: Side Population, NSP: Non-Side Population, TP: Total Population, UT: Untreated, TO: Torin 1, CQ: Chloroquine
Fig. 6
Fig. 6
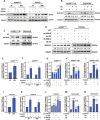
Upregulation of SLC31A1 leads to increased cellular uptake of cisplatin. A Immunoblot analysis of SLC31A1 protein levels in A2780DualLR and TOV21G cells. SP cells showed the lowest SLC31A1 expression compared to NSP and TP counterparts. ID1 depletion by AGX51 treatment increases SLC31A1 levels in both SP and NSP cells, with the highest increase observed in NSP cells. Vehicle control (0.4% DMSO) showed no apparent changes in the levels of proteins measured (n = 2). B Immunoblot indicated that autophagy-mediated depletion of ID1 by Torin1 treatment led to upregulation of SLC31A1 protein. However, simultaneous treatment with Torin 1 and CQ showed decrease in SLC31A1 protein levels compared to (TO alone) treated group in both A2780DualLR -SP cells and TOV21G-SP cells indicating that the observed effects are autophagy induction-specific (n = 3). C Immunoblot showing significant increase levels of SLC31A1 protein levels after serum starvation in both A2780DualLR -SP cells and TOV21G-SP cells (n = 3). D Immunoblot indicating that genetic – shPAN-ID and shID1depletion of ID1 also leads to increased levels of SLC31A1 protein with highest increase sh ID1 cells of both A2780DualLR cells and TOV21G cells. Scrambled controls of both the cell lines (scr PAN ID and scr ID1) showed no significant changes in the levels of SLC31A1 protein compared to non-transduced wild-type cells (n = 3). E-N ICP-MS analysis to quantify normalized intracellular platinum levels showed lower basal platinum accumulation in SP compared to NSP cells of (E) A2780DualLR and (J) TOV21G cells. Various strategies of ID1 depletion led to enhanced platinum uptake in both SP and NSP cells of (F: pharmacological, G: genetic—shPAN-ID and shID1, H-I: autophagy-mediated) A2780DualLR and (K: pharmacological, L: genetic—shPAN-ID and shID1, M–N: autophagy-mediated) TOV21G cells. Simultaneous induction and blockade of autophagy rescued the effects mediated by autophagy induction by Torin1 and serum starvation, resulting in a significant decrease in cisplatin accumulation compared to autophagy induction alone (Torin1 treatment and serum starvation) indicating that the observed effects are autophagy induction-specific. These effects are shown in (H-I) for A2780DualLR-SP cells and (M–N) for TOV21G-SP cells. Scrambled controls of both the cell lines (scr PAN ID and scr ID1) showed no significant accumulation of cisplatin compared to non-transduced wild-type cells (n = 3). Data are mean ± SEM. Statistical analysis was performed using Student's t-test with Welch’s Correction for comparing two groups for data with unequal variances. For comparisons involving multiple groups, one-way ANOVA was used, followed by Dunnett's post-hoc test when comparing multiple groups to a control, or Bonferroni post-hoc test when comparing all groups to each other, whichever is appropriate. * p < 0.05, ** p < 0.01, *** p < 0.001, n.s.- non-significant. SP: Side Population, NSP: Non-Side Population, TP: Total Population, UT: Untreated, TO: Torin 1, CQ: Chloroquine, SS: Serum Starvation
Fig. 7
Fig. 7
Platinum-sensitive patient spheroids exhibit heightened autophagy, ID1 and SLC31A1 expression. A Dual immunofluorescence staining of LC3B (green) and LAMP1 (red) in tumor spheroids derived from the ascitic fluid of chemo-naïve (sample size n = 6 patients; total of 38 spheroids analyzed across all patients), platinum-sensitive relapsed (sample size: n = 5 patients; total of 34 spheroids analyzed across all patients) and platinum-resistant relapsed (sample size: n = 3 patients; a total of 13 spheroids analyzed across all patients) high-grade serous ovarian cancer patients showed increased LC3B + ve punctas that colocalized (yellow) more with LAMP1 in spheroids from platinum-sensitive relapsed cases indicated a higher autophagy. B Graphical representation of quantification of average LC3B + ve punctas per cell of a spheroid. C Graphical representation of quantification of average LC3B + ve/LAMP1 + ve punctas per cell of a spheroid. D Representative image showed positive staining for stemness marker OCT4 in patient-derived spheroids. E Representative immunohistochemistry images of SLC31A1 and ID1 staining in cell blocks made from ascites of chemo-naïve and platinum sensitive relapse patients. F Tabulated immunohistochemistry (IHC) scores of SLC31A1 and ID1 in cell blocks. Results showed highest intensity and membranous localization of SLC31A1 in platinum-sensitive relapsed patients compared to chemo-naïve patients. Conversely, ID1 expression was lower in platinum-sensitive relapsed patients compared to chemo-naïve patients. Patient-level Means (average of spheroids analyzed per patient) ± SEM obtained from each category were used for statistical analysis. Statistical analysis was performed using one-way ANOVA followed by Dunnett's post-hoc test for multiple comparisons. * p < 0.05, ** p < 0.01, *** p < 0.001, n.s.- non-significant. Scale bar: 5 μm (confocal images), 40 μm (I.H.C images)
Fig. 8
Fig. 8
Autophagy-Mediated Regulation of Cisplatin Sensitivity in Ovarian Cancer Stem Cells. A Schematic comparison of basal and induced autophagy pathways regulating chemotherapy response in CSC-enriched SP cells. At basal level, high ID1 levels sequester TCF12, reducing SLC31A1 expression and cisplatin influx. Induced autophagy degrades ID1, liberating TCF12 to enhance and upregulate SLC31A1, leading to increased cisplatin sensitivity. This autophagy-mediated reprogramming shifts the cells fate from a platinum-resistant to platinum-sensitive state (Created with BioRender.com)

References

    1. Batlle E, Clevers H. Cancer stem cells revisited. Nat Med. 2017;23(10):1124–34. 10.1038/nm.4409 - DOI - PubMed
    1. Golebiewska A, Brons NH, Bjerkvig R, Niclou SP. Critical appraisal of the side population assay in stem cell and cancer stem cell research. Cell Stem Cell. 2011;8(2):136–47. 10.1016/j.stem.2011.01.007 - DOI - PubMed
    1. Wu C, Alman BA. Side population cells in human cancers. Cancer Lett. 2008;268(1):1–9. 10.1016/j.canlet.2008.03.048 - DOI - PubMed
    1. Smith AG, Macleod KF. Autophagy, cancer stem cells and drug resistance. J Pathol. 2019;247(5):708–18. 10.1002/path.5222 - DOI - PMC - PubMed
    1. Nazio F, Bordi M, Cianfanelli V, Locatelli F, Cecconi F. Autophagy and cancer stem cells: molecular mechanisms and therapeutic applications. Cell Death Differ. 2019;26(4):690–702. 10.1038/s41418-019-0292-y - DOI - PMC - PubMed

MeSH terms