. 2024 Aug 9;16(1):96.
doi: 10.1186/s13073-024-01369-6.

The genetics and epidemiology of N- and O-immunoglobulin A glycomics

Affiliations

The genetics and epidemiology of N- and O-immunoglobulin A glycomics

Alessia Visconti et al. Genome Med. .

Abstract

Background: Immunoglobulin (Ig) glycosylation modulates the immune response and plays a critical role in ageing and diseases. Studies have mainly focused on IgG glycosylation, and little is known about the genetics and epidemiology of IgA glycosylation.

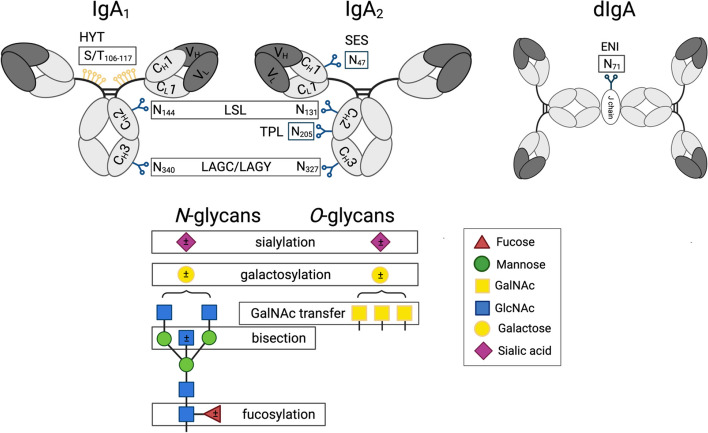
Methods: We generated, using a novel liquid chromatography-mass spectrometry method, the first large-scale IgA glycomics dataset in serum from 2423 twins, encompassing 71 N- and O-glycan species.

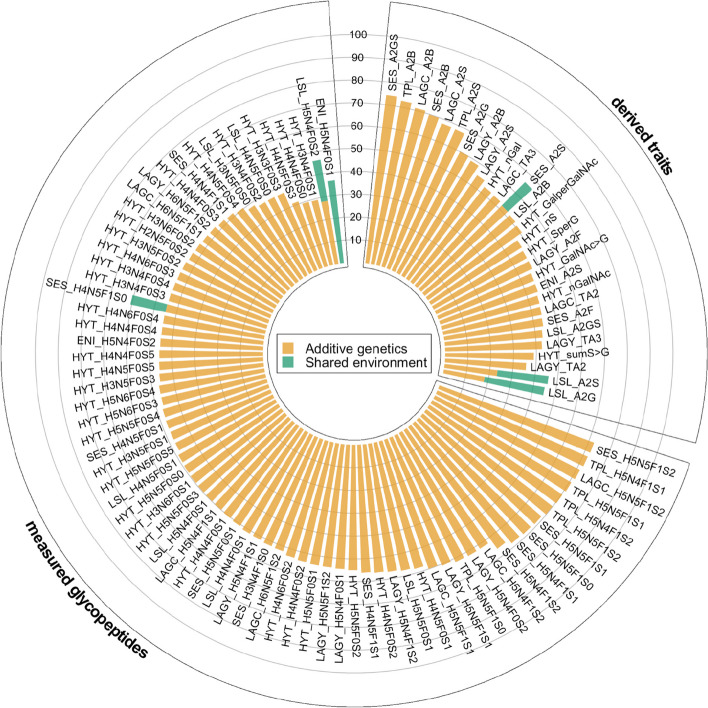
Results: We showed that, despite the lack of a direct genetic template, glycosylation is highly heritable, and that glycopeptide structures are sex-specific, and undergo substantial changes with ageing. We observe extensive correlations between the IgA and IgG glycomes, and, exploiting the twin design, show that they are predominantly influenced by shared genetic factors. A genome-wide association study identified eight loci associated with both the IgA and IgG glycomes (ST6GAL1, ELL2, B4GALT1, ABCF2, TMEM121, SLC38A10, SMARCB1, and MGAT3) and two novel loci specifically modulating IgA O-glycosylation (C1GALT1 and ST3GAL1). Validation of our findings in an independent cohort of 320 individuals from Qatar showed that the underlying genetic architecture is conserved across ancestries.

Conclusions: Our study delineates the genetic landscape of IgA glycosylation and provides novel potential functional links with the aetiology of complex immune diseases, including genetic factors involved in IgA nephropathy risk.

Keywords: Glycosylation; IgA/IgG shared genetics; Immunoglobulin A.


Conflict of interest statement

The authors declare that they have no competing interests.

Figures

Fig. 1
Fig. 1
Schematic representation of IgA1 and IgA2 with examples for O- and N-glycan structures. N-glycans are attached to the amino side chain of an asparagine residue (N), while O-glycans are attached to the side chain of serine (S) or threonine (T). Each IgA1 heavy chain contains two N-glycosylation sites (i.e., at N144 and N340), while the hinge region has six O-glycosylation sites (i.e., at T106, T109, S111, S113, T114, and T117), all present on a single tryptic peptide. Both dimeric IgA1 and IgA2 have one additional N-glycosylation site at the J-chain (i.e., at N71). The three-letter code defines the tryptic (glyco-)peptides: HYT for the O-glycosylation at the hinge region of IgA1; LSL for the N-glycosylated sites N144 or N131 on IgA1 or IgA2, respectively; LAG for the N-glycosylated sites N340 or N327 on IgA1 or IgA2, respectively, which were detected with either a terminal tyrosine (LAGY) or as the truncated form (LAGC); SES for the N-glycosylated site N47 on IgA2; TPL for the N-glycosylated site N205 on IgA2; ENI for the N-glycosylated site N71 at the J-chain on IgA2. Glycosylation site numbering is according to Uni-ProtKB. Monosaccharide symbols and example structures of O- and N-glycans and of derived traits are also shown
Fig. 2
Fig. 2
Heritability of IgA measured glycopeptides and derived traits. We used the ACE model to partition the variance for each trait into additive genetic (orange), and shared (green) and unique (white) environmental components
Fig. 3
Fig. 3
a Progressive decrease in sialylation efficiency of different N- and O-glycan structures. For each enzymatic reaction depicted on top of the panel, the conversion rate was estimated as the product/substrate ratio using untransformed glycans relative frequencies. For each ratio, the median value is represented with a cross at the corresponding positions of the x-axis, while the grey area shows the interquartile range. Within each panel, glycan structures differ by a single sialic acid residue, and thus reflect sequential sialylation reactions in the glycosylation pathway. Significant differences, evaluated by means of the Wilcoxon test, are indicated with an asterisk (P < 2.2 × 10.−16). b Correlation network of IgA and IgG N-linked glycosylation derived traits. Each node represents a derived trait (IgG: white; IgA: grey), with size proportional to the trait heritability. Edges connect phenotypically correlated (Pearson’s |ρ|> 0.25) derived traits. IgA-IgG correlations are shown with darker, thicker lines compared IgA-IgA correlations. For IgA, only correlations between derived traits on different peptides are shown. Derived traits are grouped according to their glycosylation features. c Genetic correlation of IgA and IgG-derived traits. The heatmap shows IgA-derived traits in rows and IgG-derived traits in columns, with colour labels indicating the linkage (O- or N-) and the glycosylation feature (e.g., sialylation, fucosylation, bisection). Cells colours represent the genetic correlation coefficients with grey cells indicating IgA-IgG pairs whose calculation did not converge. Derived traits are hierarchically clustered based on absolute genetic correlation coefficients using the hclust function as implemented in the pheatmap R package (v1.0.12)
Fig. 4
Fig. 4
Miami plot showing the genome-wide association of IgA (top) and IgG measured glycopeptides and derived traits (bottom). The x-axis shows the genomic coordinates (GRCh37.p13) of the tested SNPs and the y-axis shows the –log10 P value of their association. The horizontal black line indicates the threshold for genome-wide significance at 1.35 × 10−9 and 2.08 × 10.−9, for IgA and IgG, respectively. Asterisks indicate newly identified IgA glycosylation loci failing replication in QMDiab (top panel) and replicated IgG loci not reaching genome-wide significance in the present study (bottom panel)

References

    1. Shen X, et al. Multivariate discovery and replication of five novel loci associated with Immunoglobulin G N-glycosylation. Nat Commun. 2017;8:447. 10.1038/s41467-017-00453-3 - DOI - PMC - PubMed
    1. Klarić L, et al. Glycosylation of immunoglobulin G is regulated by a large network of genes pleiotropic with inflammatory diseases. Sci Adv. 2020;6:eaax0301. 10.1126/sciadv.aax0301 - DOI - PMC - PubMed
    1. Gudelj I, Lauc G, Pezer M. Immunoglobulin G glycosylation in aging and diseases. Cell Immunol. 2018;333:65–79. 10.1016/j.cellimm.2018.07.009 - DOI - PubMed
    1. Ding L, Chen X, Cheng H, Zhang T, Li Z. Advances in IgA glycosylation and its correlation with diseases. Front Chem. 2022;10:974854. 10.3389/fchem.2022.974854 - DOI - PMC - PubMed
    1. Plomp R, et al. Hinge-Region O-Glycosylation of Human Immunoglobulin G3 (IgG3). Mol Cell Proteomics. 2015;14:1373–84. 10.1074/mcp.M114.047381 - DOI - PMC - PubMed

LinkOut - more resources