

miR-203-3p promotes senescence of mouse bone marrow mesenchymal stem cells via downregulation of Pbk
- PMID: 39123275
- PMCID: PMC11561657
- DOI: 10.1111/acel.14293
miR-203-3p promotes senescence of mouse bone marrow mesenchymal stem cells via downregulation of Pbk
Abstract
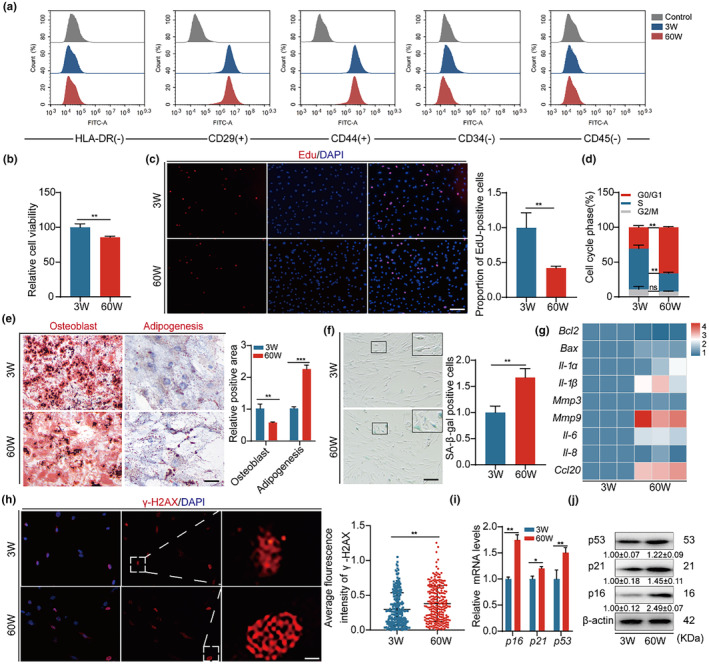
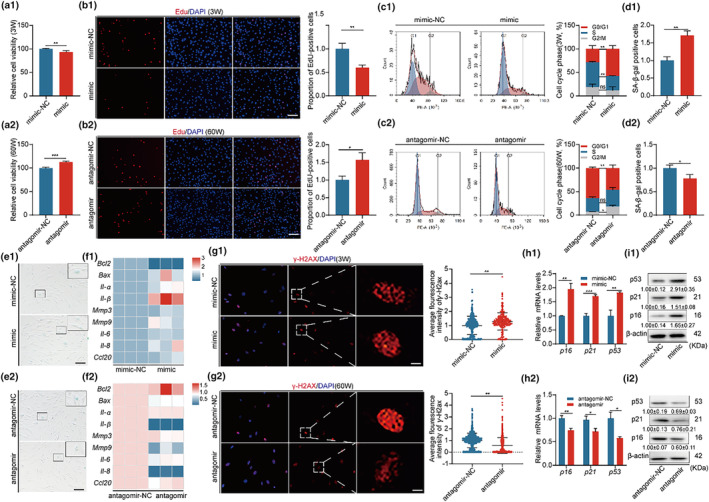
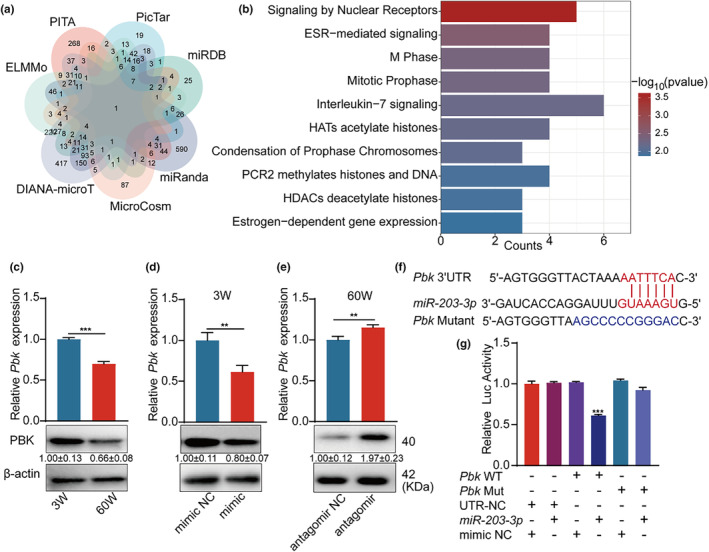
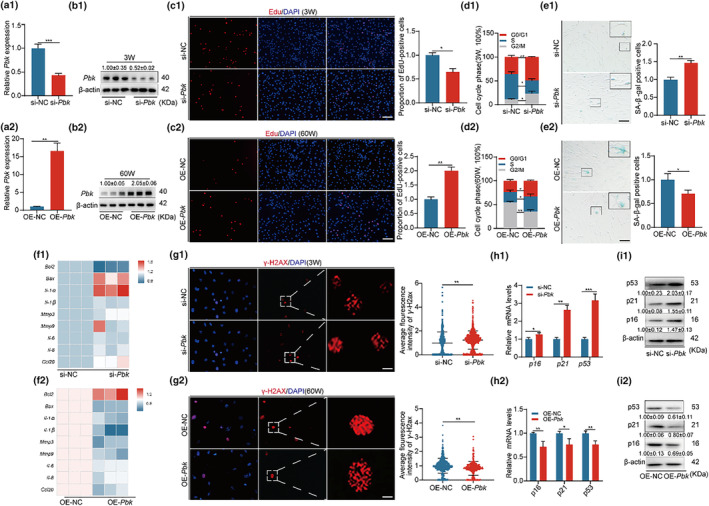
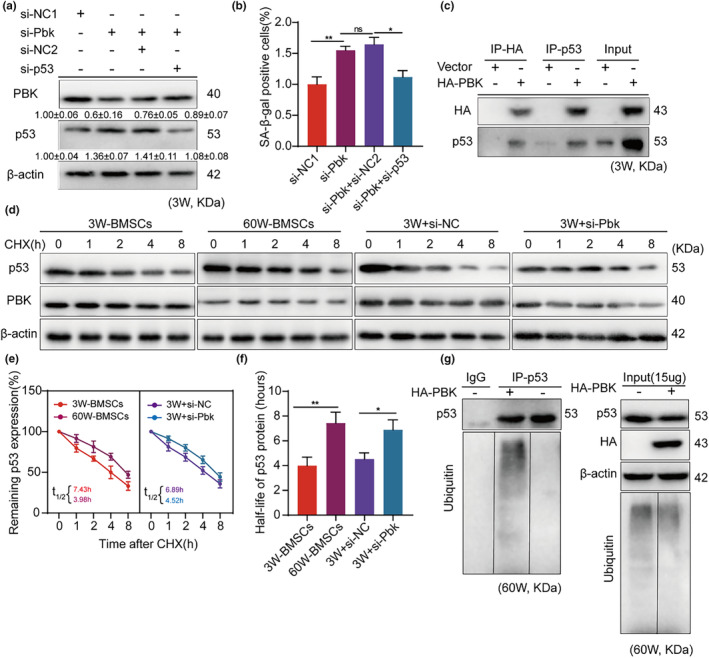
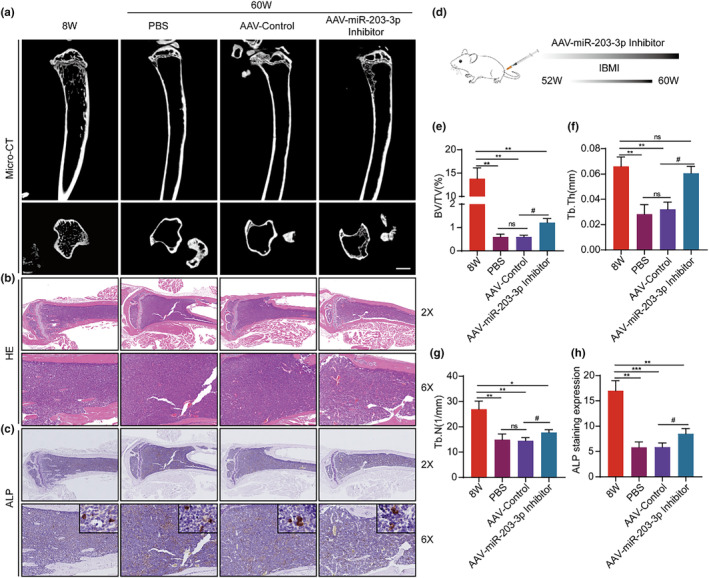
The senescence of bone marrow mesenchymal stem cells (BMSCs) contributes to the development of degenerative skeletal conditions. To date, the molecular mechanism resulting in BMSC senescence has not been fully understood. In this study, we identified a small non-coding RNA, miR-203-3p, the expression of which was elevated in BMSCs from aged mice. On the other hand, overexpression of miR-203-3p in BMSCs from young mice reduced cell growth and enhanced their senescence. Mechanistically, PDZ-linked kinase (PBK) is predicted to be the target of miR-203-3p. The binding of miR-203-3p to Pbk mRNA could decrease its expression, which in turn inhibited the ubiquitination-mediated degradation of p53. Furthermore, the intravitreal injection of miR-203-3p-inhibitor into the bone marrow cavity of aged mice attenuated BMSC senescence and osteoporosis in aged mice. Collectively, these findings suggest that targeting miR-203-3p to delay BMSC senescence could be a potential therapeutic strategy to alleviate age-related osteoporosis.
Keywords: PDZ‐binding kinase; aging; bone marrow mesenchymal stem cells; miR‐203‐3p; osteoporosis.
© 2024 The Author(s). Aging Cell published by Anatomical Society and John Wiley & Sons Ltd.
Conflict of interest statement
The authors declare that they have no known competing financial interests or personal relationships that could have appeared to influence the work reported in this paper.
Figures
Similar articles
-
TRAF3, a Target of MicroRNA-363-3p, Suppresses Senescence and Regulates the Balance Between Osteoblastic and Adipocytic Differentiation of Rat Bone Marrow-Derived Mesenchymal Stem Cells.Stem Cells Dev. 2020 Jun 1;29(11):737-745. doi: 10.1089/scd.2019.0276. Epub 2020 Apr 21. Stem Cells Dev. 2020. PMID: 32111144
-
Melatonin promotes bone marrow mesenchymal stem cell osteogenic differentiation and prevents osteoporosis development through modulating circ_0003865 that sponges miR-3653-3p.Stem Cell Res Ther. 2021 Feb 25;12(1):150. doi: 10.1186/s13287-021-02224-w. Stem Cell Res Ther. 2021. PMID: 33632317 Free PMC article.
-
microRNA-148a-3p in extracellular vesicles derived from bone marrow mesenchymal stem cells suppresses SMURF1 to prevent osteonecrosis of femoral head.J Cell Mol Med. 2020 Oct;24(19):11512-11523. doi: 10.1111/jcmm.15766. Epub 2020 Sep 1. J Cell Mol Med. 2020. PMID: 32871042 Free PMC article.
-
LncRNA MEG3 inhibited osteogenic differentiation of bone marrow mesenchymal stem cells from postmenopausal osteoporosis by targeting miR-133a-3p.Biomed Pharmacother. 2017 May;89:1178-1186. doi: 10.1016/j.biopha.2017.02.090. Epub 2017 Mar 14. Biomed Pharmacother. 2017. PMID: 28320084
-
LncRNA metastasis-associated lung adenocarcinoma transcript-1 promotes osteogenic differentiation of bone marrow stem cells and inhibits osteoclastic differentiation of Mø in osteoporosis via the miR-124-3p/IGF2BP1/Wnt/β-catenin axis.J Tissue Eng Regen Med. 2022 Mar;16(3):311-329. doi: 10.1002/term.3279. Epub 2022 Jan 11. J Tissue Eng Regen Med. 2022. PMID: 34962086
Cited by
-
Co-morbid mechanisms of intervertebral disc degeneration and osteoporosis: biomechanical coupling and molecular pathways synergistically driving degenerative lesions.J Orthop Surg Res. 2025 Jul 14;20(1):652. doi: 10.1186/s13018-025-06075-6. J Orthop Surg Res. 2025. PMID: 40660249 Free PMC article. Review.
-
Antisenescence therapies for age-related bone loss: Target factors, medicines, biomedical materials.Clin Transl Med. 2025 Jun;15(6):e70350. doi: 10.1002/ctm2.70350. Clin Transl Med. 2025. PMID: 40490937 Free PMC article. Review.
References
-
- Ambrosi, T. H. , Marecic, O. , McArdle, A. , Sinha, R. , Gulati, G. S. , Tong, X. , Wang, Y. , Steininger, H. M. , Hoover, M. Y. , Koepke, L. S. , Murphy, M. P. , Sokol, J. , Seo, E. Y. , Tevlin, R. , Lopez, M. , Brewer, R. E. , Mascharak, S. , Lu, L. , Ajanaku, O. , … Chan, C. K. F. (2021). Aged skeletal stem cells generate an inflammatory degenerative niche. Nature, 597(7875), 256–262. 10.1038/s41586-021-03795-7 - DOI - PMC - PubMed
MeSH terms
Substances
Grants and funding
LinkOut - more resources
Full Text Sources
Research Materials
Miscellaneous
