. 2024 Aug 1;16(15):2748.
doi: 10.3390/cancers16152748.

Definition of a Multi-Omics Signature for Esophageal Adenocarcinoma Prognosis Prediction

Affiliations

Definition of a Multi-Omics Signature for Esophageal Adenocarcinoma Prognosis Prediction

Luca Lambroia et al. Cancers (Basel). .

Abstract

Esophageal cancer is a highly lethal malignancy, representing 5% of all cancer-related deaths. The two main subtypes are esophageal squamous cell carcinoma (ESCC) and esophageal adenocarcinoma (EAC). While most research has focused on ESCC, few studies have analyzed EAC for transcriptional signatures linked to diagnosis or prognosis. In this study, we utilized single-cell RNA sequencing and bulk RNA sequencing to identify specific immune cell types that contribute to anti-tumor responses, as well as differentially expressed genes (DEGs). We have characterized transcriptional signatures, validated against a wide cohort of TCGA patients, that are capable of predicting clinical outcomes and the prognosis of EAC post-surgery with efficacy comparable to the currently accepted prognostic factors. In conclusion, our findings provide insights into the immune landscape and therapeutic targets of EAC, proposing novel immunological biomarkers for predicting prognosis, aiding in patient stratification for post-surgical outcomes, follow-up, and personalized adjuvant therapy decisions.

Keywords: RNA sequencing; cancer; esophageal adenocarcinoma; immune infiltrate; immunotherapy; response to therapy; single-cell RNA; single-cell sequencing; transcriptional signature; treatment.


Conflict of interest statement

The authors declare no conflicts of interest.

Figures
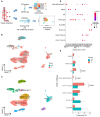
Figure 1
Figure 1
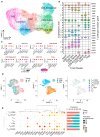
CD45+ cells annotation. (A) Schematic representation of the experimental workflow. (B) UMAP visualization of CD45+ clusters according to their tissue of provenance. (C) UMAP visualization of annotated CD45+ cell clusters. Annotations were made considering the differential expression of the main cell type gene markers. (D) DotPlot of the expression level of gene markers specific for each cell type. (E) Barplots of the relative abundance of cell clusters according to their tissue of provenance; the bars represent the mean of the frequencies while the error bar represents the standard deviation; p-values were computed by Mann-Whitney U test.
Figure 2
Figure 2
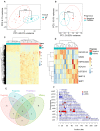
T cell annotation and differential expression analyses. (A) UMAP visualization of annotated T cell clusters. (B) Violin plot with the average expression of cell type marker genes used for annotation. (C) Differential gene expression in each T cell subcluster comparing tumor and non-tumor samples. (D) UMAP analyses of the separation of the cells according to the tissue type (left panel), the T cell type (central panel), and the annotation of each subcluster (right panel). (E) Dot plot showing the cluster identification according to the MFI of the antibody, the frequency of positive cells (left panel), and the frequency of each cell population according to the tissue of origin (tumor or non-tumor tissue, right panel). Each cluster was identified considering the mean fluorescence intensity (MFI) of the antibody and its frequency in each tissue type.
Figure 3
Figure 3
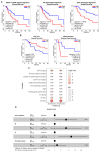
Total RNA expression analysis of tumor and non-tumor esophageal tissues. (A) PCA of bulk RNA-seq samples visualized according to the tissue of origin (*** p-value < 0.001). (B) Heatmap of differentially expressed genes from total RNA sequencing data comparing tumor and non-tumor samples (*** p-value < 0.001). (C) PCA of bulk RNA-seq samples visualized according to the early prognosis. Patients with a bad prognosis could have had either progression or relapse of the tumor. (D) Heatmap of differentially expressed genes according to early prognosis data. (E) IPA analysis of the differentially expressed genes in tumor samples after bulk analysis showing the annotated biomarkers among the top 100 upregulated DEGs. (F) Plot showing GAINs and LOSSes in genomic regions obtained by SODEGIR analysis of total RNA-seq data integrated with CNV data from TGCA database.
Figure 4
Figure 4
Survival Kaplan-Meier curves of TCGA EAC patients. (A) The first two plots show the Kaplan-Meier curves with overall survival of TGCA EAC patients at 60 months separated according to their values of expression of the PREDA signature score, to the values of the DEGs signature reported from IPA as the biomarkers’ signature score. The last plot shows overall survival of TGCA EAC patients at 30 months separated according to their values of expression of the EPS score. (B) Kaplan-Meier curves with the overall survival of TGCA EAC patients at 30 months separated according to their values of expression of the CD4 Tcm cells signature (on the left) and the disease-free survival ones of our cohort of total RNA patients separated according to the CD8 exhausted expression score. p-values were calculated using the log-rank test. (C) Univariate Cox proportional hazards regression between the signatures, the main available clinical parameters used for the diagnosis of EAC, and the OS of TCGA patients at 30 or 60 months of follow-up; the size of the dots reflects the hazard ratio, the color represents the -log(p-value). (D) Multivariate Cox regression analysis of early prognosis signature with M, N and histological grade parameters (* p-value < 0.05).

References

    1. Coleman H.G., Xie S.H., Lagergren J. The Epidemiology of Esophageal Adenocarcinoma. Gastroenterology. 2018;154:390–405. doi: 10.1053/j.gastro.2017.07.046. - DOI - PubMed
    1. Fridman W.H., Pagès F., Sautès-Fridman C., Galon J. The immune contexture in human tumours: Impact on clinical outcome. Nat. Rev. Cancer. 2012;12:298–306. doi: 10.1038/nrc3245. - DOI - PubMed
    1. Fassan M., Cavallin F., Guzzardo V., Kotsafti A., Scarpa M., Cagol M., Chiarion-Sileni V., Maria Saadeh L., Alfieri R., Castagliuolo I., et al. PD-L1 expression, CD8+ and CD4+ lymphocyte rate are predictive of pathological complete response after neoadjuvant chemoradiotherapy for squamous cell cancer of the thoracic esophagus. Cancer Med. 2019;8:6036–6048. doi: 10.1002/cam4.2359. - DOI - PMC - PubMed
    1. Hong M., Tao S., Zhang L., Diao L.-T., Huang X., Huang S., Xie S.-J., Xiao Z.-D., Zhang H. RNA sequencing: New technologies and applications in cancer research. J. Hematol. Oncol. 2020;13:166. doi: 10.1186/s13045-020-01005-x. - DOI - PMC - PubMed
    1. Chung W., Eum H.H., Lee H.-O., Lee K.-M., Lee H.-B., Kim K.-T., Ryu H.S., Kim S., Lee J.E., Park Y.H., et al. Single-cell RNA-seq enables comprehensive tumour and immune cell profiling in primary breast cancer. Nat. Commun. 2017;8:15081. doi: 10.1038/ncomms15081. - DOI - PMC - PubMed

LinkOut - more resources