

Integrative Transcriptomic and Metabolic Analyses Reveal That Flavonoid Biosynthesis Is the Key Pathway Regulating Pigment Deposition in Naturally Brown Cotton Fibers
- PMID: 39124145
- PMCID: PMC11314106
- DOI: 10.3390/plants13152028
Integrative Transcriptomic and Metabolic Analyses Reveal That Flavonoid Biosynthesis Is the Key Pathway Regulating Pigment Deposition in Naturally Brown Cotton Fibers
Abstract
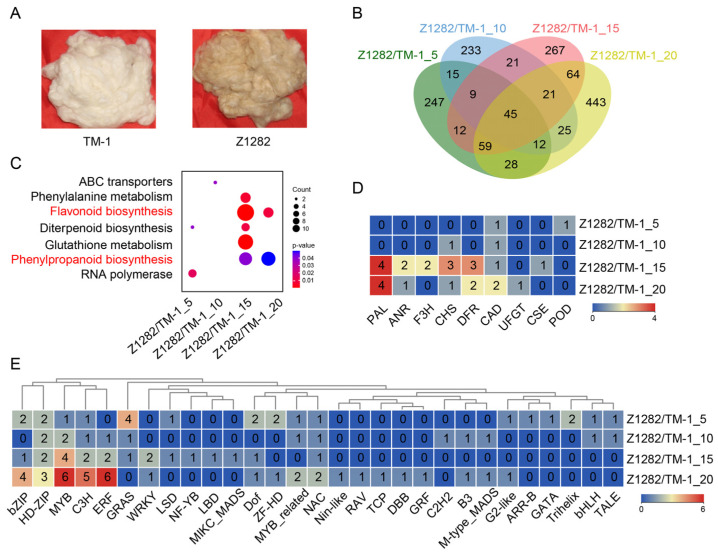
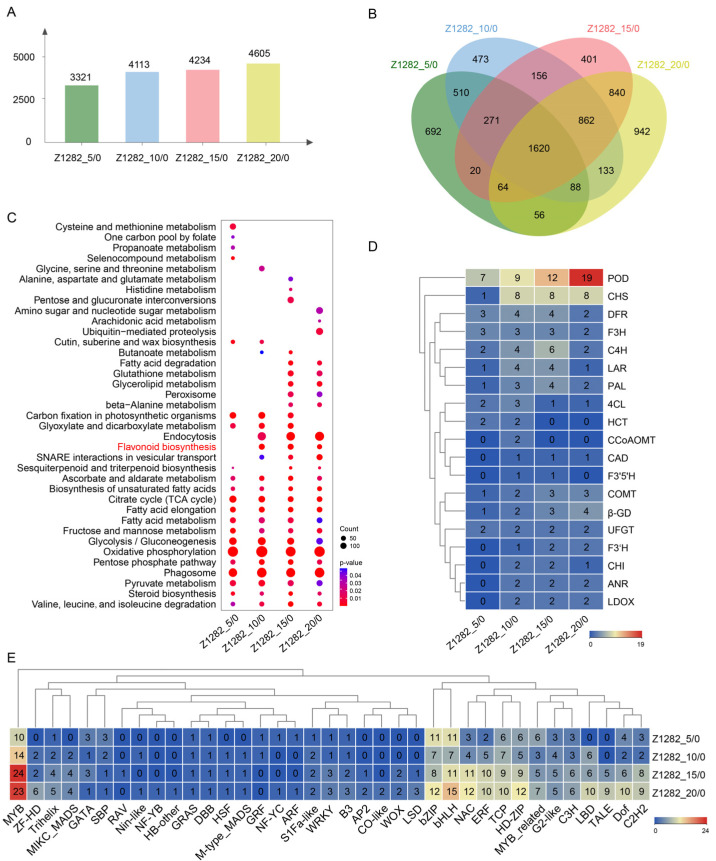
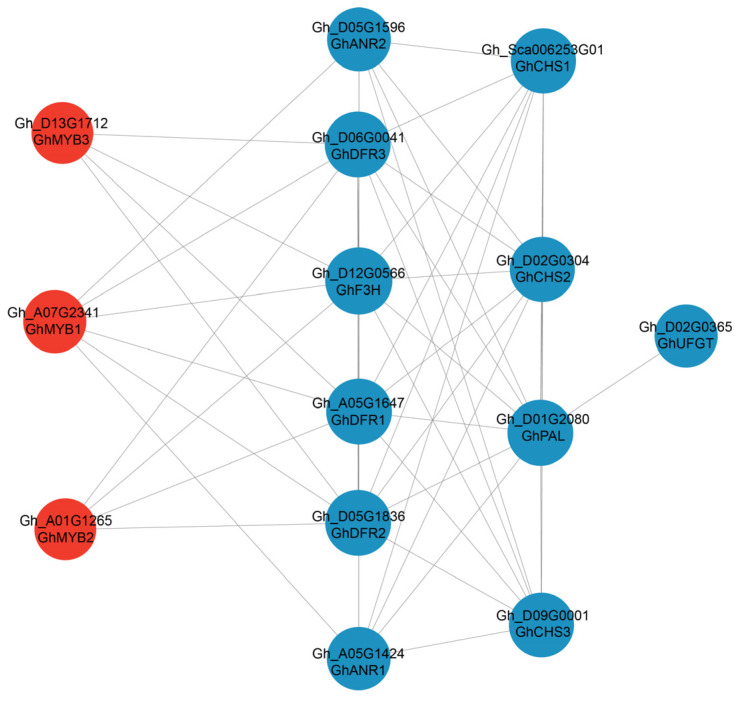
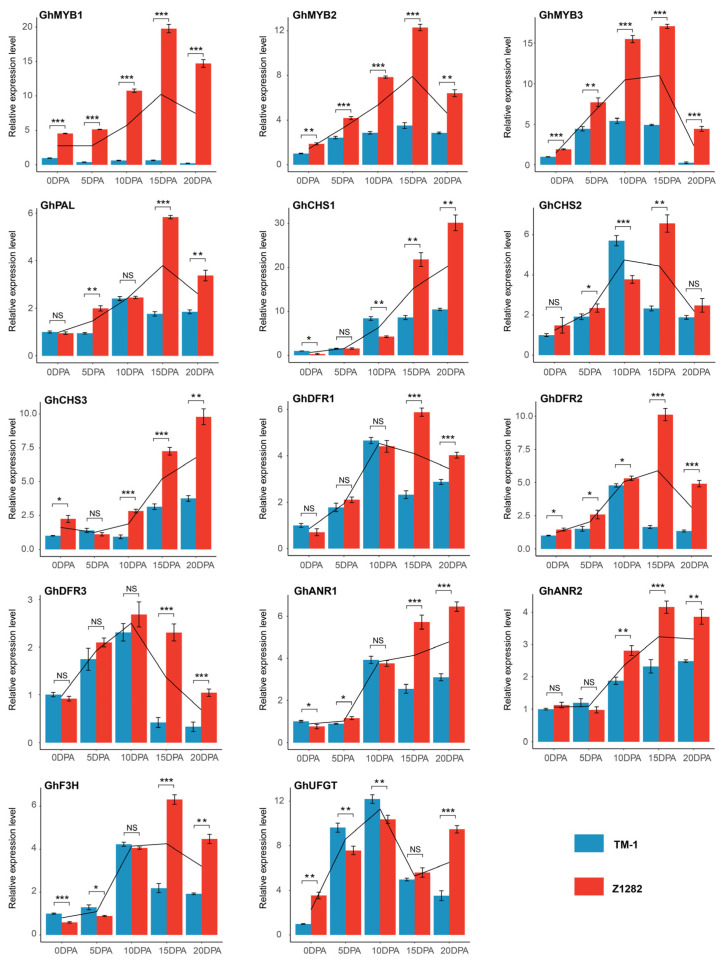
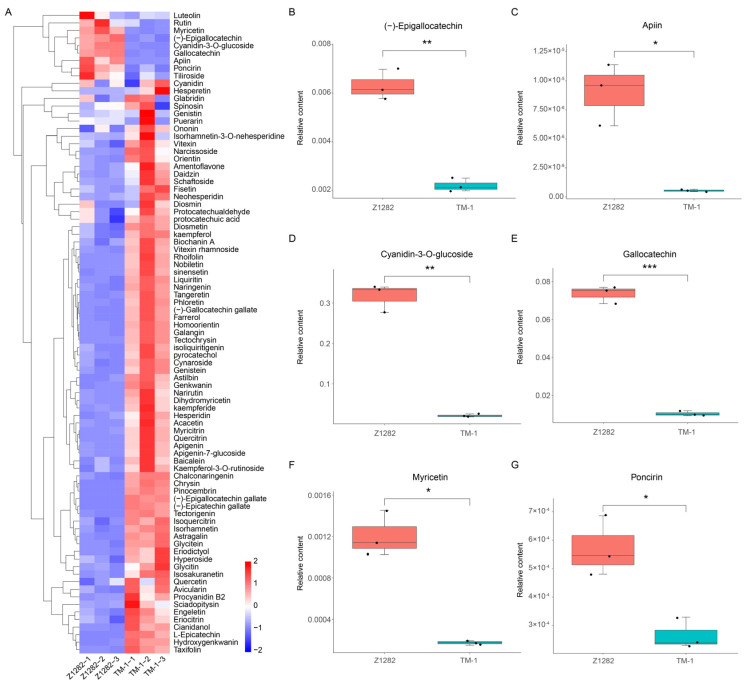
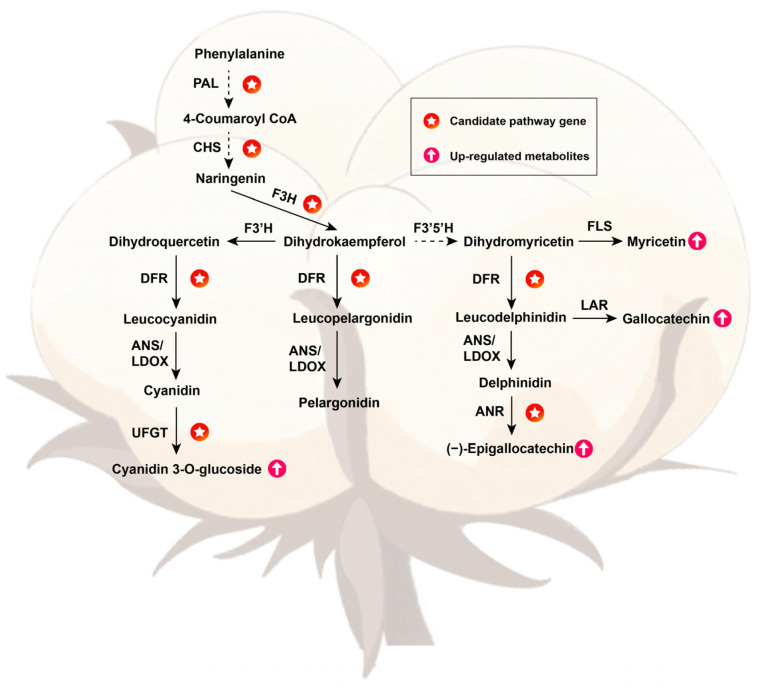
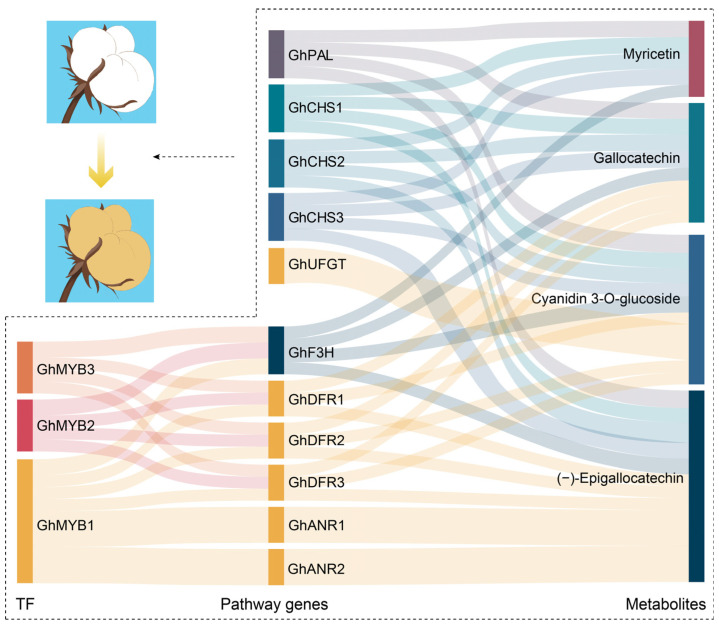
Brown cotton is a major cultivar of naturally colored cotton, and brown cotton fibers (BCFs) are widely utilized as raw materials for textile industry production due to their advantages of being green and dyeing-pollution-free. However, the mechanisms underlying the pigmentation in fibers are still poorly understood, which significantly limits their extensive applications in related fields. In this study, we conducted a multidimensional comparative analysis of the transcriptomes and metabolomes between brown and white fibers at different developmental periods to identify the key genes and pathways regulating the pigment deposition. The transcriptomic results indicated that the pathways of flavonoid biosynthesis and phenylpropanoid biosynthesis were significantly enriched regulatory pathways, especially in the late development periods of fiber pigmentation; furthermore, the genes distributed in the pathways of PAL, CHS, F3H, DFR, ANR, and UFGT were identified as significantly up-regulated genes. The metabolic results showed that six metabolites, namely (-)-Epigallocatechin, Apiin, Cyanidin-3-O-glucoside, Gallocatechin, Myricetin, and Poncirin, were significantly accumulated in brown fibers but not in white fibers. Integrative analysis of the transcriptomic and metabolomic data demonstrated a possible regulatory network potentially regulating the pigment deposition, in which three MYB transcription factors promote the expression levels of flavonoid biosynthesis genes, thereby inducing the content increase in (-)-Epigallocatechin, Cyanidin-3-O-glucoside, Gallocatechin, and Myricetin in BCFs. Our findings provide new insights into the pigment deposition mechanism in BCFs and offer references for genetic engineering and breeding of colored cotton materials.
Keywords: brown cotton fiber; flavonoid biosynthesis; metabolome; naturally colored cotton; pigment deposition; transcriptome.
Conflict of interest statement
Authors S.T., W.C. and Haifeng Liu are employed by the company China Colored-cotton (Group) Corporation. The remaining authors declare that this research was conducted in the absence of any commercial or financial relationships that could be construed as potential conflicts of interest.
Figures

Similar articles
-
Combined Analysis of Transcriptomes and Metabolomes Reveals That MeJA-Mediated Flavonoid Biosynthesis Is Crucial for Pigment Deposition in Naturally Colored Green Cotton Fibers.Genes (Basel). 2025 May 19;16(5):599. doi: 10.3390/genes16050599. Genes (Basel). 2025. PMID: 40428421 Free PMC article.
-
Transcriptome and Metabolome Profiling Unveil Pigment Formation Variations in Brown Cotton Lines (Gossypium hirsutum L.).Int J Mol Sci. 2023 Mar 9;24(6):5249. doi: 10.3390/ijms24065249. Int J Mol Sci. 2023. PMID: 36982328 Free PMC article.
-
Transcriptome Sequencing and Metabolome Analysis Reveal Genes Involved in Pigmentation of Green-Colored Cotton Fibers.Int J Mol Sci. 2019 Sep 29;20(19):4838. doi: 10.3390/ijms20194838. Int J Mol Sci. 2019. PMID: 31569469 Free PMC article.
-
Flavonoid biosynthesis controls fiber color in naturally colored cotton.PeerJ. 2018 Apr 18;6:e4537. doi: 10.7717/peerj.4537. eCollection 2018. PeerJ. 2018. PMID: 29682406 Free PMC article.
-
Naturally colored cotton for wearable applications.Front Plant Sci. 2024 Mar 21;15:1350405. doi: 10.3389/fpls.2024.1350405. eCollection 2024. Front Plant Sci. 2024. PMID: 38576792 Free PMC article. Review.
Cited by
-
Cotton metabolism regulatory network: Unraveling key genes and pathways in fiber development and growth regulation.Plant Commun. 2025 Mar 10;6(3):101221. doi: 10.1016/j.xplc.2024.101221. Epub 2024 Dec 12. Plant Commun. 2025. PMID: 39673124 Free PMC article.
-
Combined Analysis of Transcriptomes and Metabolomes Reveals That MeJA-Mediated Flavonoid Biosynthesis Is Crucial for Pigment Deposition in Naturally Colored Green Cotton Fibers.Genes (Basel). 2025 May 19;16(5):599. doi: 10.3390/genes16050599. Genes (Basel). 2025. PMID: 40428421 Free PMC article.
References
-
- Yuan S., Hua S., Malik W., Bibi N., Wang X. Physiological and biochemical dissection of fiber development in colored cotton. Euphytica. 2012;187:215–226. doi: 10.1007/s10681-012-0653-9. - DOI
Grants and funding
LinkOut - more resources
Full Text Sources
Molecular Biology Databases
