

Quantitative Analysis of Pb in Soil Using Laser-Induced Breakdown Spectroscopy Based on Signal Enhancement of Conductive Materials
- PMID: 39125103
- PMCID: PMC11314256
- DOI: 10.3390/molecules29153699
Quantitative Analysis of Pb in Soil Using Laser-Induced Breakdown Spectroscopy Based on Signal Enhancement of Conductive Materials
Abstract
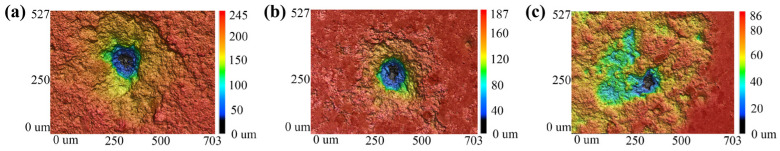
Studying efficient and accurate soil heavy-metal detection technology is of great significance to establishing a modern system for monitoring soil pollution, early warning and risk assessment, which contributes to the continuous improvement of soil quality and the assurance of food safety. Laser-induced breakdown spectroscopy (LIBS) is considered to be an emerging and effective tool for heavy-metal detection, compared with traditional detection technologies. Limited by the soil matrix effect, the LIBS signal of target elements for soil heavy-metal detection is prone to interference, thereby compromising the accuracy of quantitative detection. Thus, a series of signal-enhancement methods are investigated. This study aims to explore the effect of conductive materials of NaCl and graphite on the quantitative detection of lead (Pb) in soil using LIBS, seeking to find a reliable signal-enhancement method of LIBS for the determination of soil heavy-metal elements. The impact of the addition amount of NaCl and graphite on spectral intensity and parameters, including the signal-to-background ratio (SBR), signal-to-noise ratio (SNR), and relative standard deviation (RSD), were investigated, and the mechanism of signal enhancement by NaCl and graphite based on the analysis of the three-dimensional profile data of ablation craters and plasma parameters (plasmatemperature and electron density) were explored. Univariate and multivariate quantitative analysis models including partial least-squares regression (PLSR), least-squares support vector machine (LS-SVM), and extreme learning machine (ELM) were developed for the quantitative detection of Pb in soil with the optimal amount of NaCl and graphite, and the performance of the models was further compared. The PLSR model with the optimal amount of graphite obtained the best prediction performance, with an Rp that reached 0.994. In addition, among the three spectral lines of Pb, the univariate model of Pb I 405.78 nm showed the best prediction performance, with an Rp of 0.984 and the lowest LOD of 26.142 mg/kg. The overall results indicated that the LIBS signal-enhancement method based on conductive materials combined with appropriate chemometric methods could be a potential tool for the accurate quantitative detection of Pb in soil and could provide a reference for environmental monitoring.
Keywords: Pb; conductive materials; laser-induced breakdown spectroscopy; soil.
Conflict of interest statement
Author Peng Liu was employed by the company Beijing Construction Engineering Group Environmental Remediation Co., Ltd. Author Long Yu was employed by the company Wuhan Regen Environmental Remediation Co., Ltd. The remaining authors declare that the research was conducted in the absence of any commercial or financial relationships that could be construed as a potential conflict of interest.
Figures


References
-
- Basset C. Soil security: The cornerstone of national security in an era of global disruptions. Soil Secur. 2024;16:100154. doi: 10.1016/j.soisec.2024.100154. - DOI
-
- Telo da Gama J. The Role of Soils in Sustainability, Climate Change, and Ecosystem Services: Challenges and Opportunities. Ecologies. 2023;4:552–567. doi: 10.3390/ecologies4030036. - DOI
-
- Filote C., Roșca M., Hlihor R., Cozma P., Simion I., Apostol M., Gavrilescu M. Sustainable Application of Biosorption and Bioaccumulation of Persistent Pollutants in Wastewater Treatment: Current Practice. Processes. 2021;9:1696. doi: 10.3390/pr9101696. - DOI
-
- Khan J., Singh R., Upreti P., Yadav R.K. Geo-statistical assessment of soil quality and identification of Heavy metal contamination using Integrated GIS and Multivariate statistical analysis in Industrial region of Western India. Environ. Technol. Innov. 2022;28:102646. doi: 10.1016/j.eti.2022.102646. - DOI
Grants and funding
LinkOut - more resources
Full Text Sources
