

Evaluation of Progressive Architectural Distortion in Idiopathic Pulmonary Fibrosis Using Deformable Registration of Sequential CT Images
- PMID: 39125526
- PMCID: PMC11311668
- DOI: 10.3390/diagnostics14151650
Evaluation of Progressive Architectural Distortion in Idiopathic Pulmonary Fibrosis Using Deformable Registration of Sequential CT Images
Abstract
Background: Monitoring the progression of idiopathic pulmonary fibrosis (IPF) using CT primarily focuses on assessing the extent of fibrotic lesions, without considering the distortion of lung architecture.
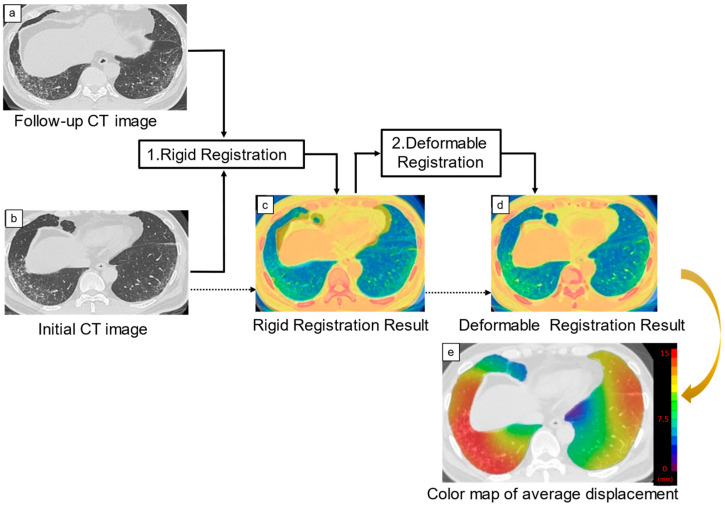
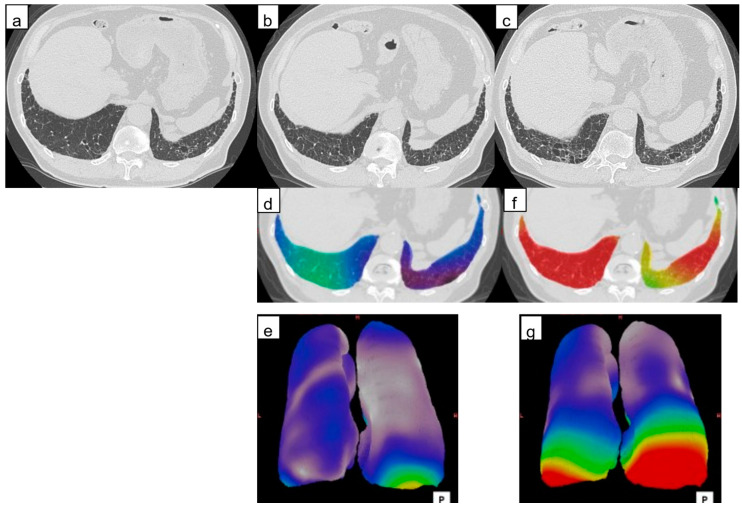
Objectives: To evaluate three-dimensional average displacement (3D-AD) quantification of lung structures using deformable registration of serial CT images as a parameter of local lung architectural distortion and predictor of IPF prognosis.
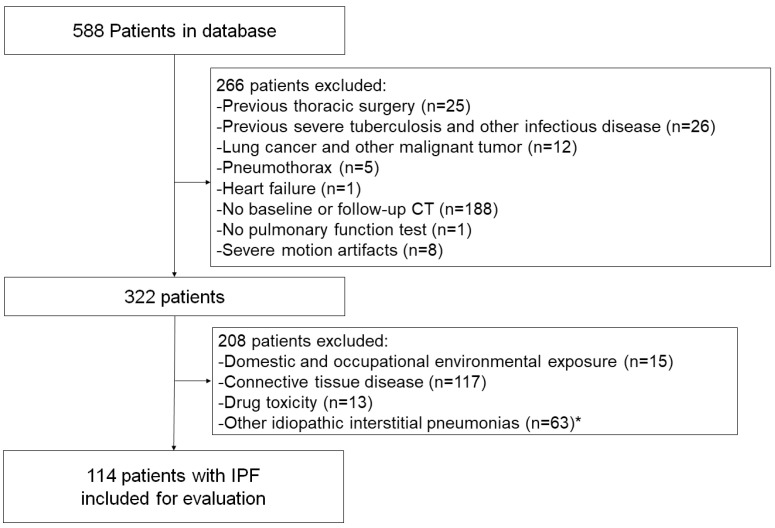
Materials and methods: Patients with IPF evaluated between January 2016 and March 2017 who had undergone CT at least twice were retrospectively included (n = 114). The 3D-AD was obtained by deformable registration of baseline and follow-up CT images. A computer-aided quantification software measured the fibrotic lesion volume. Cox regression analysis evaluated these variables to predict mortality.
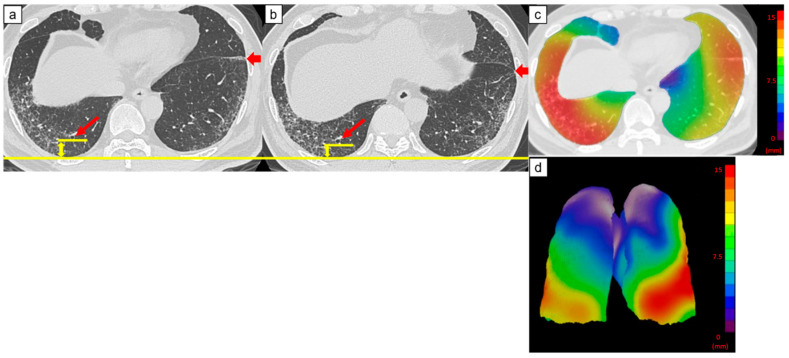
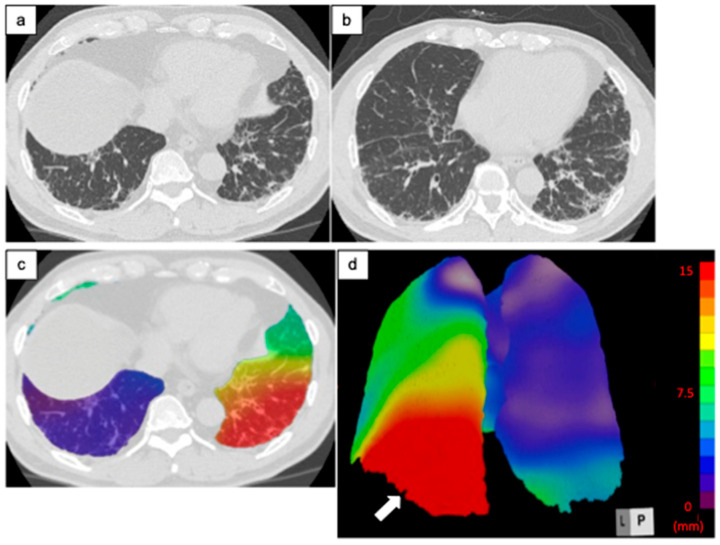
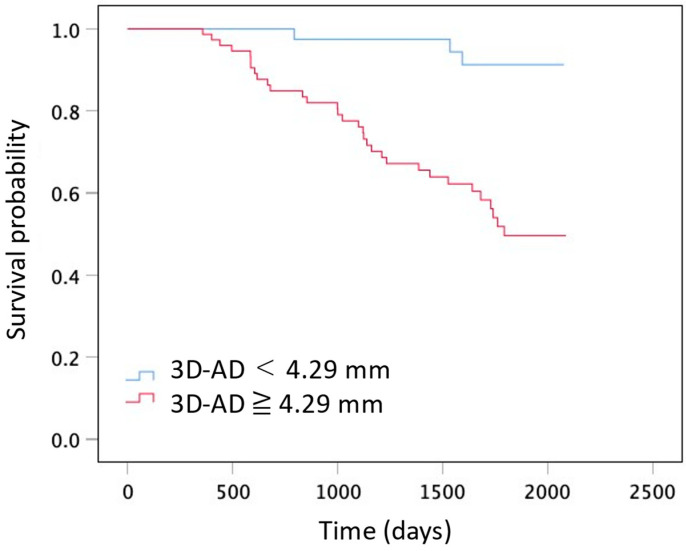
Results: The 3D-AD and the fibrotic lesion volume change were significantly larger in the subpleural lung region (5.2 mm (interquartile range (IQR): 3.6-7.1 mm) and 0.70% (IQR: 0.22-1.60%), respectively) than those in the inner region (4.7 mm (IQR: 3.0-6.4 mm) and 0.21% (IQR: 0.004-1.12%), respectively). Multivariable logistic analysis revealed that subpleural region 3D-AD and fibrotic lesion volume change were independent predictors of mortality (hazard ratio: 1.12 and 1.23; 95% confidence interval: 1.02-1.22 and 1.10-1.38; p = 0.01 and p < 0.001, respectively).
Conclusions: The 3D-AD quantification derived from deformable registration of serial CT images serves as a marker of lung architectural distortion and a prognostic predictor in patients with IPF.
Keywords: computed tomography; deformable image registration; idiopathic pulmonary fibrosis; progressive pulmonary fibrosis; three-dimensional average displacement.
Conflict of interest statement
Tae Iwasawa was provided the software (Quantification by Ziosoft Informatics Platform for interstitial lung disease, QZIP) by Ziosoft Inc. (Tokyo, Japan). Tae Iwasawa received a research grant from CANON Medical Systems. The remaining authors declare that the research was conducted in the absence of any commercial or financial relationships that could be construed as a potential conflict of interest.
Figures
Similar articles
-
Prognostic value of deep learning-based fibrosis quantification on chest CT in idiopathic pulmonary fibrosis.Eur Radiol. 2023 May;33(5):3144-3155. doi: 10.1007/s00330-023-09534-y. Epub 2023 Mar 16. Eur Radiol. 2023. PMID: 36928568
-
Serial decline in lung volume parameters on computed tomography (CT) predicts outcome in idiopathic pulmonary fibrosis (IPF).Eur Radiol. 2022 Apr;32(4):2650-2660. doi: 10.1007/s00330-021-08338-2. Epub 2021 Oct 30. Eur Radiol. 2022. PMID: 34716781 Free PMC article.
-
Standardised 3D-CT lung volumes for patients with idiopathic pulmonary fibrosis.Respir Res. 2022 Jun 1;23(1):142. doi: 10.1186/s12931-022-02062-1. Respir Res. 2022. PMID: 35650599 Free PMC article.
-
The importance of subpleural fibrosis in the prognosis of patients with idiopathic interstitial pneumonias.Eur J Radiol. 2017 May;90:106-113. doi: 10.1016/j.ejrad.2017.02.037. Epub 2017 Feb 22. Eur J Radiol. 2017. PMID: 28583621
-
Efficacy of antifibrotic drugs, nintedanib and pirfenidone, in treatment of progressive pulmonary fibrosis in both idiopathic pulmonary fibrosis (IPF) and non-IPF: a systematic review and meta-analysis.BMC Pulm Med. 2021 Dec 11;21(1):411. doi: 10.1186/s12890-021-01783-1. BMC Pulm Med. 2021. PMID: 34895203 Free PMC article.
References
-
- Raghu G., Remy-Jardin M., Richeldi L., Thomson C.C., Inoue Y., Johkoh T., Kreuter M., Lynch D.A., Maher T.M., Martinez F.J., et al. Idiopathic pulmonary fibrosis (an update) and progressive pulmonary fibrosis in adults: An official ATS/ERS/JRS/ALAT clinical practice guideline. Am. J. Respir. Crit. Care Med. 2022;205:e18–e47. doi: 10.1164/rccm.202202-0399ST. - DOI - PMC - PubMed
-
- Raghu G., Remy-Jardin M., Myers J.L., Richeldi L., Ryerson C.J., Lederer D.J., Behr J., Cottin V., Danoff S.K., Morell F., et al. Diagnosis of idiopathic pulmonary fibrosis. An official ATS/ERS/JRS/ALAT clinical practice guideline. Am. J. Respir. Crit. Care Med. 2018;198:e44–e68. doi: 10.1164/rccm.201807-1255ST. - DOI - PubMed
-
- Jacob J., Aksman L., Mogulkoc N., Procter A.J., Gholipour B., Cross G., Barnett J., Brereton C.J., Jones M.G., van Moorsel C.H., et al. Serial CT analysis in idiopathic pulmonary fibrosis: Comparison of visual features that determine patient outcome. Thorax. 2020;75:648–654. doi: 10.1136/thoraxjnl-2019-213865. - DOI - PMC - PubMed
-
- Jacob J., Bartholmai B.J., Rajagopalan S., Kokosi M., Nair A., Karwoski R., Raghunath S.M., Walsh S.L.F., Wells A.U., Hansell D.M. Automated quantitative computed tomography versus visual computed tomography scoring in idiopathic pulmonary fibrosis: Validation against pulmonary function. J. Thorac. Imaging. 2016;31:304–311. doi: 10.1097/RTI.0000000000000220. - DOI - PubMed
LinkOut - more resources
Full Text Sources
