. 2024 Jul 24;25(15):8075.
doi: 10.3390/ijms25158075.

The Regulation of Frontal Cortex Cholesterol Metabolism Abnormalities by NR3C1/NRIP1/NR1H2 Is Involved in the Occurrence of Stress-Induced Depression

Affiliations

The Regulation of Frontal Cortex Cholesterol Metabolism Abnormalities by NR3C1/NRIP1/NR1H2 Is Involved in the Occurrence of Stress-Induced Depression

Rui Shi et al. Int J Mol Sci. .

Abstract

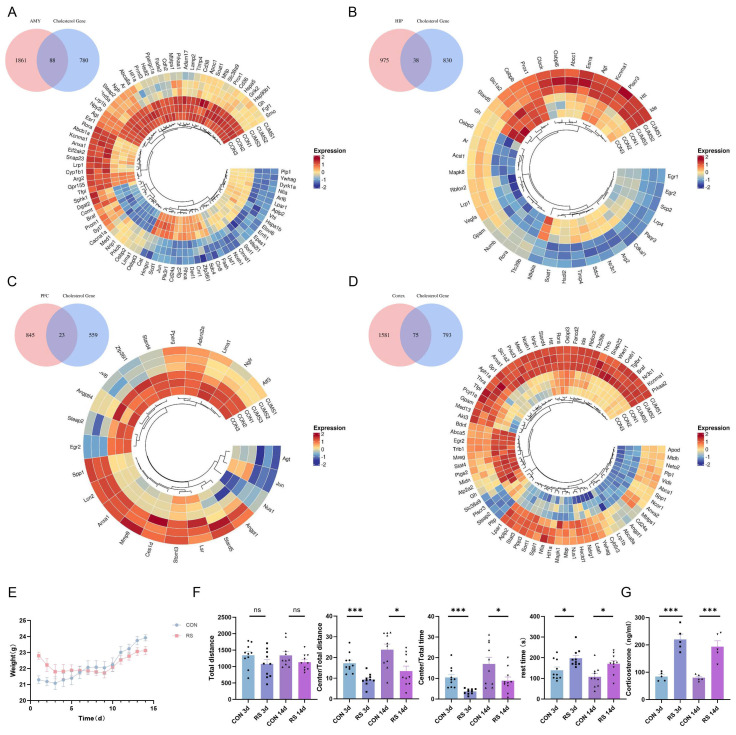
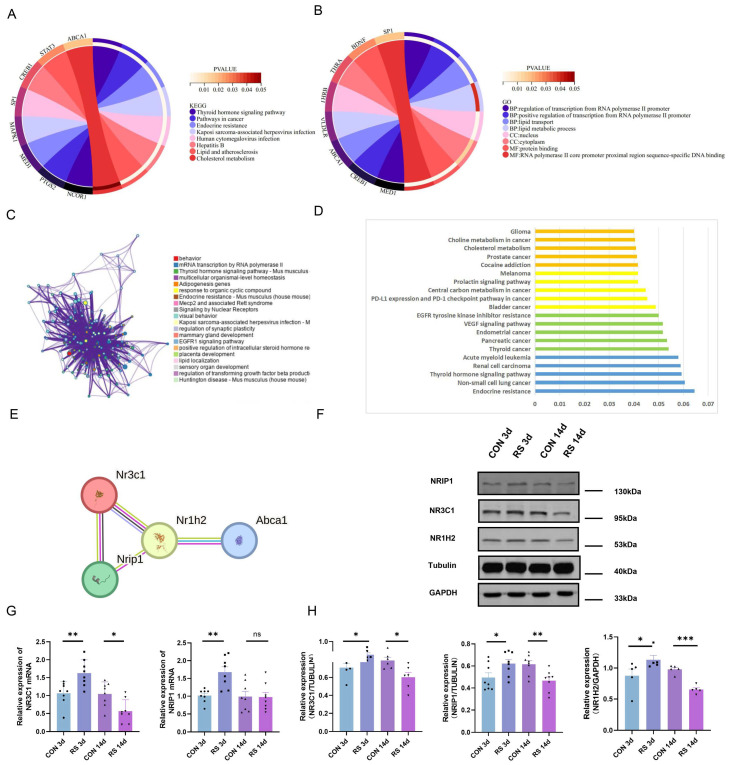
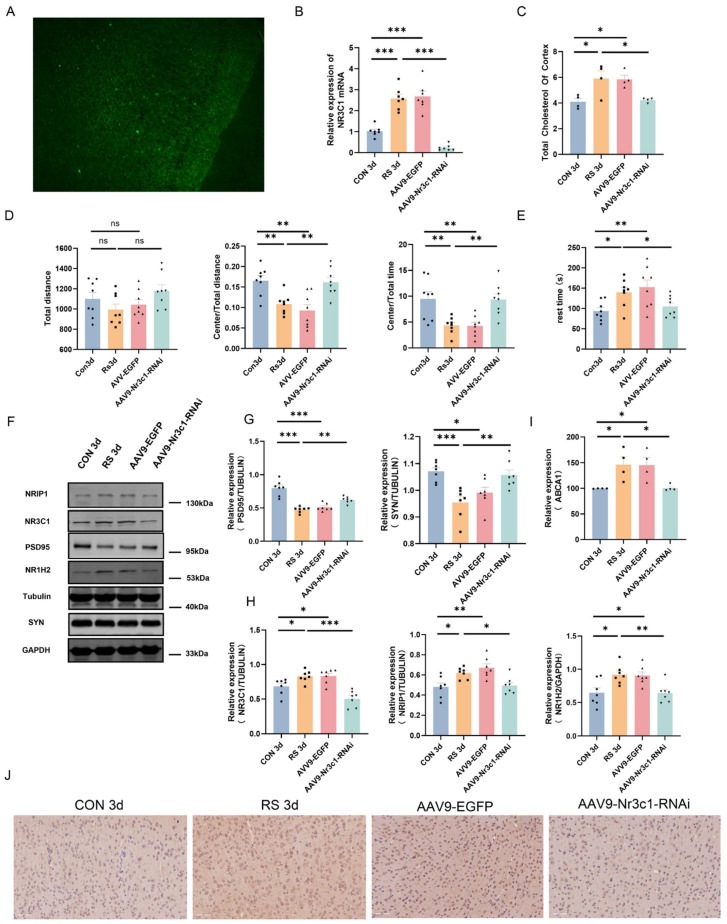
Stress-induced alterations in central neuron metabolism and function are crucial contributors to depression onset. However, the metabolic dysfunctions of the neurons associated with depression and specific molecular mechanisms remain unclear. This study initially analyzed the relationship between cholesterol and depression using the NHANES database. We then induced depressive-like behaviors in mice via restraint stress. Applying bioinformatics, pathology, and molecular biology, we observed the pathological characteristics of brain cholesterol homeostasis and investigated the regulatory mechanisms of brain cholesterol metabolism disorders. Through the NHANES database, we initially confirmed a significant correlation between cholesterol metabolism abnormalities and depression. Furthermore, based on successful stress mouse model establishment, we discovered the number of cholesterol-related DEGs significantly increased in the brain due to stress, and exhibited regional heterogeneity. Further investigation of the frontal cortex, a brain region closely related to depression, revealed stress caused significant disruption to key genes related to cholesterol metabolism, including HMGCR, CYP46A1, ACAT1, APOE, ABCA1, and LDLR, leading to an increase in total cholesterol content and a significant decrease in synaptic proteins PSD-95 and SYN. This indicates cholesterol metabolism affects neuronal synaptic plasticity and is associated with stress-induced depressive-like behavior in mice. Adeno-associated virus interference with NR3C1 in the prefrontal cortex of mice subjected to short-term stress resulted in reduced protein levels of NRIP1, NR1H2, ABCA1, and total cholesterol content. At the same time, it increased synaptic proteins PSD95 and SYN, effectively alleviating depressive-like behavior. Therefore, these results suggest that short-term stress may induce cholesterol metabolism disorders by activating the NR3C1/NRIP1/NR1H2 signaling pathway. This impairs neuronal synaptic plasticity and consequently participates in depressive-like behavior in mice. These findings suggest that abnormal cholesterol metabolism in the brain induced by stress is a significant contributor to depression onset.

Keywords: NR3C1/NRIP1/NR1H2 pathway; cholesterol metabolism; depression; frontal cortex.


Conflict of interest statement

The authors declare no conflicts of interest.

Figures

Figure 1
Figure 1
Dysregulation of Cholesterol Metabolism in the Mouse Brain under Stress. (AD) Analysis of stress−induced changes in cholesterol-related genes across different brain regions. Heatmap of DEGs with increasing and decreasing trend. Each column represents a sample, and each gene is visualized in a row. Red indicates a high abundance of the gene, and blue indicates a relatively low abundance of the gene. (E) Changes in body weight of mice. (F) In the SPT, the model group mice showed a significant decrease in the distance traveled in the central zone, and time spent in the central zone. In the TST, the immobility time of the modeling mice significantly increased (from 13 mice, n = 13). (G) Plasma cortisol measured in mice. Values are expressed as the mean ± SEM, * p < 0.05, *** p < 0.001 vs. the control group.
Figure 2
Figure 2
Dysregulation of Cholesterol Metabolism in the Mouse Brain under Stress. HE staining and thionine staining revealed edema in the amygdala, hippocampus, prefrontal cortex, and cortex of stressed mice.The enlarged image is located in the bottom right corner boxes. The scale bars in the figure are all 100 µm.
Figure 3
Figure 3
Dysregulation of Cholesterol Metabolism in the Mouse Brain under Stress. (A) Representative Western blot images and densitometric quantification of PSD-95 and SYN in the frontal cortex (n = 6). (B) Total cholesterol content in serum and frontal cortex of mice (from 4 mice, repeated twice, n = 8). (C) The mRNA level of HMGCR, LDLR, ABCA1, ACAT1, CYP46A1, APOE (from 4 mice, repeated twice, n = 8). (D,F) Representative micrographs and quantitative analysis of ABCA1 immunohistochemical staining in the frontal cortex (from 3 mice, repeated twice, n = 6). (E,GI) Representative Western blot images and densitometric quantification of HMGCR, CYP46A1, and ACAT1 in the frontal cortex (from 6 mice, repeated tests were conducted with the smallest statistically significant value of n, including HMGCR (n = 10), CYP46A1 (n = 6), and ACAT1 (n = 8)). Values are expressed as the mean ± SEM, * p < 0.05, ** p < 0.01, *** p < 0.001 vs. the control group.
Figure 4
Figure 4
NR3C1/NRIP1/NR1H2 Pathway Involved in Depression-Like Behavior Induced by Short-Term Stress. (A) GO pathway enrichment results from intersecting genes. (B) Signal pathway of KEGG enrichment analysis. (C) The enriched terms in the Metascape database. (D) PPI network of 75 cholesterol−related genes in the STRING database. The color of the lines indicates the type of interaction evidence. (E) PPI network of 22 hub target genes.
Figure 5
Figure 5
NR3C1/NRIP1/NR1H2 Pathway Involved in Depression−Like Behavior Induced by Short−Term Stress. (A,B) GO and KEGG enrichment analysis in the KOBAS database. (C) Enriched terms for central node genes in the Metascape database. (D) Enriched terms for central node genes in the KOBAS database. (E) PPI network of NR3C1, NRIP1, NR1H2 and ABCA1. (G) The mRNA level of NR3C1 and NRIP1 (from 4 mice, repeated twice, n = 8). (FH) Representative Western blot images and densitometric quantification of NR3C1, NRIP1, and NR1H2 in the frontal cortex (from 6 mice, repeated tests were conducted with the smallest statistically significant value of n, including NR3C1 (n = 6), NRIP1 (n = 8), and NR1H2 (n = 5)). Values are expressed as the mean ± SEM, * p < 0.05, ** p < 0.01, *** p < 0.001 vs. the control group.
Figure 6
Figure 6
NR3C1/NRIP1/NR1H2 Pathway Involved in Depression−Like Behavior Induced by Short-Term Stress. (A) Immunofluorescence staining was performed in the frontal cortex after injecting inhibitory virus AAV9−Nr3c1−RNAi. (B) The mRNA level of NR3C1 (from 4 mice, repeated tests were conducted with the smallest statistically significant value of n, n = 7). (C) Total cholesterol content in the frontal cortex of mice (from 4 mice, n = 4). (D,E) In the OFT, the ratio of central activity distance to total distance, as well as the ratio of central activity time to total time in the SPT increased. The immobility time in the TST decreased (from 8 mice, n = 8). (FH) Representative Western blot images and densitometric quantification of NR3C1, NRIP1, NR1H2, PSD-95, and SYN in the frontal cortex (from 4 mice, repeated tests were conducted with the smallest statistically significant value of n, n = 7). (I,J) Representative micrographs and quantitative analysis of ABCA1 immunohistochemical staining in the frontal cortex (from 4 mice, n = 4). Values are expressed as the mean ± SEM, * p < 0.05, ** p < 0.01, *** p < 0.001 vs. the control group.

Similar articles

References

    1. Lu J., Xu X., Huang Y., Li T., Ma C., Xu G., Yin H., Xu X., Ma Y., Wang L., et al. Prevalence of depressive disorders and treatment in China: A cross-sectional epidemiological study. Lancet Psychiatry. 2021;8:981–990. doi: 10.1016/S2215-0366(21)00251-0. - DOI - PubMed
    1. Smith K. Mental health: A world of depression. Nature. 2014;515:181. doi: 10.1038/515180a. - DOI - PubMed
    1. Wray N.R., Ripke S., Mattheisen M., Trzaskowski M., Byrne E.M., Abdellaoui A., Adams M.J., Agerbo E., Air T.M., Andlauer T.M.F., et al. Genome-wide association analyses identify 44 risk variants and refine the genetic architecture of major depression. Nat. Genet. 2018;50:668. doi: 10.1038/s41588-018-0090-3. - DOI - PMC - PubMed
    1. Beurel E., Toups M., Nemeroff C.B. The Bidirectional Relationship of Depression and Inflammation: Double Trouble. Neuron. 2020;107:234–256. doi: 10.1016/j.neuron.2020.06.002. - DOI - PMC - PubMed
    1. Tartt A.N., Mariani M.B., Hen R., Mann J.J., Boldrini M. Dysregulation of adult hippocampal neuroplasticity in major depression: Pathogenesis and therapeutic implications. Mol. Psychiatry. 2022;27:2689–2699. doi: 10.1038/s41380-022-01520-y. - DOI - PMC - PubMed

LinkOut - more resources