. 2024 Jul 30;25(15):8306.
doi: 10.3390/ijms25158306.

An Optimized Peptide Antagonist of CXCR4 Limits Survival of BCR-ABL1-Transformed Cells in Philadelphia-Chromosome-Positive B-Cell Acute Lymphoblastic Leukemia

Affiliations

An Optimized Peptide Antagonist of CXCR4 Limits Survival of BCR-ABL1-Transformed Cells in Philadelphia-Chromosome-Positive B-Cell Acute Lymphoblastic Leukemia

Johanna Pohl et al. Int J Mol Sci. .

Abstract

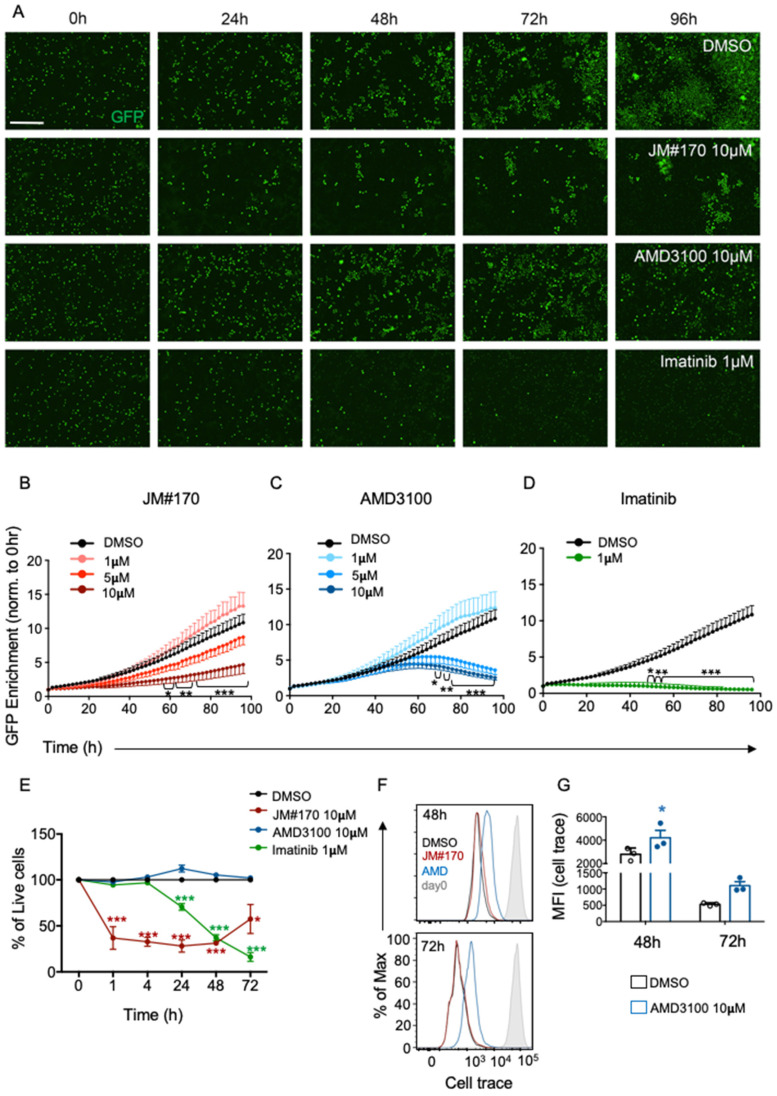
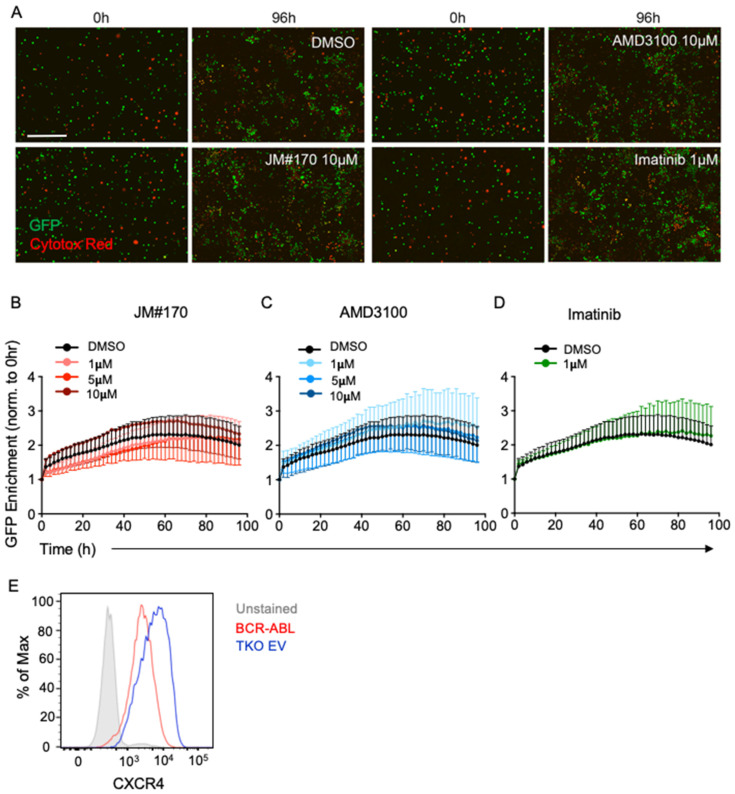
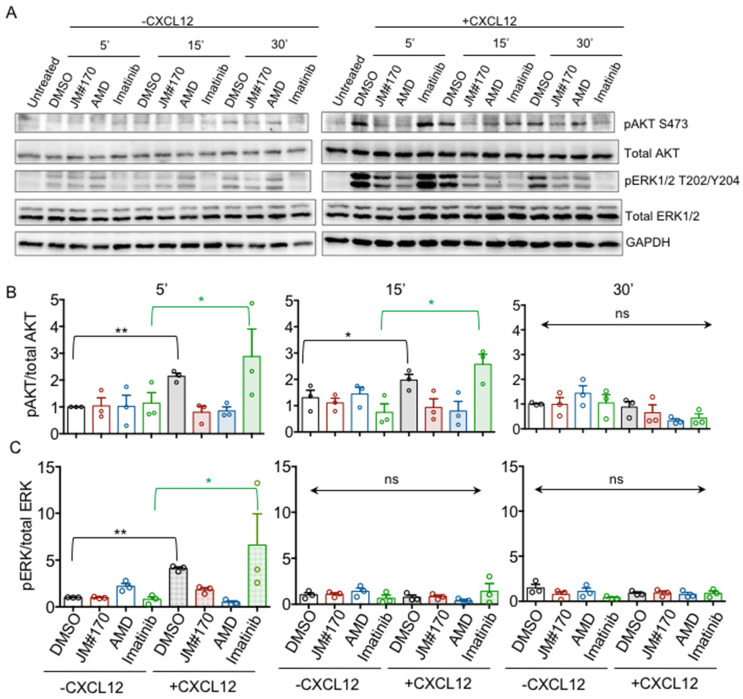
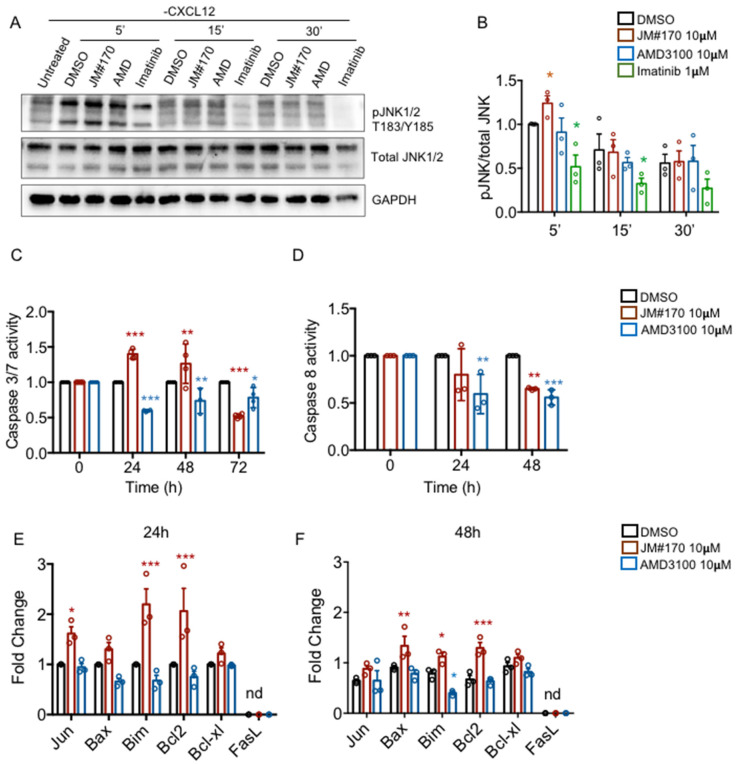
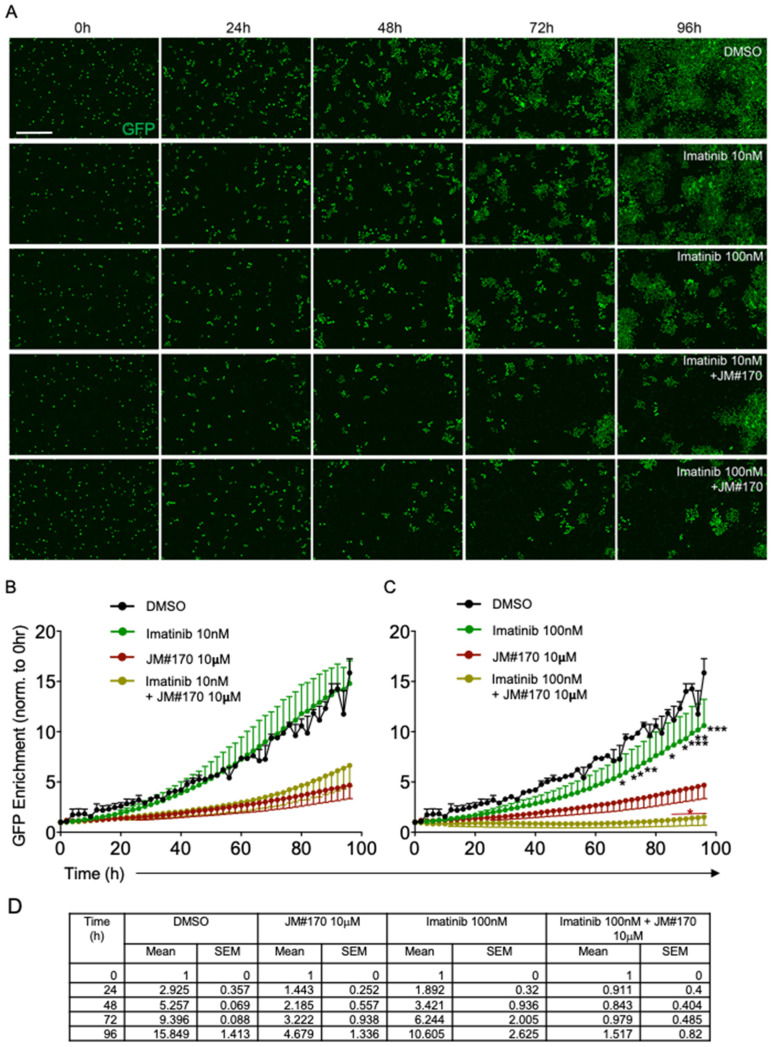
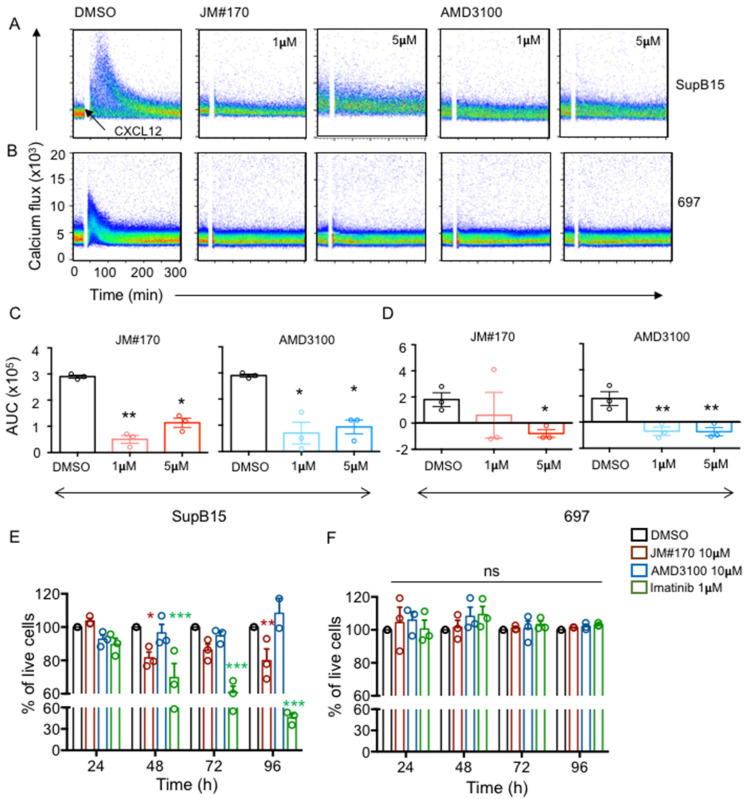
Philadelphia-chromosome-positive acute lymphoblastic leukemia (Ph+ ALL) is characterized by reciprocal chromosomal translocation between chromosome 9 and 22, leading to the expression of constitutively active oncogenic BCR-ABL1 fusion protein. CXC chemokine receptor 4 (CXCR4) is essential for the survival of BCR-ABL1-transformed mouse pre-B cells, as the deletion of CXCR4 induces death in these cells. To investigate whether CXCR4 inhibition also effectively blocks BCR-ABL1-transformed cell growth in vitro, in this study, we explored an array of peptide-based inhibitors of CXCR4. The inhibitors were optimized derivatives of EPI-X4, an endogenous peptide antagonist of CXCR4. We observed that among all the candidates, EPI-X4 JM#170 (referred to as JM#170) effectively induced cell death in BCR-ABL1-transformed mouse B cells but had little effect on untransformed wild-type B cells. Importantly, AMD3100, a small molecule inhibitor of CXCR4, did not show this effect. Treatment with JM#170 induced transient JNK phosphorylation in BCR-ABL1-transformed cells, which in turn activated the intrinsic apoptotic pathway by inducing cJun, Bim, and Bax gene expressions. Combinatorial treatment of JM#170 with ABL1 kinase inhibitor Imatinib exerted a stronger killing effect on BCR-ABL1-transformed cells even at a lower dose of Imatinib. Surprisingly, JM#170 actively killed Sup-B15 cells, a BCR-ABL1+ human ALL cell line, but had no effect on the BCR-ABL1- 697 cell line. This suggests that the inhibitory effect of JM#170 is specific for BCR-ABL1+ ALL. Taken together, JM#170 emerges as a potent novel drug against Ph+ ALL.

Keywords: AMD3100; BCR–ABL1; CXCR4; EPI-X4 derivatives; Imatinib; cell survival.


Conflict of interest statement

M.H. and J.M. are co-inventors of pending and issued patents that claim to use EPI-X4 (ALB408-423) and its derivatives for the therapy of CXCR4-associated diseases.

Figures

Figure 1
Figure 1
Effect of JM#170 on cellular growth in BCR–ABL1-transformed mouse B cells. (A) Real-time imaging of BCR–ABL1-transformed mouse B cells treated with solvent (DMSO), 10 µM JM#170 or AMD3100 or 1 µM Imatinib over 96 h. Images are representative of one experiment out of n = 4–5. Scale bar: 200µm. (B,C) Quantification of GFP+ cell enrichment as a marker of BCR–ABL1 cell growth in control (DMSO) and different (1, 5, and 10 µM) concentrations of JM#170 (B) and AMD3100 (C) treated cells over 96 h. The count of GFP+ cells for each time point for each treatment was normalized with respect to the corresponding count at 0 h. Graph represents mean ± SEM, n = 4–5. (D) Similar quantification in control (DMSO) and 1 µM Imatinib-treated cells. Graph represents mean ± SEM, n = 5. Statistical analysis—two-way ANOVA with Dunnett’s multiple comparison test. * p < 0.05, ** p < 0.01, *** p < 0.001. (E) Flow cytometric analysis of viability of BCR–ABL1 cells treated with solvent (DMSO), 10 µM JM#170 or AMD3100, or 1 µM Imatinib over the indicated time period. The live cell count for each treatment for each time point was normalized with the corresponding live cell count for DMSO and is represented as a percentage. Graph represents mean ± SEM, n = 3. Statistical analysis—two-way ANOVA with Sidak’s multiple comparison test. * p < 0.05, *** p < 0.001. (F) Flow cytometric analysis of proliferation of BCR–ABL1 cells treated with DMSO and 10 µM each of JM#170 and AMD3100 for the indicated time period. (G) Quantification of cell trace dye dilution, represented by the median fluorescence intensity (MFI) of the dye in DMSO and AMD3100-treated BCR–ABL1 cells after 48 and 72 h of treatment. Bar represents mean ± SEM, n = 3. Statistical analysis—two-way ANOVA with Sidak’s multiple comparison test. * p < 0.05.
Figure 2
Figure 2
Effect of JM#170 on cellular growth in untransformed mouse bone marrow B cells. (A) Real-time imaging of bone marrow B cells derived from Rag2−/− λ5−/− Slp65−/− TKO mice treated with solvent (DMSO), 10 µM of JM#170 or AMD3100, or 1 µM Imatinib over 96 h. Cells expressed intrinsic GFP and were labeled with Cytotox Red dye to measure cell death. Images are representative of one experiment of n = 3. Scale bar: 200 µm. (B,C) Quantification of GFP+ cell enrichment as a marker of TKO cell growth in control (DMSO) and treatments with different (1, 5, and 10 µM) concentrations of JM#170 (B)- and AMD3100 (C) over 96 h. The count of GFP+ cells for each time point for each treatment was normalized with respect to the corresponding count at 0 h. Graph represents mean ± SEM, n = 3. (D) Similar quantification in control (DMSO) and 1 µM Imatinib-treated TKO cells. Graph represents mean ± SEM, n = 3. (E) Histogram showing CXCR4 expression on the surface of BCR–ABL1 (red line) and TKO (blue line) cells. Grey-filled histogram represents unstained sample. Statistical analysis—two-way ANOVA with Dunnett’s multiple comparison test.
Figure 3
Figure 3
Inhibitory effect of JM#170 on CXCL12-induced CXCR4-downstream signal activation in BCR–ABL1 cells. (A) Western blot analysis depicting the level of AKT and ERK1/2 phosphorylation in BCR–ABL1 cells treated with DMSO, 10 µM of JM#170 or AMD3100, and 1 µm Imatinib for the indicated time period in the absence (left panel) and presence (right panel) of CXCL12 stimulation. GAPDH was used as the loading control. Image representative of n = 3 independent experiments. (B,C) Quantification of AKT (B) and ERK1/2 (C) phosphorylation for the Western blotting presented in (A). The band intensity of the phosphoprotein was normalized with respect to the total protein for each treatment and is represented as fold change with respect to 5 min DMSO (considering 5 min DMSO as 1). Bar represents mean ± SEM, n = 3. Each circle represents one individual experiment. Statistical analysis—one-way ANOVA with Sidak’s multiple comparison test. * p < 0.05, ** p < 0.01. ns: not significant.
Figure 4
Figure 4
JM#170 induces intrinsic apoptosis in BCR–ABL1 cells. (A) Western blot analysis depicting the level of JNK1/2 phosphorylation in BCR–ABL1 cells treated with DMSO, 10 µM of JM#170 or AMD3100, and 1 µM Imatinib for the indicated time period in the absence of any CXCL12 stimulation. GAPDH was used as the loading control. Image representative of n = 3 independent experiments. (B) Quantification of JNK1/2 phosphorylation, as shown in (A). The band intensity of the phosphoprotein was normalized with respect to the total protein for each treatment and is represented as fold change with respect to 5 min DMSO (considering 5 min DMSO as 1). Bar represents mean ± SEM, n = 3. Each circle represents one individual experiment. Statistical analysis—two-way ANOVA with Dunnett’s multiple comparison test. * p < 0.05. (C,D) Analysis of caspase 3/7 (C) and caspase 8 (D) activity in BCR–ABL1 cells treated with DMSO or 10 µM each of JM#170 and AMD3100 for the indicated time period. Values of each time point were normalized with respect to the corresponding DMSO. Bar represents mean ± SEM, n = 3. Statistical analysis—two-way ANOVA with Dunnett’s multiple comparison test. * p < 0.05, ** p < 0.01, *** p < 0.001. (E,F) Real-time gene expression analysis depicting the relative expression of the pro/anti-apoptotic genes in BCR–ABL1 cells treated with DMSO, 10 µM JM#170 or AMD3100 for 24 (E) and 48 h (F). Bar represents mean ± SEM, n = 3. Statistical analysis—two-way ANOVA with Dunnett’s multiple comparison test. * p < 0.05, ** p < 0.01, *** p < 0.001. nd: not detected.
Figure 5
Figure 5
JM#170 acts synergistically with Imatinib to strongly inhibit BCR–ABL1 cell survival. (A) Real-time imaging of BCR–ABL1 cells treated with DMSO, 10 or 100 nM Imatinib, and 10 or 100 nM Imatinib in combination with 10 µM JM#170 over 96 h. Images are representative of three independent experiments. Scale bar: 200 µm. (B) Quantification of GFP enrichment as a marker of BCR–ABL1 cell growth in DMSO, 10 nM Imatinib, and 10 nM Imatinib in combination with 10 µM JM#170 treated cells over 96 h. The count of GFP+ cells for each time point for each treatment was normalized with respect to the corresponding count at 0 h. The 10 µM JM#170 plot (dark red) was taken from Figure 1B to facilitate comparison. (C) Similar quantification of GFP enrichment in DMSO, 100 nM Imatinib, and 100 nM Imatinib in combination with 10 µM JM#170. Graph represents mean ± SEM, n = 3. Statistical analysis—two-way ANOVA with Dunnett’s multiple comparison test. Black *: comparison with respect to DMSO, dark red *: comparison with JM#170 alone. * p < 0.05, ** p < 0.01, *** p < 0.001. (D) Table representing the normalized GFP+ cell counts for the different treatment groups at the indicated time points.
Figure 6
Figure 6
JM#170 efficiently blocks CXCR4 activation in BCR–ABL1-positive human ALL cell line and induces cell death. (A,B) Flow cytometric measurement of CXCL12-driven calcium flux in SupB15 (A) and 697 (B) cells treated with solvent (DMSO), 1 or 5 µM JM#170, and 1 or 5 µM AMD3100. The baseline was measured for 30 s, which was followed by the addition of 100 ng/mL human CXCL12 (black arrow), and the signal was recorded for a total of 5 min. Images representative of three independent experiments. (C,D) Quantification of the above calcium flux analysis for SupB15 (C) and 697 (D) cells treated with DMSO (black), 1 µM (light red) and 10 µM (red) JM#170 and 1 µM (light blue) and 10 µM (blue) AMD3100. The area under the curve (AUC) for each measurement was calculated, and the AUC of the water control (solvent control of CXCL12) was subtracted from each measurement. The subtracted values are plotted as mean ± SEM, n = 3. Statistical analysis—one-way ANOVA with Dunnett’s multiple comparison test. * p < 0.05, ** p < 0.01. (E,F) Flow cytometric analysis of cell survival of SupB15 (E) and 697 (F) cells treated with solvent DMSO, 10 µM JM#170 or AMD3100, or 1 µM Imatinib over the indicated time period. The live cell count for each treatment for each time point was normalized to the corresponding live cell count for DMSO and is represented as a percentage. Graph represents mean ± SEM, n = 3. Each circle represents one individual experiment. Statistical analysis—two-way ANOVA with Dunnett’s multiple comparison test. * p < 0.05, ** p < 0.01, *** p < 0.001.

Similar articles

Cited by

References

    1. Ribeiro R.C., Abromowitch M., Raimondi S.C., Murphy S.B., Behm F., Williams D.L. Clinical and biologic hallmarks of the Philadelphia chromosome in childhood acute lymphoblastic leukemia. Blood. 1987;70:948–953. doi: 10.1182/blood.V70.4.948.948. - DOI - PubMed
    1. Rowley J.D. Letter: A new consistent chromosomal abnormality in chronic myelogenous leukaemia identified by quinacrine fluorescence and Giemsa staining. Nature. 1973;243:290–293. doi: 10.1038/243290a0. - DOI - PubMed
    1. Collins S.J., Groudine M.T. Rearrangement and amplification of c-abl sequences in the human chronic myelogenous leukemia cell line K-562. Proc. Natl. Acad. Sci. USA. 1983;80:4813–4817. doi: 10.1073/pnas.80.15.4813. - DOI - PMC - PubMed
    1. Ottmann O.G., Pfeifer H. Management of Philadelphia chromosome-positive acute lymphoblastic leukemia (Ph+ ALL) Hematol. Am. Soc. Hematol. Educ. Program. 2009:371–381. doi: 10.1182/asheducation-2009.1.371. - DOI - PubMed
    1. Cross S.A., Lyseng-Williamson K.A. Imatinib: In relapsed or refractory Philadelphia chromosome-positive acute lymphoblastic leukaemia. Drugs. 2007;67:2645–2654. doi: 10.2165/00003495-200767170-00013. - DOI - PubMed

MeSH terms

LinkOut - more resources