. 2024 Aug 2;25(15):8440.
doi: 10.3390/ijms25158440.

Arylphthalide Delays Diabetic Retinopathy via Immunomodulating the Early Inflammatory Response in an Animal Model of Type 1 Diabetes Mellitus

Affiliations

Arylphthalide Delays Diabetic Retinopathy via Immunomodulating the Early Inflammatory Response in an Animal Model of Type 1 Diabetes Mellitus

Francisco Martín-Loro et al. Int J Mol Sci. .

Abstract

Diabetic retinopathy (DR) is one of the most prevalent secondary complications associated with diabetes. Specifically, Type 1 Diabetes Mellitus (T1D) has an immune component that may determine the evolution of DR by compromising the immune response of the retina, which is mediated by microglia. In the early stages of DR, the permeabilization of the blood-retinal barrier allows immune cells from the peripheral system to interact with the retinal immune system. The use of new bioactive molecules, such as 3-(2,4-dihydroxyphenyl)phthalide (M9), with powerful anti-inflammatory activity, might represent an advance in the treatment of diseases like DR by targeting the immune systems responsible for its onset and progression. Our research aimed to investigate the molecular mechanisms involved in the interaction of specific cells of the innate immune system during the progression of DR and the reduction in inflammatory processes contributing to the pathology. In vitro studies were conducted exposing Bv.2 microglial and Raw264.7 macrophage cells to proinflammatory stimuli for 24 h, in the presence or absence of M9. Ex vivo and in vivo approaches were performed in BB rats, an animal model for T1D. Retinal explants from BB rats were cultured with M9. Retinas from BB rats treated for 15 days with M9 via intraperitoneal injection were analyzed to determine survival, cellular signaling, and inflammatory markers using qPCR, Western blot, or immunofluorescence approaches. Retinal structure images were acquired via Spectral-Domain-Optical Coherence Tomography (SD-OCT). Our results show that the treatment with M9 significantly reduces inflammatory processes in in vitro, ex vivo, and in vivo models of DR. M9 works by inhibiting the proinflammatory responses during DR progression mainly affecting immune cell responses. It also induces an anti-inflammatory response, primarily mediated by microglial cells, leading to the synthesis of Arginase-1 and Hemeoxygenase-1(HO-1). Ultimately, in vivo administration of M9 preserves the retinal integrity from the degeneration associated with DR progression. Our findings demonstrate a specific interaction between both retinal and systemic immune cells in the progression of DR, with a differential response to treatment, mainly driven by microglia in the anti-inflammatory action. In vivo treatment with M9 induces a switch in immune cell phenotypes and functions that contributes to delaying the DR progression, positioning microglial cells as a new and specific therapeutic target in DR.

Keywords: HO1; M2 response; arylphthalides; diabetic retinopathy; immunomodulation; inflammation; microglia; type 1 diabetes mellitus.


Conflict of interest statement

The authors declare no conflicts of interest.

Figures

Figure 1
Figure 1
M9 effects on cellular viability and nitrites production in LPS-stimulated microglial and macrophage cells. Viability was determined using crystal violet staining in Bv.2 microglial cells (A) and Raw264.7 macrophage cells (B). Cells were treated for 24 h with different concentrations of M9 (0.1–25 μM). Nitrites accumulation was analyzed and compared to the basal levels in Bv.2 microglial cells (C) and Raw264.7 macrophage cells (D). Cell cultures were treated with LPS (200 ng/mL), M9 (10 μM), or LPS plus M9 (1 and 10 μM) for 24 h. The results are presented as mean ± S.E.M. The fold change relative to the basal condition is shown. (n = 4 independent experiments) * p ≤ 0.05 vs. basal, # p ≤ 0.05 vs. LPS, and φ p ≤ 0.05 vs. LPS + M9 (1 μM) treatment (one-way ANOVA followed by Bonferroni t-test). ns (no significant differences).
Figure 2
Figure 2
Protective effects of M9 against LPS stimulation of proinflammatory mediators in microglial and macrophage cells. Nos2 mRNA values were determined using qRT-PCR in Bv.2 microglial cells (A) and Raw264.7 macrophage cells (B) after treatment with LPS (200 ng/mL), M9 (10 µM), or LPS plus M9 for 24 h. iNOS protein levels were analyzed using Western blot in protein extracts from above Bv.2 microglial cells (C) or Raw264.7 macrophage cells (D) treated with LPS, M9, or LPS + M9. α-tubulin was used as loading control. Il1b, Il6, and Tnfa mRNA levels were determined using qRT-PCR in Bv.2 microglial cells (E) and Raw264.7 macrophage cells (F). Data were normalized to Gapdh gene expression. The results are presented as means ± S.E.M (n = 5 independent experiments). Fold changes are calculated relative to the basal value. * p ≤ 0.05 vs. basal treatment, # p ≤ 0.05 vs. LPS treatment (one-way ANOVA followed by Bonferroni t-test).
Figure 3
Figure 3
Protective effects of M9 against LPS-mediated activation of the inflammasome in microglia and macrophage cells. Bv.2 microglial cells and Raw264.7 macrophage cells were treated for 24 h with LPS (200 ng/mL) or LPS plus M9 (10 µM). (A) Bv.2 microglial cells and (B) Raw264.7 macrophage cells; Nlrp3 mRNA levels were determined using qRT-PCR. Data were normalized to Gapdh gene expression. Protein extracts from Bv.2 microglia cells (C) and Raw264.7 macrophage cells (D) were analyzed using Western blot with antibody against IL1β. α-Tubulin was used as a loading control. The results are presented as mean ± S.E.M. The fold change relative to the basal condition is shown. * p ≤ 0.05 vs. basal treatment, # p ≤ 0.05 vs. LPS treatment (one-way ANOVA followed by Bonferroni t-test).
Figure 4
Figure 4
The anti-inflammatory response is mediated by HO-1 and arginase-1 in Bv.2 microglial and Raw264.7 macrophage cells. Bv.2 microglial cells and Raw264.7 macrophage cells were treated for 24 h with LPS (200 ng/mL) or LPS plus M9 (10 µM). Protein extracts from Bv.2 microglial cells (A,E) and Raw264.7 macrophage cells (B,F) were analyzed using Western blot with antibodies against HO-1 and arginase-1. α-Tubulin was used as a loading control. Arg1 mRNA levels in Bv.2 microglial cells (C) and Raw264.7 macrophage cells (D) were determined using qRT-PCR. Data were normalized to Gapdh gene expression The results are presented as mean ± S.E.M. The fold change relative to the basal condition is shown. * p ≤ 0.05 vs. basal treatment, # p ≤ 0.05 vs. LPS treatment (one-way ANOVA followed by Bonferroni t-test).
Figure 5
Figure 5
M9 inhibited the activation of NFkB-mediated signaling with P38α-MAPK phosphorylation in LPS-stimulated microglial cells. Bv.2 microglial cells were treated for 24 h with LPS (200 ng/mL) or LPS plus M9 (10 µM) for the time course indicated. (A) Protein extracts were analyzed using Western blot with antibodies against phosphorylated(p)-P38α MAPK, total P38α-MAPK, (B) phosphorylated (p)-JNK, and total JNK. α-Tubulin was used as a loading control. The results are presented as mean ± S.E.M. The ratios between the indicated proteins and the fold changes relative to the basal values are shown. * p ≤ 0.05 vs. basal treatment, & p ≤ 0.05 vs. LPS treatment (one-way ANOVA followed by Bonferroni t-test). (C) Confocal immunofluorescence assessment of the nuclear translocation of P65-NFkB (green channel). Nuclear regions were determined by counterstaining nuclear DNA with DAPI (blue channel). White arrows indicate the P65-NFkB nuclear or cytoplasmic localization.
Figure 6
Figure 6
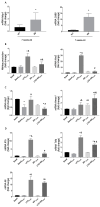
Macrophage-conditioned medium stimulated with LPS or LPS + M9 induces the inflammatory response of the microglia. Macrophage markers in the retina from 7-week-old BB and WT rats. (A) Mcp1 and Cd68 mRNA values were determined using qRT-PCR. (n = 5 retina per condition). Bv.2 microglial cells were treated for 24 h with conditioned medium from Raw264.7 cells cultured previously with LPS (200 ng/mL) or LPS plus M9 (10 µM) for 24 h. (B) Nitrite accumulation was analyzed and related to the basal levels, and Nos2 mRNA values were determined using qRT-PCR. Data were normalized to Gapdh gene expression. (C) Anti-inflammatory mediators Arg1 and Hmox1 mRNA values were analyzed using qRT-PCR. (D) Proinflammatory cytokines Il1b, Tnfa, and Il6 mRNA values were determined using qRT-PCR. Data were normalized to Gapdh gene expression. The results are presented as mean ± S.E.M (n = 4 independent experiments). Fold changes are calculated relative to the basal value. * p ≤ 0.05 vs. basal treatment, # p ≤ 0.05 vs. LPSCond treatment, & p ≤ 0.05 vs. basalCond treatment (one-way ANOVA followed by Bonferroni t-test; or t-test).
Figure 7
Figure 7
M9 treatment in retinal explants from BB rats decreased inflammatory events and induced anti-inflammatory response. Retinal explants from 7-week-old BB rats were treated for 24 h with M9 (20 μM) or vehicle. (A) Il1b, Tnfa, Il6, and Nlpr3 mRNA values were determined using qRT-PCR. Data were normalized to Gapdh gene expression. (B) Protein extracts were analyzed using Western blot with antibodies against iNOS, arginase-1, or HO-1. α-Tubulin was used as a loading control. The results are presented as mean ± S.E.M (n = 5 retina per condition). The fold change relative to the basal condition is shown. * p ≤ 0.05 vs. BB retinal explant basal condition value (t-test). (C) Retinal explants from 7-week-old BB rats were treated for 24 h with M9 (20 μM) (right panel) or with vehicle (left panel). Immunostaining for GFAP (green) was carried out in whole retinas. Representative images are shown (n = 5 retinas per condition).
Figure 8
Figure 8
M9 treatment reduces in vivo DR progression in BB rats. BB rats were treated with M9 (600 µg/kg/day) via i.p. for 15 days. (A) Total, INL, and ONL retinal thickness measured on SD-OCT. The results are presented as mean ± S.E.M. * p ≤ 0.05 vs. BB rat 7-weeks old, # p ≤ 0.05 vs. BB rat vehicle value. (B) Il1b, Tnfa, and Nlpr3 mRNA values were determined using qRT-PCR. Data were normalized to Gapdh gene expression. Fold changes are calculated relative to the basal value. * p ≤ 0.05 vs. BB rat vehicle condition value (t-test). (C) Protein extracts were analyzed using Western blot with antibodies against arginase-1, HO-1, or NLRP3. α-Tubulin was used as a loading control. (D) GFAP immunostaining (green) in retinal sections counterstained with DAPI (blue). (E) Immunostaining and (F) quantification of arginase-1 (red) (arginase-1+) and IBA-1 (IBA-1+) (green) positive cells in retinal sections counterstained with DAPI (blue). Data are expressed as mean ± SD (n = 6 retinas per condition). * p-value < 0.05, Student’s t-test between IBA-1+ and arginase-1+ cell subtypes. Scale = 20 μm. Dashed boxes indicate the zoom area showed. White arrows indicate the immune colocalization for arginase-1+ and IBA-1+ cells (yellow). ONL (outer nuclear layer), INL (inner nuclear layer), and GCL (ganglion cell layer).

References

    1. Mayer-Davis E.J., Lawrence J.M., Dabelea D., Divers J., Isom S., Dolan L., Imperatore G., Linder B., Marcovina S., Pettitt D.J., et al. Incidence Trends of Type 1 and Type 2 Diabetes among Youths, 2002–2012. N. Engl. J. Med. 2017;376:1419–1429. doi: 10.1056/NEJMoa1610187. - DOI - PMC - PubMed
    1. Forbes J.M., Cooper M.E. Mechanisms of diabetic complications. Physiol. Rev. 2013;93:137–188. doi: 10.1152/physrev.00045.2011. - DOI - PubMed
    1. Mrugacz M., Bryl A., Zorena K. Retinal vascular endothelial cell dysfunction and neuroretinal degeneration in diabetic patients. J. Clin. Med. 2021;10:458. doi: 10.3390/jcm10030458. - DOI - PMC - PubMed
    1. Marium R., Khan M., Jia Z., Chua Y., Tan J.C., Yang Y., Liao Z., Zhao Y. From Pre-Diabetes to Diabetes: Diagnosis, Treatments and Translational Research. Medicina. 2019;55:546. doi: 10.3390/medicina55090546. - DOI - PMC - PubMed
    1. Funatsu H., Noma H., Mimura T., Eguchi S., Hori S. Association of Vitreous Inflammatory Factors with Diabetic Macular Edema. Ophthalmology. 2009;116:73–79. doi: 10.1016/j.ophtha.2008.09.037. - DOI - PubMed

MeSH terms

LinkOut - more resources